Council on Energy, Environment and Water Integrated | International | Independent
Suggested citation: Khan, Adeel, Uday Suryanarayanan, Tanushree Ganguly, and Karthik Ganesan. Improving Air Quality Management through Forecasts: A Case Study of Delhi’s Air Pollution of Winter 2021. New Delhi: Council on Energy, Environment and Water.
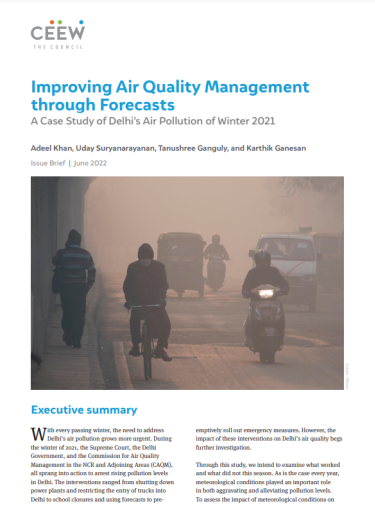
This study assesses Delhi’s air pollution scenario in the winter of 2021 and the actions to tackle it. Winter 2021 was unlike previous winters as the control measures mandated by the Commission of Air Quality Management (CAQM) in Delhi National Capital Region and adjoining areas were rolled out. These measures included the Graded Response Action Plan (GRAP) and additional emergency responses instituted on the basis of air quality and meteorological forecasts. Given that the forecasts play a major role in emergency response measures, the study assesses the reliability of different forecasts. Further, it gauges the impact of the emergency measures on Delhi’s air quality levels. It also discusses the primary driver of air pollution in winter 2021.
With every passing winter, the need to address Delhi’s air pollution grows more urgent. During the winter of 2021, the Supreme Court, the Delhi Government, and the Commission for Air Quality Management in the NCR and Adjoining Areas (CAQM), all sprang into action to arrest rising pollution levels in Delhi. The interventions ranged from shutting down power plants and restricting the entry of trucks into Delhi to school closures and using forecasts to pre-emptively roll out emergency measures. However, the impact of these interventions on Delhi’s air quality begs further investigation.
Through this study, we intend to examine what worked and what did not this season. As is the case every year, meteorological conditions played an important role in both aggravating and alleviating pollution levels. To assess the impact of meteorological conditions on pollution levels, we analysed pollution levels during the months of October to January vis-a-vis meteorological parameters. To understand the driving causes of pollution in the winter of 2021, we tracked the changes in relative contribution of various polluting sources as the season progressed.
While pre-emptive actions based on forecasts was a step in the right direction, an assessment of forecast performance is a prerequisite to integrating them in decision-making. We also assessed the performance of forecasts by comparing them with the measured onground concentrations. We also studied the timing and effectiveness of emergency directions issued in response to forecasts.
We sourced data on pollution levels from Central Pollution Control Board’s (CPCB) real-time air quality data portal and meteorological information from ECMWF Reanalysis v5 (ERA5). For information on modelled concentration and source contributions, we used data from publicly available air quality forecasts, including Delhi’s Air Quality Early Warning System (AQ-EWS) (3-day and 10-day), the Decision Support System for Air Quality Management in Delhi (DSS), and UrbanEmissions.Info (UE).
Figure ES1 In Delhi, 75% of Winter 2021 saw 'very poor' to 'severe' air quality
Source: Authors’ analysis, data from Central Pollution Control Board (CPCB).
Note: Air quality index (AQI) for the day is calculated using the PM2.5 concentration at the same stations with a minimum of 75 per cent of the data being available.
The number of ‘Severe’ plus ‘Very poor’ air quality days during the winter has not decreased in the last three years (Figure ES1). During the winter of 2021 (15 October 2021 - 15 January 2022), about 75 per cent of the days, air quality were in the ‘Very poor’ to ‘Severe’ category. Interestingly, despite more farm fire incidents in Punjab, Haryana, and Uttar Pradesh in 2021 compared to 2020, Delhi’s PM2.5 concentration during the stubble burning phase (i.e., 15 October to 15 November) was lesser in 2021. This was primarily due to better meteorological conditions like higher wind speed and more number of rainy days during this period.
We find that about 64 per cent of Delhi’s winter pollution load comes from outside Delhi’s boundaries (Figure ES2(a). Biomass burning of agricultural waste during the stubble burning phase and burning for heating and cooking needs during peak winter are estimated to be the major sources of air pollution from outside the city according to UE (Figure ES2(b). Locally, transport (12 per cent), dust (7 per cent), and domestic biomass burning (6 per cent) contribute the most to the PM2.5 pollution load of the city. While transport and dust are perennial sources of pollution in the city, the residential space heating component is a seasonal source. However, this seasonal contribution is so significant that as the use of biomass as a heat source in and around Delhi starts going up as winter progresses, the residential sector becomes the single-largest contributor by 15 December (Figure ES2(b)). This indicates the need to ramp up programmes to encourage households to shift to cleaner fuels for cooking and space heating.
Figure ES 2(a) Transport, dust, and domestic biomass burning are the largest local contributors to the PM2.5 pollution load in Delhi
Source: Authors’ analysis, source contribution data from DSS and UE.
Note: Modelled estimates of relative source contributions retrieved from UE and DSS.
Figure ES 2(b) Both local and regional sources need to be targeted for reducing Delhi’s pollution
Source: Authors’ analysis, source contribution data from UE.
Note: Source contribution data retrieved from UE district products which have larger geographical cover and lower resolution.
The availability of multiple forecasts provides decisionmakers with a range of options to choose from. At the same time, this is an obstacle to effective onground action. To streamline the flow of relevant information from forecasters to decision-makers, it is important to analyse the forecasts and assess their reliability. We found that all the forecasts identified pollution trends accurately (Figure ES3) but their accuracy in predicting pollution episodes (‘Severe’ and ‘Very Poor’ air quality days) decreases with future time horizon.
In November–December 2021, apart from the Graded Response Action Plan (GRAP) coming into effect in DelhiNCR, the CAQM introduced several emergency response measures through a series of directions and orders. The Supreme Court also stepped in from time to time to direct the authorities to act on air pollution.
As a first, the CAQM used air quality and meteorological forecasts to time and tailor emergency response actions. The first set of restrictions was put in place on 16 November 2021, and all were lifted by 20 December 2021, save the one on industrial operations.
Figure ES3 All the forecasts can predict the trend accurately
Source: Authors’ analysis, data from Central Pollution Control Board (CPCB), AQ-EWS, and UE.
Note: r represents correlation.
During this period, all the forecasts except AQ-EWS (3-day) underpredicted PM2.5 levels. Therefore, by looking at the difference between forecasted and measured concentrations, it is not possible to gauge the effectiveness of the restrictions conclusively. Hence, multiple models or different modelling experiments are needed to estimate the impact of the intervention.
It should be noted that during the restriction period, air quality did not descend into the ‘Severe +’ category. Further, when all the restrictions were in place along with better meteorology, air quality did improve from ‘Severe’ to ‘Poor’. The first prolonged ‘Severe’ air quality period in December was witnessed between 21 December and 26 December. While the forecasts sounded an alarm for high pollution levels during this period, all restrictions barring those on industrial activities were lifted. Subsequently, PM2.5 levels remained above 250 µgm-3 for six straight days resulting in the longest ‘Severe’ air quality spell of the season. (Figure ES4).
Figure ES4 The lifting of the restrictions was ill-timed with high pollution levels forecasted in the following days
Source: Authors’ analysis, data from Central Pollution Control Board (CPCB).
Note: C&D stands for construction and demolition activities. Work from home (WFH) stands for the 50% cap on employee attendance in the office. Industrial restrictions stand for compulsory switching over to Piped Natural Gas (PNG) or other cleaner fuels within industries and non-compliant industries being allowed to operate restrictively.
The discussion above highlights that despite the emergency measures taken in winter 2021, the air quality conditions were far from satisfactory. Calibrating emergency responses to forecasted source contributions may result in a greater impact on air quality. Our study recommends the following to help the Government of National Capital Territory of Delhi ( GNCTD) and CAQM plan and execute emergency responses better:
Assessing Effectiveness of India’s Industrial Emission Monitoring Systems
Catalysing Local Action for Clean Air
Best Practices in CEM (Continuous Emission Monitoring)
What is Polluting India’s Air? The Need for an Official Air Pollution Emissions Database
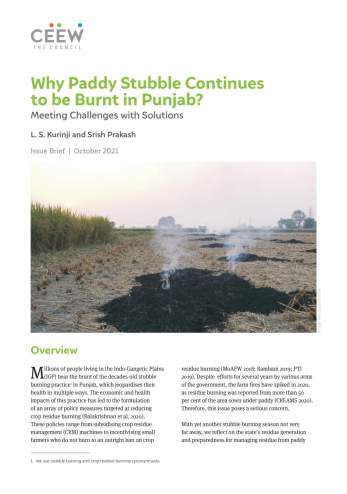
Why Paddy Stubble Continues to be Burnt in Punjab?