Council on Energy, Environment and Water Integrated | International | Independent
Suggested Citation: Patidar, Rishabh, Kartheek Nitturu, Deepak Yadav, and Hemant Mallya, 2024. Evaluating Net-zero Trajectories for the Indian Fertiliser Industry: Marginal Abatement Cost Curves of Carbon Mitigation Technologies. New Delhi: Council on Energy, Environment and Water.
This report evaluates emission mitigation options to achieve net-zero carbon emissions through marginal abatement cost (MAC) curves for the existing plants in the fertiliser industry. MAC curves were developed for three major fertilisers produced in India, which account for 85 per cent of total fertiliser production—urea, di-ammonium phosphate (DAP), and other complex fertilisers (OCF). Data was collected at the plant level along with some overarching assumptions like stoichiometric consumption of ammonia to produce fertiliser, 100 per cent natural gas consumption to produce urea among others, and key inputs obtained from literature and conversations with industry experts.
The Indian fertiliser industry is the second largest producer of fertiliser in the world, with a production capacity of ~58 million tonnes per annum (Mtpa) in 2022–23. The urea, DAP, and OCF industries emitted nearly 25 million tonnes of CO₂ for the ~43 million tonnes produced in the same year, equating to an emission intensity of 0.58 tCO₂/t-fertiliser. Of the total emissions, 85 per cent of the emission in the fertiliser sector is due to the use of natural gas as fuel and feedstock while only 15 per cent of the emissions results from electricity use. This study evaluates emission mitigation measures to achieve net-zero carbon emissions under four pillars: energy efficiency (EE), renewable power, alternative fuels and carbon management.
India is the second-largest fertiliser producer in the world, accounting for ~20 per cent of global production (Fertilizer Association of India 2023). Fertilisers, although essential for improving crop yield (Singh, et al. 2019), are significant source of greenhouse gas emissions due to energy-intensive production processes and extensive fossil fuel use, particularly natural gas. The Indian fertiliser industry contributes ~25 million tonnes of CO2 annually, which is ~1 per cent of India‘s total greenhouse gas emissions of ~3 giga tonnes (GHG platform India n.d.). Decarbonising the fertiliser sector can have two significant benefits: first, it can reduce fossil fuel use, which is essential to achieving net-zero targets. Second, it can result in significant import savings of approximately ~USD 10 billion, since ~60 per cent of the natural gas consumed in this sector is imported (Jain 2022). Therefore, in this study, we aim to provide options for the fertiliser industry to decarbonise and strategically achieve its net-zero targets.
We estimate that the Indian fertiliser sector emits ~0.58 tCO2 per tonne of fertiliser produced. The sector has a total emissions footprint of ~25 million tonnes of CO2 (MtCO2). While 85 per cent of the emission is attributed to the use of natural gas, which is used as a fuel and feedstock in the production process, the remaining 15 per cent is from electricity use. Urea production accounts for about 65 per cent of the total emissions from the sector, and the remaining is from the production of di-ammonium phosphate (DAP) and other complex fertilisers (OCF).
Deploying energy efficiency (EE) measures can reduce the fertiliser industry’s emissions intensity by ∼10 per cent – from 0.58 t-CO2 /t-fertiliser to 0.52 t-CO2 /t-fertiliser (Figure ES1 shows the consolidated emissions mitigation trajectory of the Indian fertiliser industry). Because fertiliser production does not require much electricity, switching to renewable power would result in a mere 2 per cent reduction in emissions. Since ammonia production1 accounts for ∼95 per cent of the emissions in this sector, switching from grey to green ammonia2 can result in a 151 per cent emissions reduction, thus resulting in net negative emissions for the sector. The negative emissions can be attributed to the need to source CO2 from other emitters to produce urea. According to our estimate, the Indian fertiliser sector can consume ∼20 MTPA of green ammonia. As a last resort, carbon management options such as carbon capture and sequestration (CCS), carbon capture and utilisation (CCU), and afforestation may be adopted.
Figure ES1 Emission mitigation pathways for the fertiliser industry
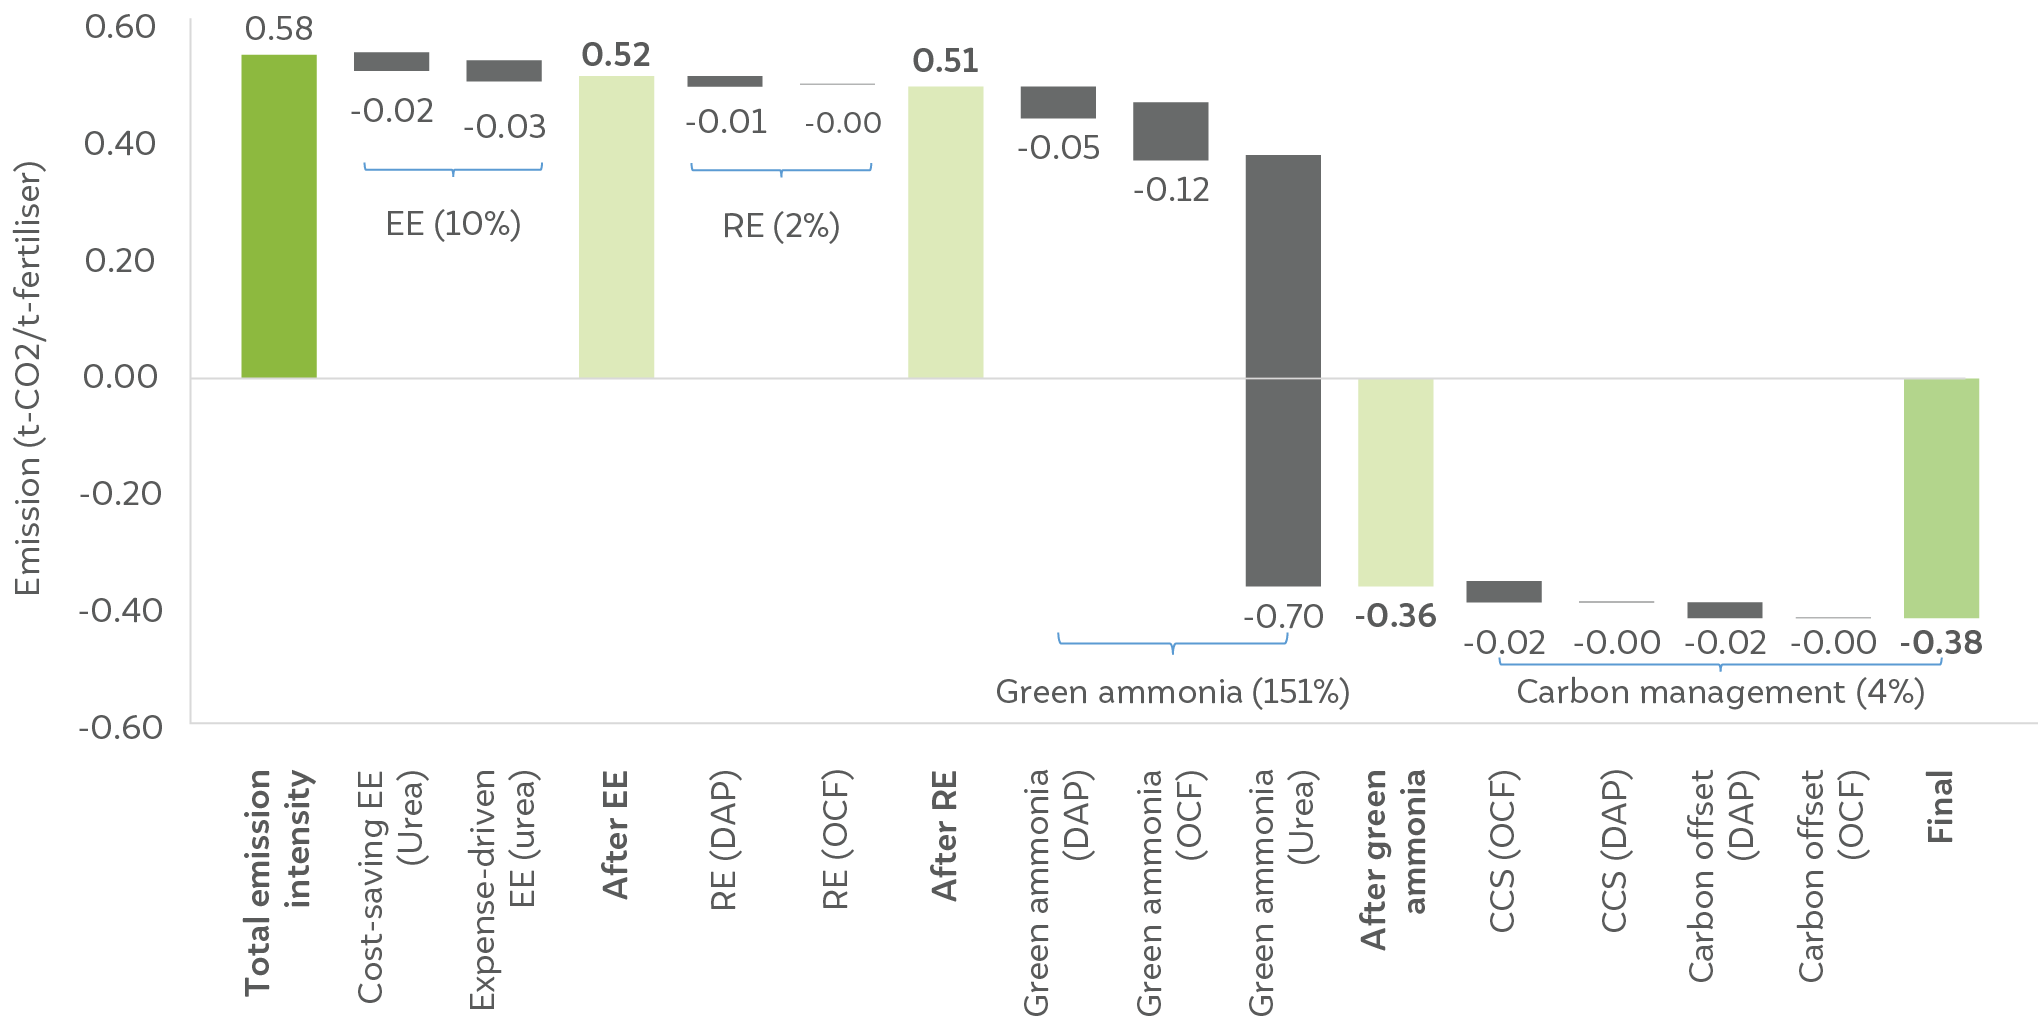
Source: Authors’ analysis
Figure ES2 illustrates the marginal abatement cost (MAC) curve for the fertiliser industry. It shows that cost-saving EE technologies have the lowest mitigation cost of USD -63.5 per tonne. It is also the only cost-saving option in the MAC curve. However, expense-driven EE technologies have a MAC cost of USD 49.6 per tonne. Yet, taken together, EE technologies can help abate ∼2.3 MtCO2. Renewable energy (RE) is the next mitigation option worth considering, with a MAC of ∼USD 42 per tonne, especially for DAP and OCF production. However, since it can abate only 0.4 MtCO2, it is unlikely to play a significant role in decarbonising the fertiliser industry.
With a MAC of ∼USD 160 per tonne for DAP and OCF each and ∼USD 270 per tonne for urea, green ammonia can abate 2 MtCO2 from DAP, 5.1 MtCO2 from OCF, and 30 MtCO2 from urea production. The MAC for the use of green ammonia in urea production is higher than those for DAP and OCF because the urea industry receives subsidised domestic gas priced at USD 7.5 per MMBtu, and we assume that imported natural gas priced at USD 10.1 per MMBtu is used for DAP and OCF production. The total emissions abated by using green ammonia alone in the urea sector stands at 30 MtCO2, which is more than the current level of total emissions from the urea sector, which stands at 16.2 MtCO2 , as urea production needs CO2 , which has to be sourced from other sectors, making the fertiliser industry a net-negative industry.
Figure ES2 Cumulative MAC for the fertiliser sector
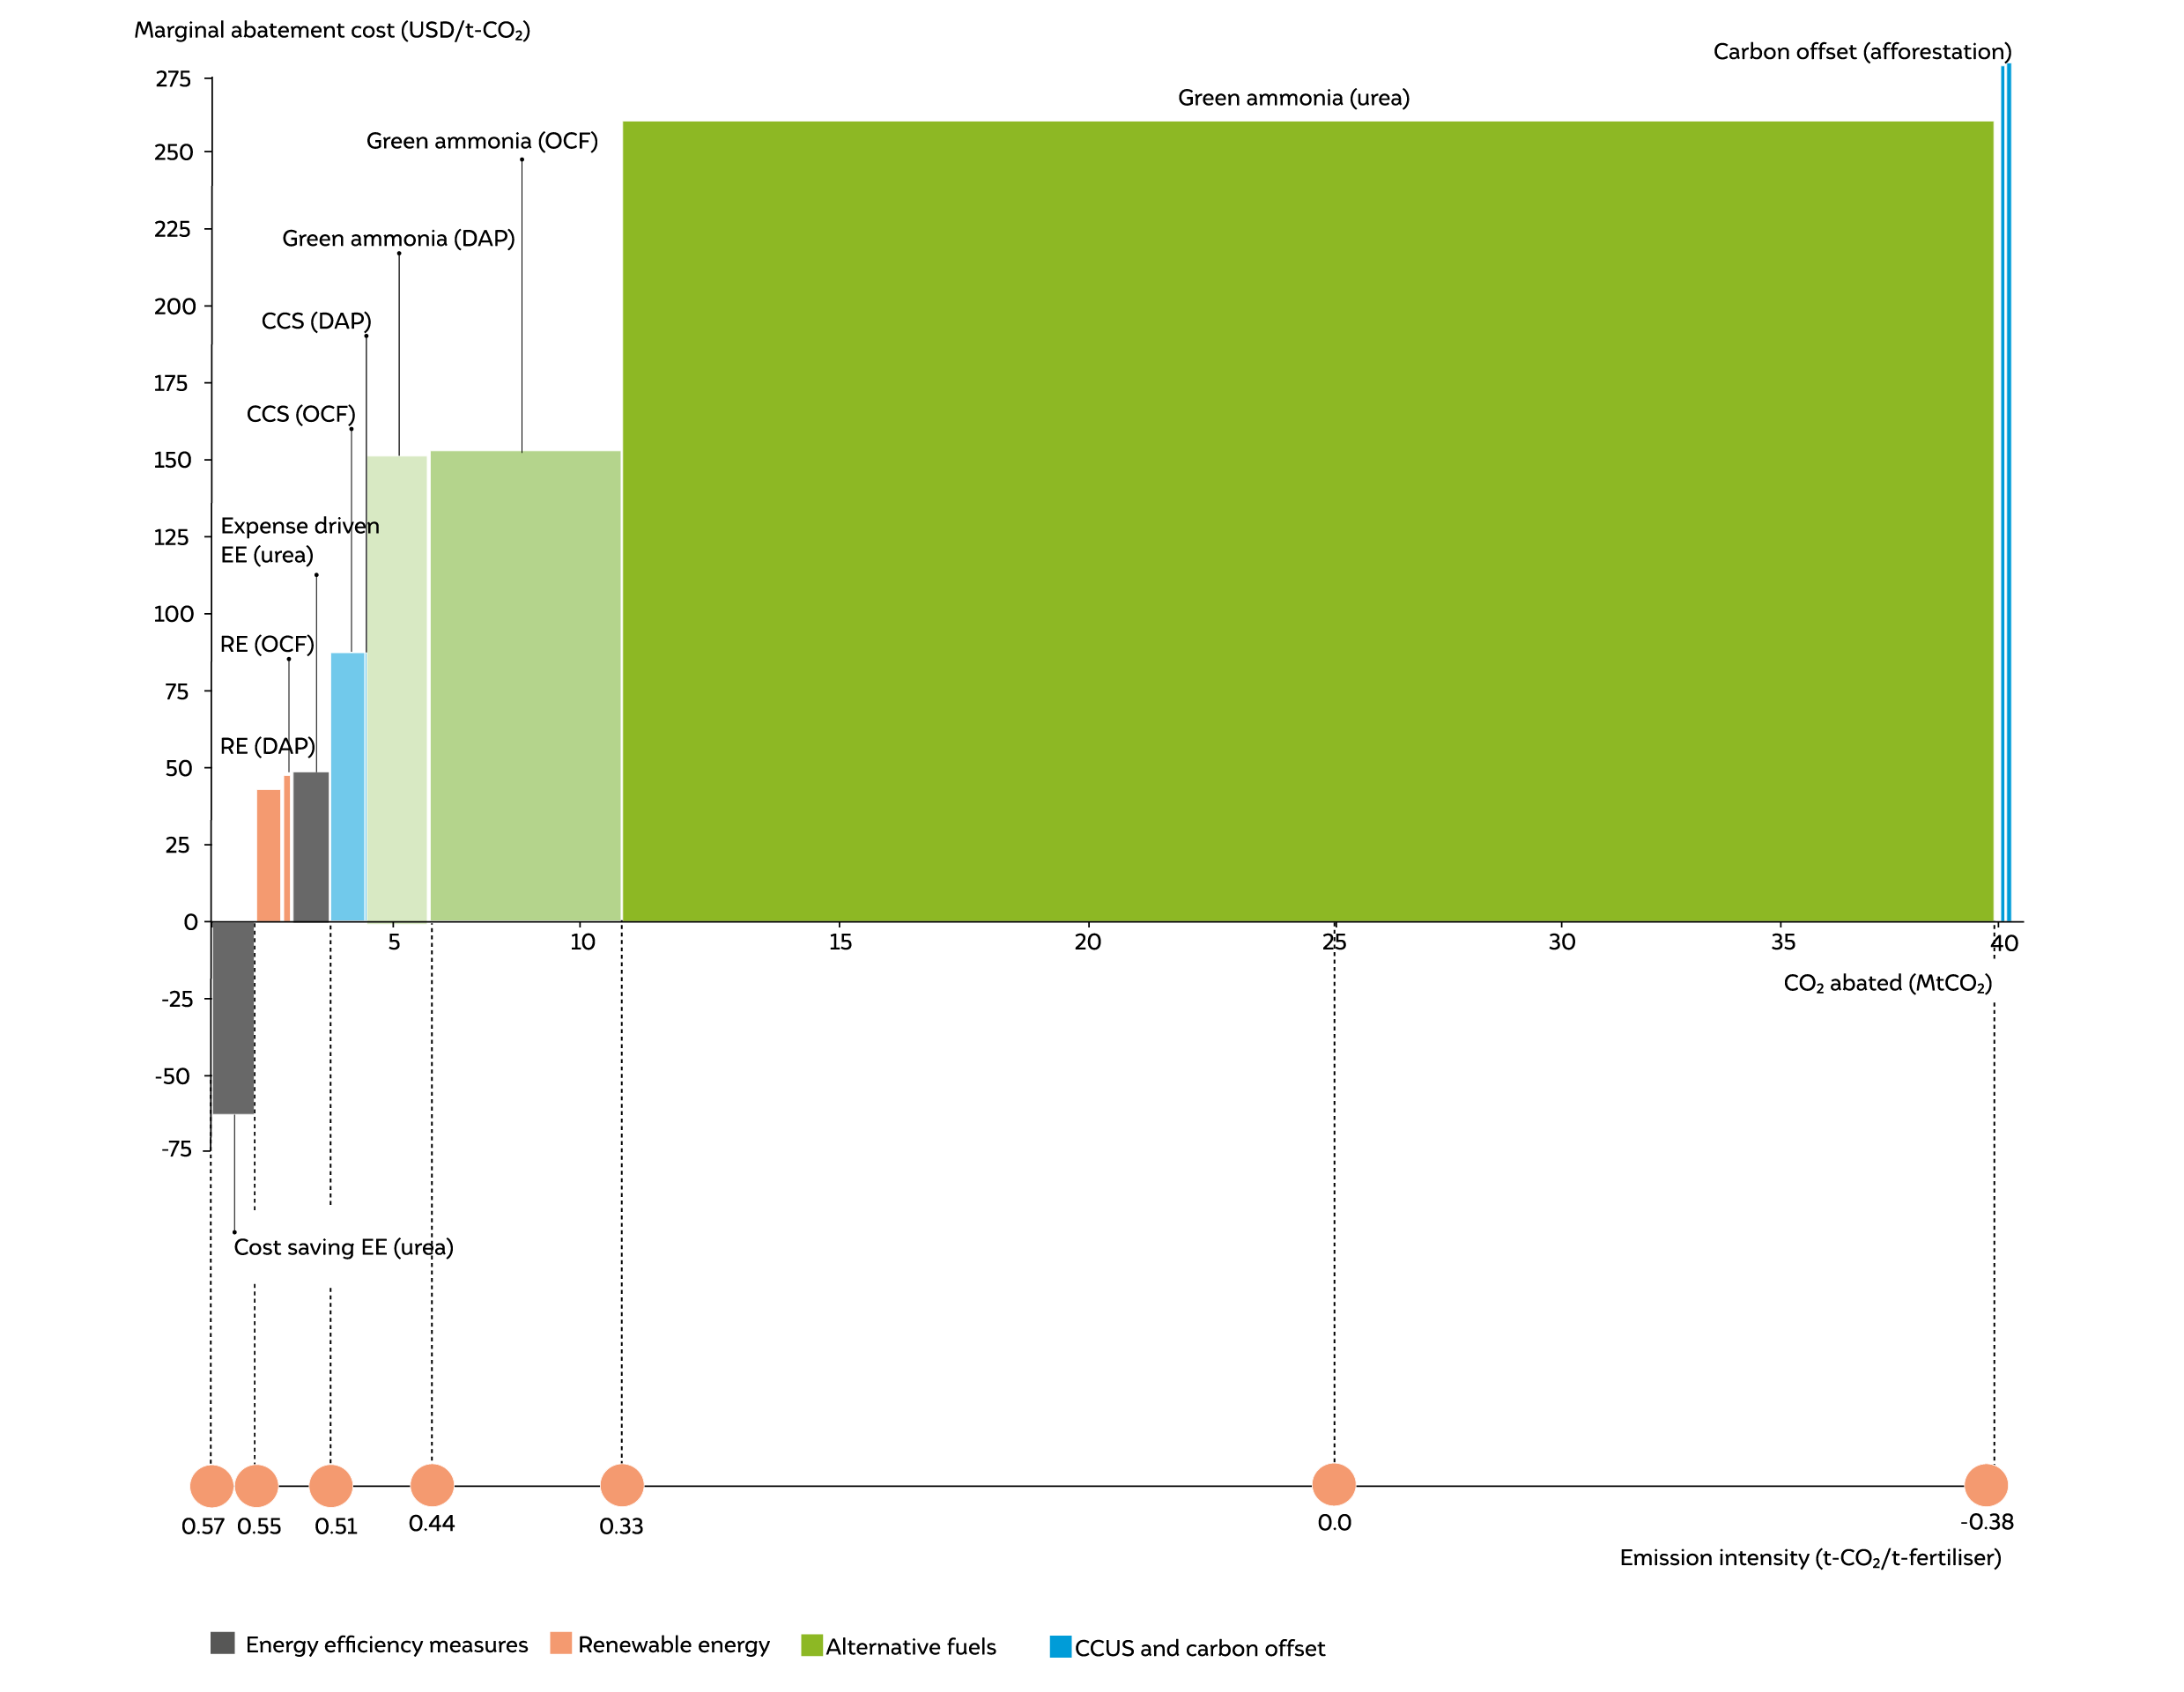
Source: Authors’ analysis
With the implementation of carbon management measures, the MAC of CCS for DAP and OCF is estimated to be USD 90 per tonne, which has very limited potential to abate 0.006 and 0.1 MtCO2 for DAP and OCF, respectively. Urea plants do not need any CCS, as the entire CO2 abatement can happen with EE and green ammonia. It should be noted that while CCS has a lower abatement cost than green ammonia, the MAC curve reflects emissions mitigation through the use of green ammonia primarily because the cost of green ammonia is expected to decrease in the future and support India’s ambitions of becoming Aatma Nirbhar (self-reliance). The MAC curve highlights that in the absence of net-zero fuels and direct RE-based electrification of process heating applications, carbon capture, utilisation, and storage (CCUS) is essential for DAP and OCF decarbonisation, even after using green ammonia. Amongst the techniques considered, carbon offset through afforestation has not been assigned any number due to significant uncertainties in its mitigation costs.
Fertilisers are chemical products added externally to address nutrient deficiencies in the soil by providing nitrogen, phosphorus, and potassium. These external additives are essential for plant growth, enhance crop productivity, and play a vital role in increasing agricultural output, thereby ensuring the nation's food security.
There is substantial demand for fertilisers in India which is estimated to be around 70 million tonnes (MT) for 2022-23.
Fertiliser production accounts for ~0.58 tonnes of CO2 per tonne of fertiliser produced.
Multiple ways exist to make fertiliser production sustainable. The most impactful way is to use green ammonia, which can reduce ~35 M of CO2 from the fertiliser sector.

Evaluating Net-zero for the Indian Aluminium Industry
Assessing Effectiveness of India’s Industrial Emission Monitoring Systems
Evaluating Net-zero for the Indian Cement Industry
Evaluating Net-zero for the Indian Steel Industry
Accelerating the Implementation of India's National Green Hydrogen Mission