Council on Energy, Environment and Water Integrated | International | Independent
Suggested Citation: Nitturu, Kartheek, Pratheek Sripathy, Deepak Yadav, Rishabh Patidar, and Hemant Mallya. 2023. Evaluating Net-zero for the Indian Cement Industry: Marginal Abatement Cost Curves of Carbon Mitigation Technologies. New Delhi: Council on Energy, Environment and Water.
This report analyses carbon abatement measures for achieving net zero in the cement industry and plots a MAC curve for existing plants across the country. The marginal abatement cost (MAC) curve plots the annualised CO2 mitigation cost (USD/tCO2 ) of a given carbon mitigation technology against the total mitigation potential (tCO2) of that technology. The carbon abatement measures investigated can broadly be classified into four categories– Energy efficiency (EE), use of alternative fuels and raw material (AFR), use of renewable energy and alternative fuels such as biomass and municipal solid waste instead of fossil fuels, clinker factor reduction (CF) and carbon management solutions.
India is the second-largest producer of cement in the world. The current emphasis on infrastructure development in the country is expected to drive cement demand further. The Indian cement industry has established itself as one of the frontrunners in driving efficiency measures and setting ambitious net-zero targets. The successful implementation of the Perform, Achieve and Trade (PAT) scheme has played a key role in adopting energy-efficient technologies. However, it is imperative to look beyond energy efficiency to meet India’s climate goals while also catering to the demand.
Read the explainer: What Will It Take for India’s Steel and Cement Industry To Go Net Zero
Read more: Evaluating Net-zero for the Indian Steel Industry
India is the second-largest producer of cement in the world. The current emphasis on infrastructure development in the country is expected to drive cement demand further. The Indian cement industry has established itself as one of the frontrunners in driving efficiency measures and setting ambitious net-zero targets. The successful implementation of the PAT scheme has played a key role in adopting energy-efficient technologies. However, it is imperative to look beyond energy efficiency to meet India’s climate goals.
Cement manufacturing is an emission intensive process. The cumulative CO2 emissions from manufacturing 337 million tonnes of cement in 2018-19 were estimated at 218 million tonnes. Our baseline estimates show that nearly 56 per cent of the total 0.66 tonnes of CO2 per tonne of cement produced is due to the calcination of limestone in the kilns. Most of the remaining emissions, 32 percent is due to the combustion of fuels for process-heating applications, while only 12 per cent is due to the electricity used for manufacturing.
The technological options for decarbonising the cement industry can broadly be classified into four categories.
Carbon management measures are key to achieving a net-zero cement industry
Figure ES1 shows the trajectory for achieving net-zero in the cement industry by deploying the carbon mitigation measures listed prior. To begin, the emissions intensity of cement can be reduced by 9 per cent from 0.66 to 0.60 tonnes of CO2 per tonne of cement by adopting energy-efficient technologies. It can be further reduced to 0.58 tonnes using renewable energy (RE), and then to 0.51 tonnes using alternative fuels such as municipal solid waste (MSW) and biomass. The emissions intensity can further be brought down to 0.44 tonnes of CO2 per tonne of cement by boosting fly ash utilisation to 35 per cent (from 27 per cent) in pozzolana portland cement (PPC), the slag rate to 70 per cent (from 40 per cent) in portland slag cement (PSC), switching to limestone calcined clay cement (LC3) (replacing 10 per cent of ordinary portland cement (OPC) cement sales), and lowering the OPC clinker factor to 0.85 (from 0.90) with additional additives. The remaining emissions can only be mitigated by adopting carbon capture, utilisation, and storage (CCUS) solutions. However, even with a peak capture efficiency of 85 per cent across the CCUS pathway, carbon offset mechanisms such as afforestation must be deployed to achieve net-zero.
Carbon capture, utilisation, and storage have the potential to abate a significant amount of emissions
The marginal abatement cost (MAC) curve in Figure ES2 plots all the decarbonisation measures evaluated in this study and their respective CO2 abatement potential. Between mitigation measures ranging from improving electrical equipment efficiency to reducing the clinker factor in PPC, there are 13 decarbonisation measures that have a negative cost of mitigation. Of these, nine are energy efficiency technologies, one relates to the use of alternative raw materials, and three pertain to the reduction of the clinker factor. Technologies with a negative cost of mitigation can reduce the emissions intensity of cement from 0.66 to 0.53 tonnes of CO2 per tonne of cement. They provide a net financial benefit for the plant implementing it. However, there would be supply chain challenges in reducing the clinker factor in PSC and PPC. The Bureau of Indian Standards has not approved the production of LC3. Several technologies have positive mitigation costs, such as RE, increasing the thermal substitution rate (TSR), further reducing the clinker factor in OPC by using alternative additives, and implementing carbon-management technologies.
Figure ES1 Carbon management will play a significant role in achieving a net-zero cement industry
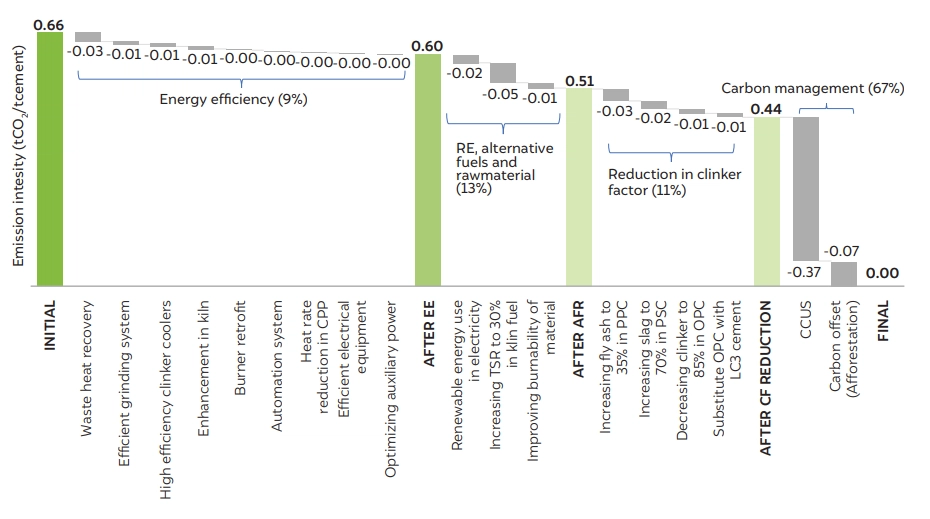
Source: Authors' analysis
The emissions from using fossil fuels for thermal energy account for 32 per cent of the total emissions from cement production. These emissions can be reduced by adopting alternative sources of energy such as biomass and municipal solid waste. However, alternative fuels are more expensive than coal/petcoke, which are currently primarily used in the cement industry. Although alternative fuels can abate 28 million tonnes of CO2, the cost of abatement is approximately USD 42/tCO2 (MSW and biomass).
Figure ES2 Emissions reduction trajectory for the cement industry
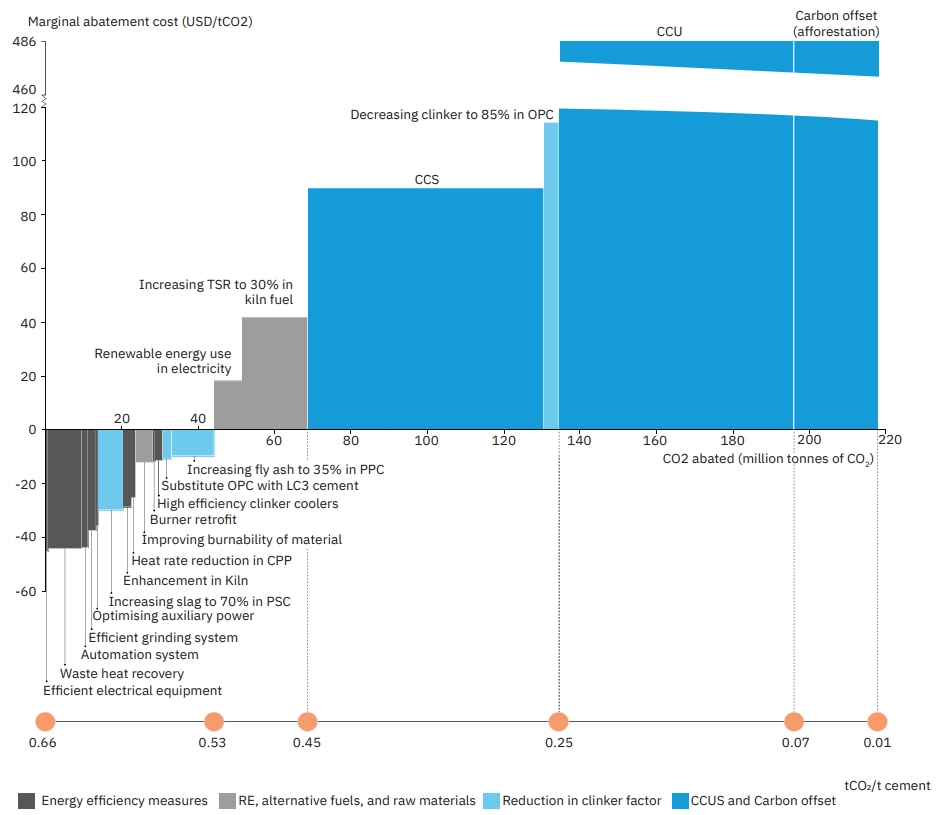
Source: Authors' analysis
Note: The MAC for afforestation is only representational as an option for carbon mitigation without getting into the cost of mitigation.
Captive or grid electricity, which constitutes approximately 12 per cent of the total emissions from the cement industry, can be replaced with electricity sourced from wind and solar power plants. We estimate that for producing 337 million tonnes per annum (MTPA) of cement, 1.3 GW of round-the-clock (RTC) RE capacity will be required. In this study, we have considered only a 40 per cent replacement of electricity demand by RTC RE. This is because a 50 per cent reduction in power demand can be achieved by adopting energy efficiency measures, including waste heat recovery units. The remaining 50 per cent can be replaced by RTC RE. Though recent RTC RE tenders have an annual availability of 80 per cent (Thacker et al. 2020) and more, the cost of power increases significantly due to RE oversizing and the use of batteries. It is assumed that the remaining power will be drawn from the grid. We have considered the corresponding emissions intensity of grid power in our analysis.
Approximately 56 per cent of the emissions typically come from process emissions during clinker making. Since CO2 is released through a chemical reaction (calcination), it cannot be eliminated by alternative fuels or adopting energy efficiency measures. The cost of mitigation from the CCUS pathway is significantly higher than adopting alternative fuels or moving to RTC RE. Right-of-way impedes scaling up the CO2 transportation infrastructure, which is necessary for scaling up the carbon capture and storage (CCS) pathway in India. Our assessment shows that about 50 per cent of cement plants in India need access to natural gas pipelines. Therefore, as of today, these cement plants cannot opt for CCS, assuming that these pipelines or new ones utilising the same right-of-way will carry CO2 to the storage sites. Therefore, we assume that these cement units use the carbon capture and utilisation (CCU) pathway to achieve net-zero emissions. While there are multiple pathways and processes for CCU, the study considers CO2-to-methanol production to be a CCU application. This is because of the multiple use applications that green methanol provides, such as fuel for blending in gasoline, the petrochemical industry, the building block for sustainable aviation fuel (SAF) and producing green olefins. However, CCU has the highest cost of mitigation primarily due to the high cost of green hydrogen today (assumed to be USD 4.2/kg).
The transition to net-zero cement will significantly increase the cost of the final commodity to the consumer. This can be attributed to a CAPEX of INR 25 lakh crore and an annual OPEX of INR 29,580 crore required to achieve net zero in the cement industry. Figure ES3 shows the variation in cement price due to various decarbonisation measures across different emission intensities. The analysis indicates that with the adoption of decarbonisation measures having a negative cost of mitigation, the cost of cement reduces by 3 per cent while also ensuring a 20 per cent decrease in emissions intensity. Further, with the use of measures that have a positive cost of mitigation, a breakeven can be achieved with the current cost by reducing the emissions intensity by 32 per cent. However, with the use of expensive decarbonisation options such as CCS and CCU at USD 90 and USD 486 per tonne of CO2, respectively, there is a 107 per cent increase in the cost of cement to the consumer. This increase in cost can be reduced to 34 per cent if all cement plants have access to CCS infrastructure. Further, if the cost of CCS reduces to USD 50 per tonne of CO2, then the cost of net-zero cement is expected to be only 19 per cent higher than the current costs.
Figure ES3 Emissions intensity of cement can be reduced by 32% without increasing the cost of cement
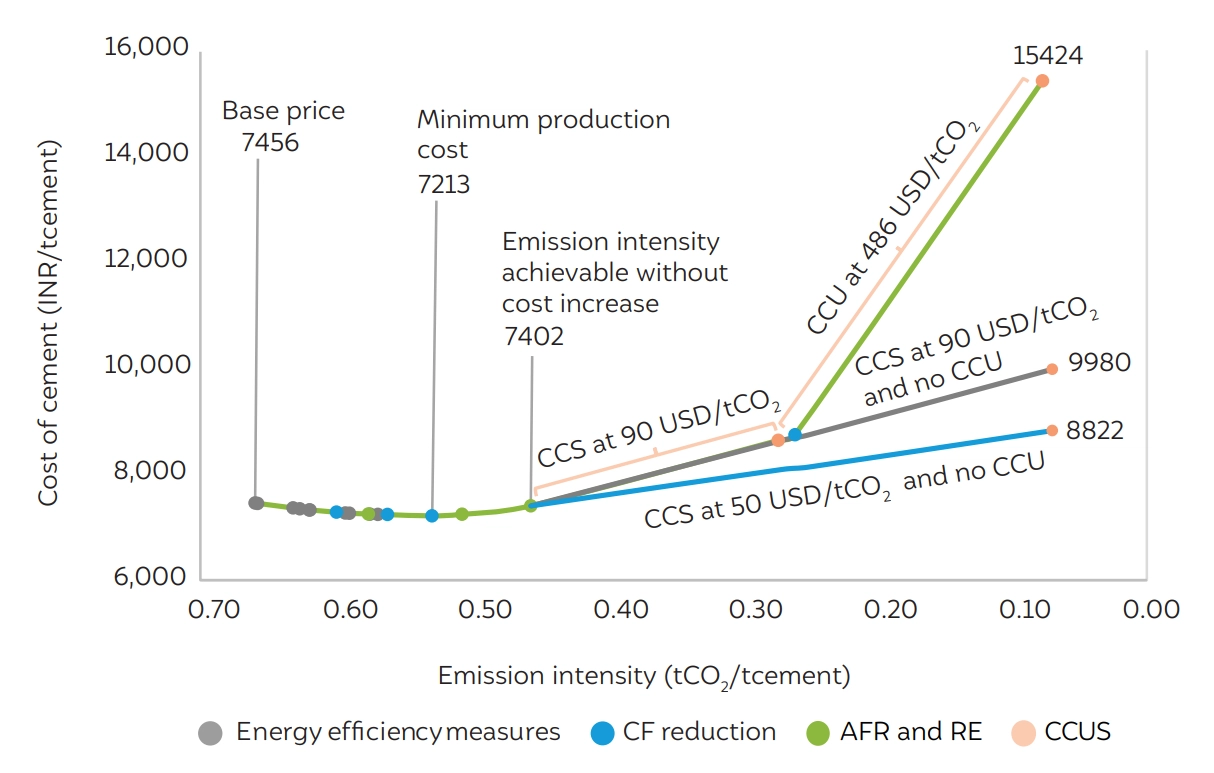
Source: Authors' analysis
To summarise, we recommend the following measures to achieve net-zero in the cement industry.
Cement is an essential binding material used in concrete for construction purposes.
Mixing different proportions of clinker with different additives such as gypsum, fly ash, limestone, and slag, various types of cement with different properties are produced. The ratio of clinker to additives is referred to as the clinker factor. Broadly, cement can be categorised as Pozzolana Portland Cement (PPC), Ordinary Portland Cement (OPC), and Portland Slag Cement (PSC). Approximately 60 per cent of the cement sold in India is the PPC type, while OPC and PSC make up 31 and 8 per cent of sales, respectively.
Our baseline estimates show that the carbon footprint of cement manufacturing in India is about 0.66 tCO₂/t cement. The cumulative CO₂ emissions from manufacturing 337 million tonnes of cement in 2018–19 were estimated at 218 million tonnes.
Decarbonising the cement industry is particularly hard since nearly 56 per cent of the total 0.66 tCO₂/t cement produced is due to the calcination of limestone in the kilns. This share of emissions termed as ‘process emission’ can only be abated by increasing the efficiency of its usage or by finding material alternatives that do not alter the property of the cement.
According to our analysis, nearly 67 per cent of the emissions from the cement sector can be abated only by using carbon management techniques like CCUS and carbon offsets. Adopting energy efficiency measures across the cement manufacturing process chain can reduce emissions by 9 per cent, and another 13 per cent can be reduced using renewable energy (RE) and alternative fuels such as municipal solid waste (MSW) and biomass. The remaining 11 per cent of the emissions can be brought down by boosting fly ash utilisation to 35 per cent (from 27 per cent) in Pozzolana Portland cement (PPC), the slag rate to 70 per cent (from 40 per cent) in Portland slag cement (PSC), switching to limestone calcined clay cement (LC3) (replacing 10 per cent of ordinary portland cement (OPC) cement sales), and lowering the OPC clinker factor to 0.85 (from 0.90) with additional additives. However, as mentioned in the study, adopting energy efficiency will be the low-hanging fruit in decarbonising the cement sector.
Can white hydrogen accelerate India’s energy transition?
How Secure is India’s Energy Future?
Unlocking the Potential for a Gas-Based Economy in India
Advancing India’s Green Steel Transition
CO₂ Pipeline Network for Carbon Capture and Storage in India