Council on Energy, Environment and Water Integrated | International | Independent
Suggested Citation: Sripathy, Pratheek, Kartheek Nitturu, Deepak Yadav, and Hemant Mallya. 2024. Evaluating Net-zeroTrajectories for the Indian Aluminium Industries: Marginal Abatement Cost Curves of CarbonMitigation Technologies. New Delhi: Council on Energy, Environment and Water.
This report evaluates emission mitigation options to achieve net-zero carbon emissions through marginal abatement cost (MAC) curves for the existing plants in the aluminium industry. In terms of overall metal consumption, aluminium ranks second, next only to steel. However, India’s per capita aluminium consumption is low, at 2.5 kilograms (kg), compared to the world average of 11 kg, and has potential for growth. Data was collected at various levels – state and country – along with some overarching assumptions, such as the uniform energy consumption across all aluminium plants in the country, and key inputs obtained from literature and conversations with industry experts.
The installed capacity and production of aluminium for the year 2019–20 were 4.1 million tonnes per annum (MTPA) and 3.6 MTPA, respectively, with cumulative emissions of 77 million tonnes of CO2 (MtCO2). Electricity consumption accounted for 80 per cent of the total, while process emissions and fuel consumption accounted for the rest. Given the highly energy-intensive production process and the expected growth in demand, decarbonising the energy supply, particularly in the smelting process, will have a substantial impact on India’s cumulative industrial emissions.
In terms of overall metal consumption, aluminium ranks second, next only to steel (NITI 2017). However, India’s per capita aluminium consumption is low, at 2.5 kg, compared to the world average of 11 kg (NITI 2017), and has potential for growth. The installed capacity and production of aluminium for the year 2019–20 were 4.1 million tonnes per annum (MTPA) and 3.6 MTPA, respectively (IBM 2022). Given the highly energyintensive production process and the expected growth in demand, decarbonising the energy supply, particularly in the smelting process, will have a substantial impact on India’s cumulative industrial emissions. Our study aims to provide various decarbonising options to the aluminium industry that can help it strategically achieve net-zero targets.
As per our estimates, the total baseline emissions in the production of aluminium in India is 20.88 tonnes of CO2 (tCO2 ) per tonne of aluminium. This includes the emissions due to direct fuel use, emissions associated with the electricity consumed in the process, and the emissions generated due to the nature of the process itself, also termed ‘process emissions’. The industry emitted nearly 77 million tonnes of CO2 (MtCO2 ) in the year 2019–20, and electricity consumption accounted for 80 per cent of the total, while process emissions and fuel consumption accounted for the rest. Our study considers only scope 1 and 2 emissions, and all interventions analysed are limited to the plant boundary.
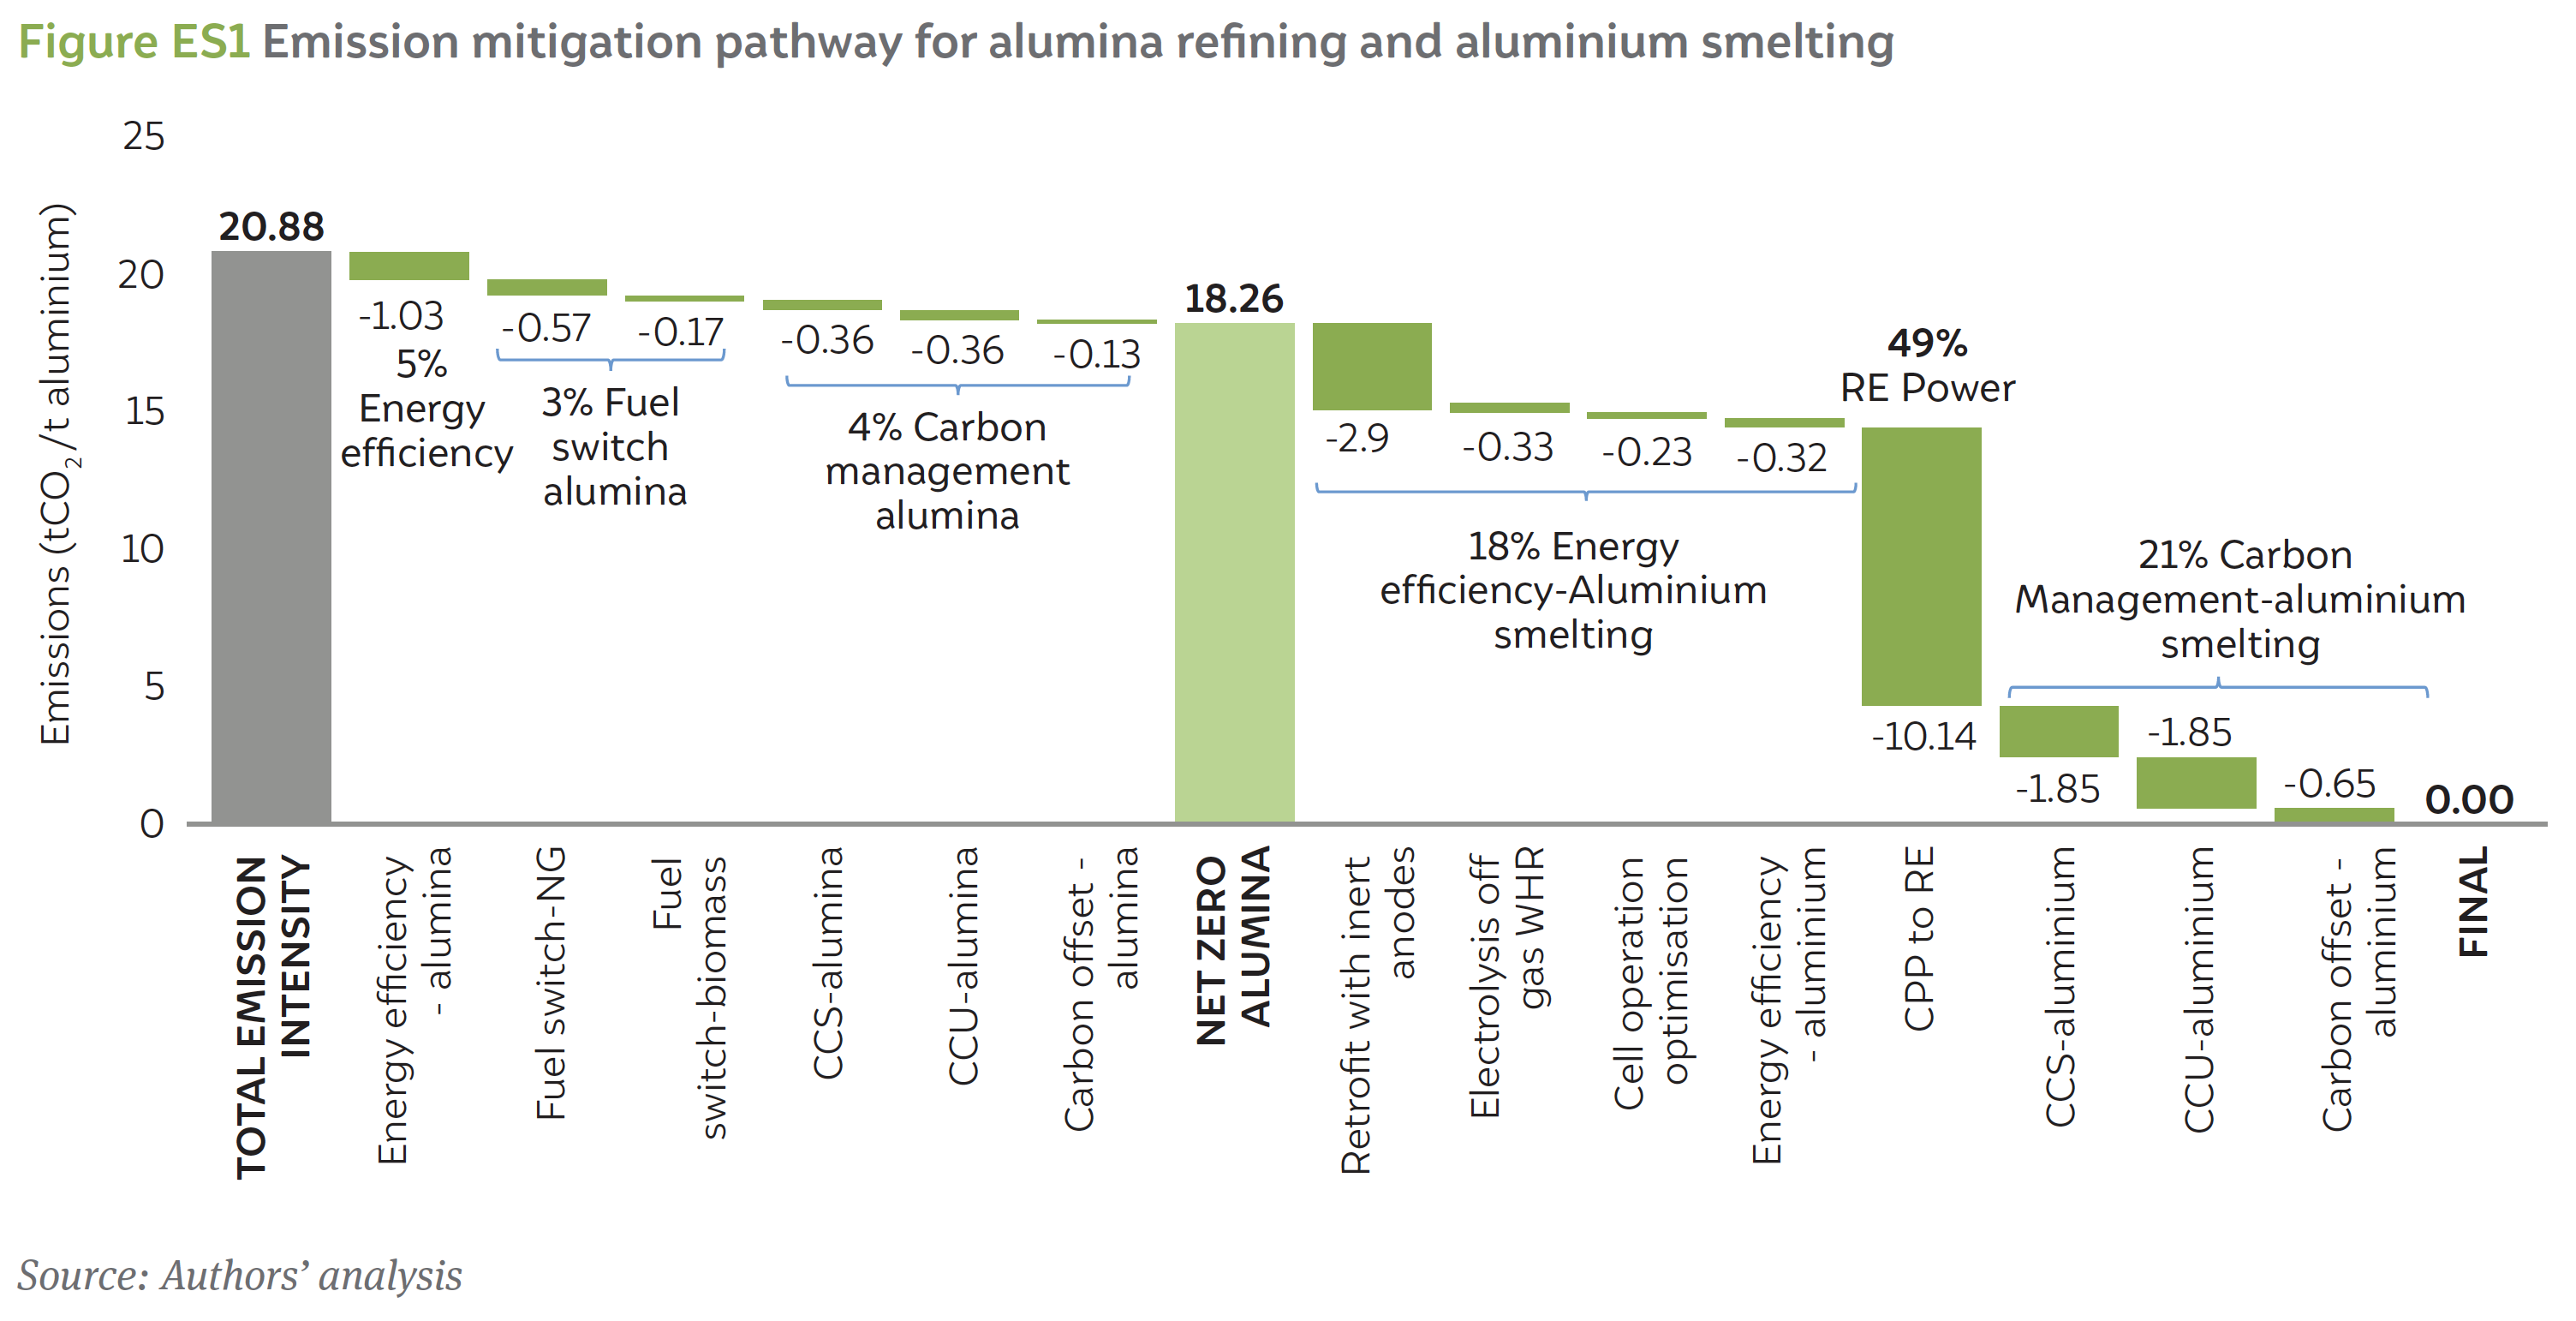
Our study shows that the use of power sourced from renewable energy (RE) abates 49 per cent of emissions, corresponding to 38 MtCO2 of total emissions from the industry. Since aluminium production requires large amounts of reliable supply of electricity, it is unlikely that the entire electricity demand can be met through RE, and we, therefore, consider that 30 per cent of the demand would still be supplied by the captive power plant (CPP). Consequently, the emissions due to coal combustion need to be mitigated through carbon management, which would contribute to 21 per cent of the total emissions abatement. In addition, a large number of alumina refineries lie in close proximity to natural gas (NG) pipelines, and therefore, a large proportion of their thermal energy needs are met by NG. The emissions from NG combustion are also abated through carbon capture, utilisation, and storage (CCUS). Similar to the decarbonisation trajectory of the cement and steel industries (Elango et al. 2023; Nitturu et al. 2023), energy efficiency expected to play a significant role, while fuel switching will play a limited role in aluminium decarbonisation. This is summarised in Figure ES1.
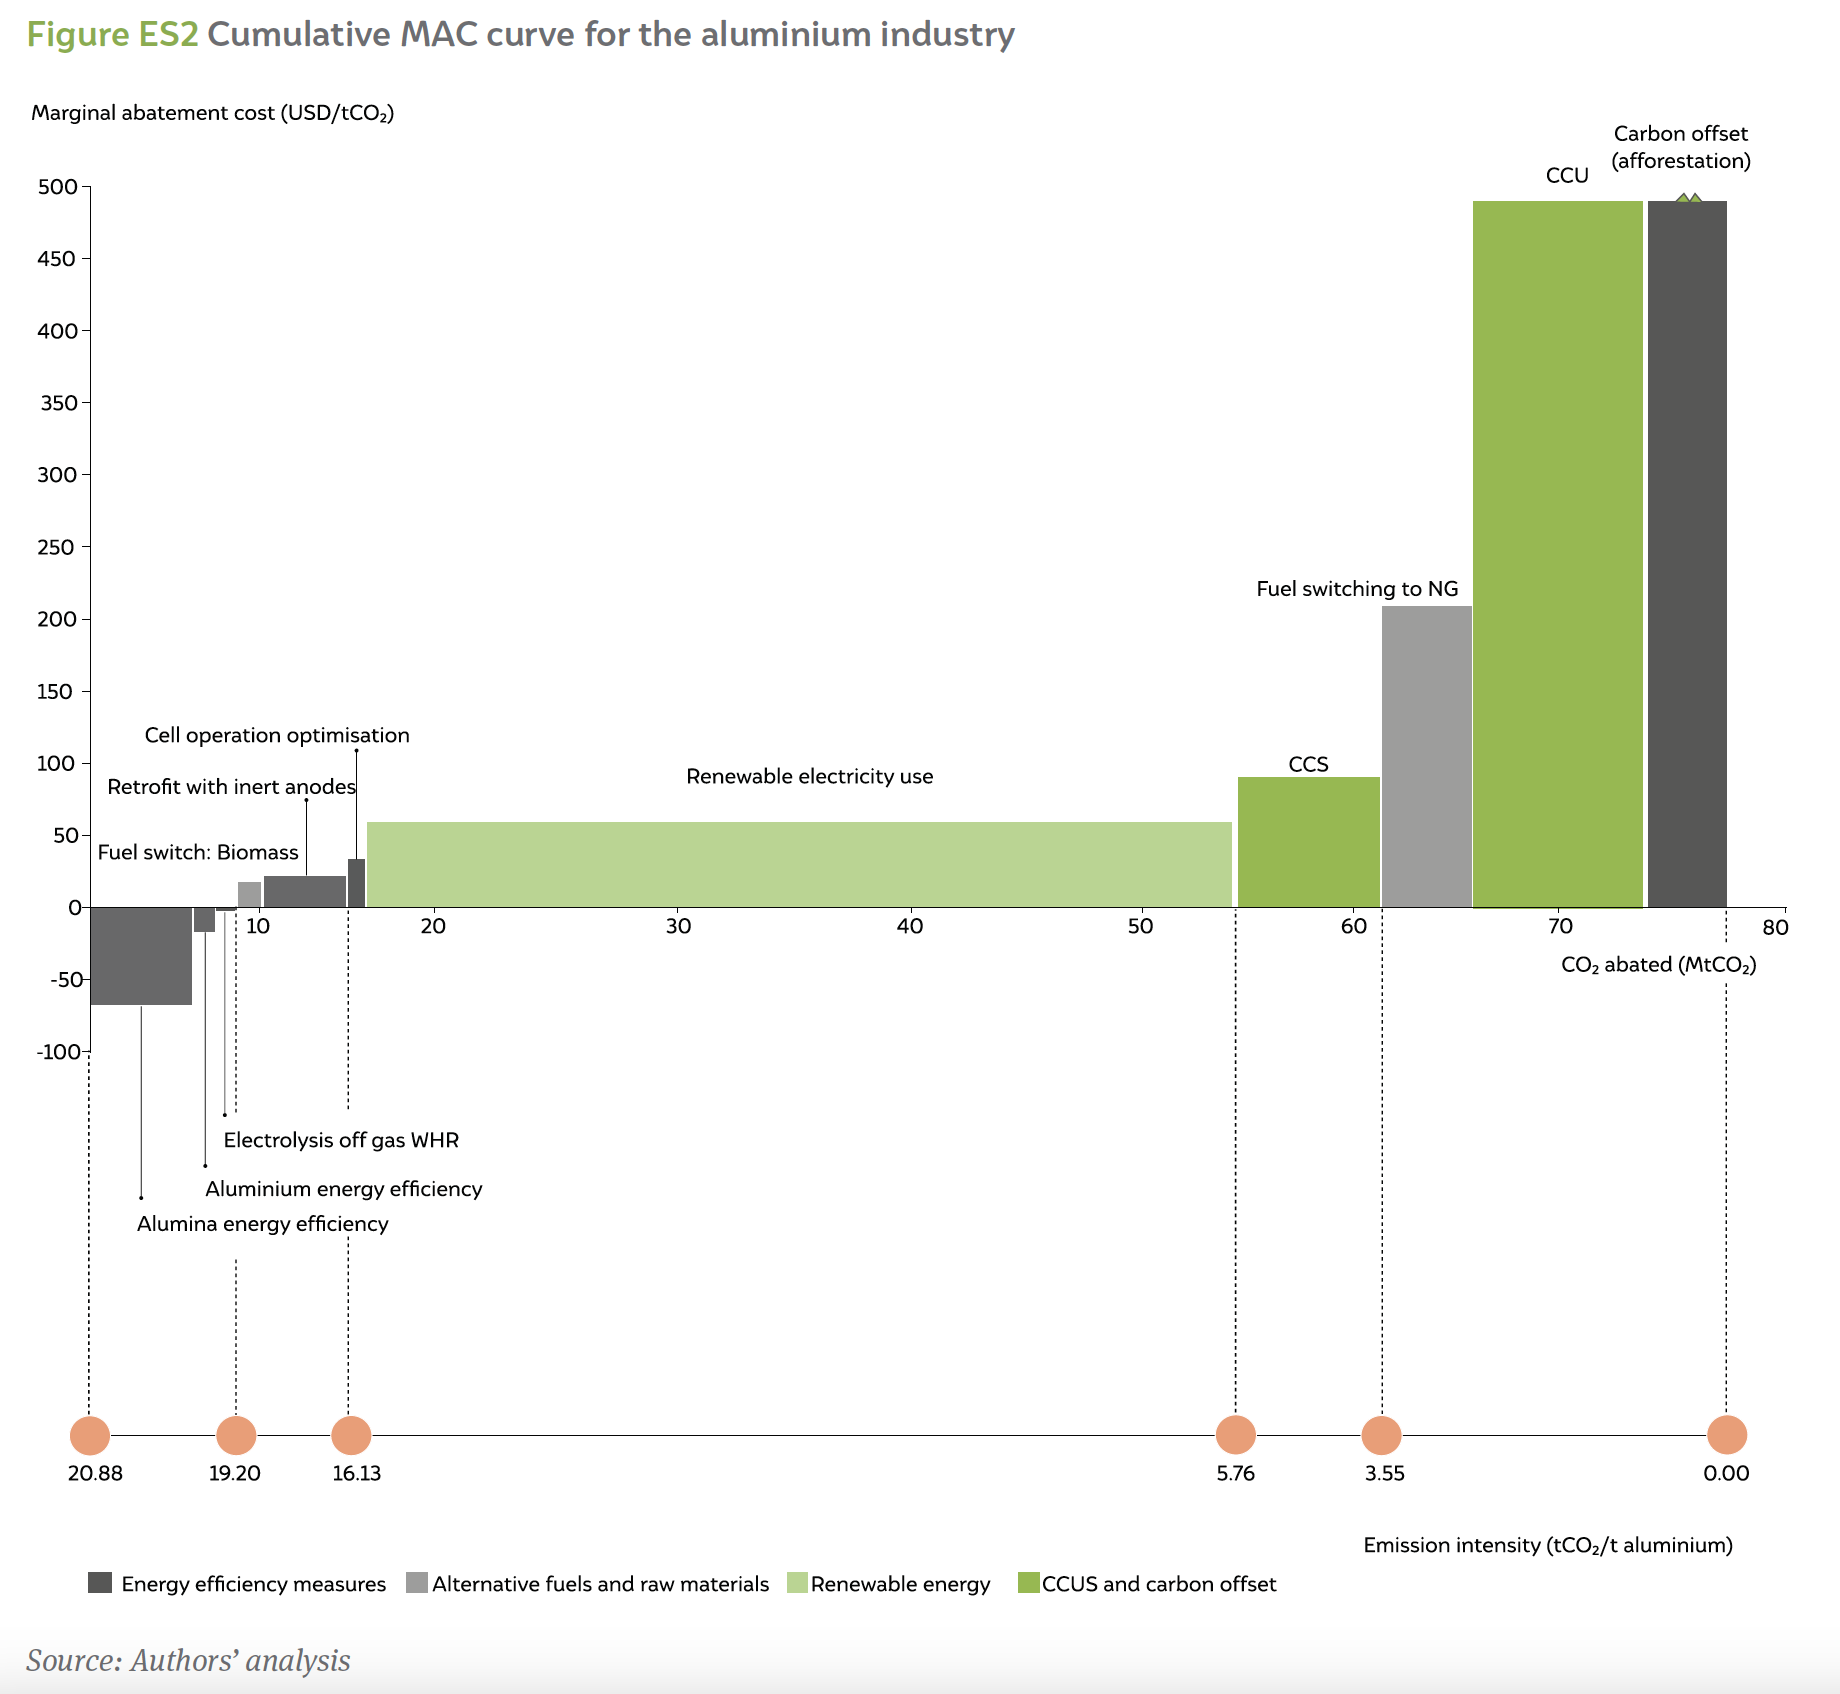
The marginal abatement cost curve for the aluminium industry is shown in Figure ES2. It can be seen that energy efficiency in alumina refining and aluminium smelting and waste heat recovery (WHR) through electrolysis off-gas are the most impactful, with negative marginal abatement costs (MACs). However, these technologies represent only 8 per cent of the total emission that needs to be abated. All the remaining carbon abatement measures have a positive MAC, meaning that there is a net cost incurred for facilities deploying these measures. The shift from coal-based CPPs to renewable power has the highest potential for carbon mitigation – at 38 MtCO2 – but also involves substantial costs.
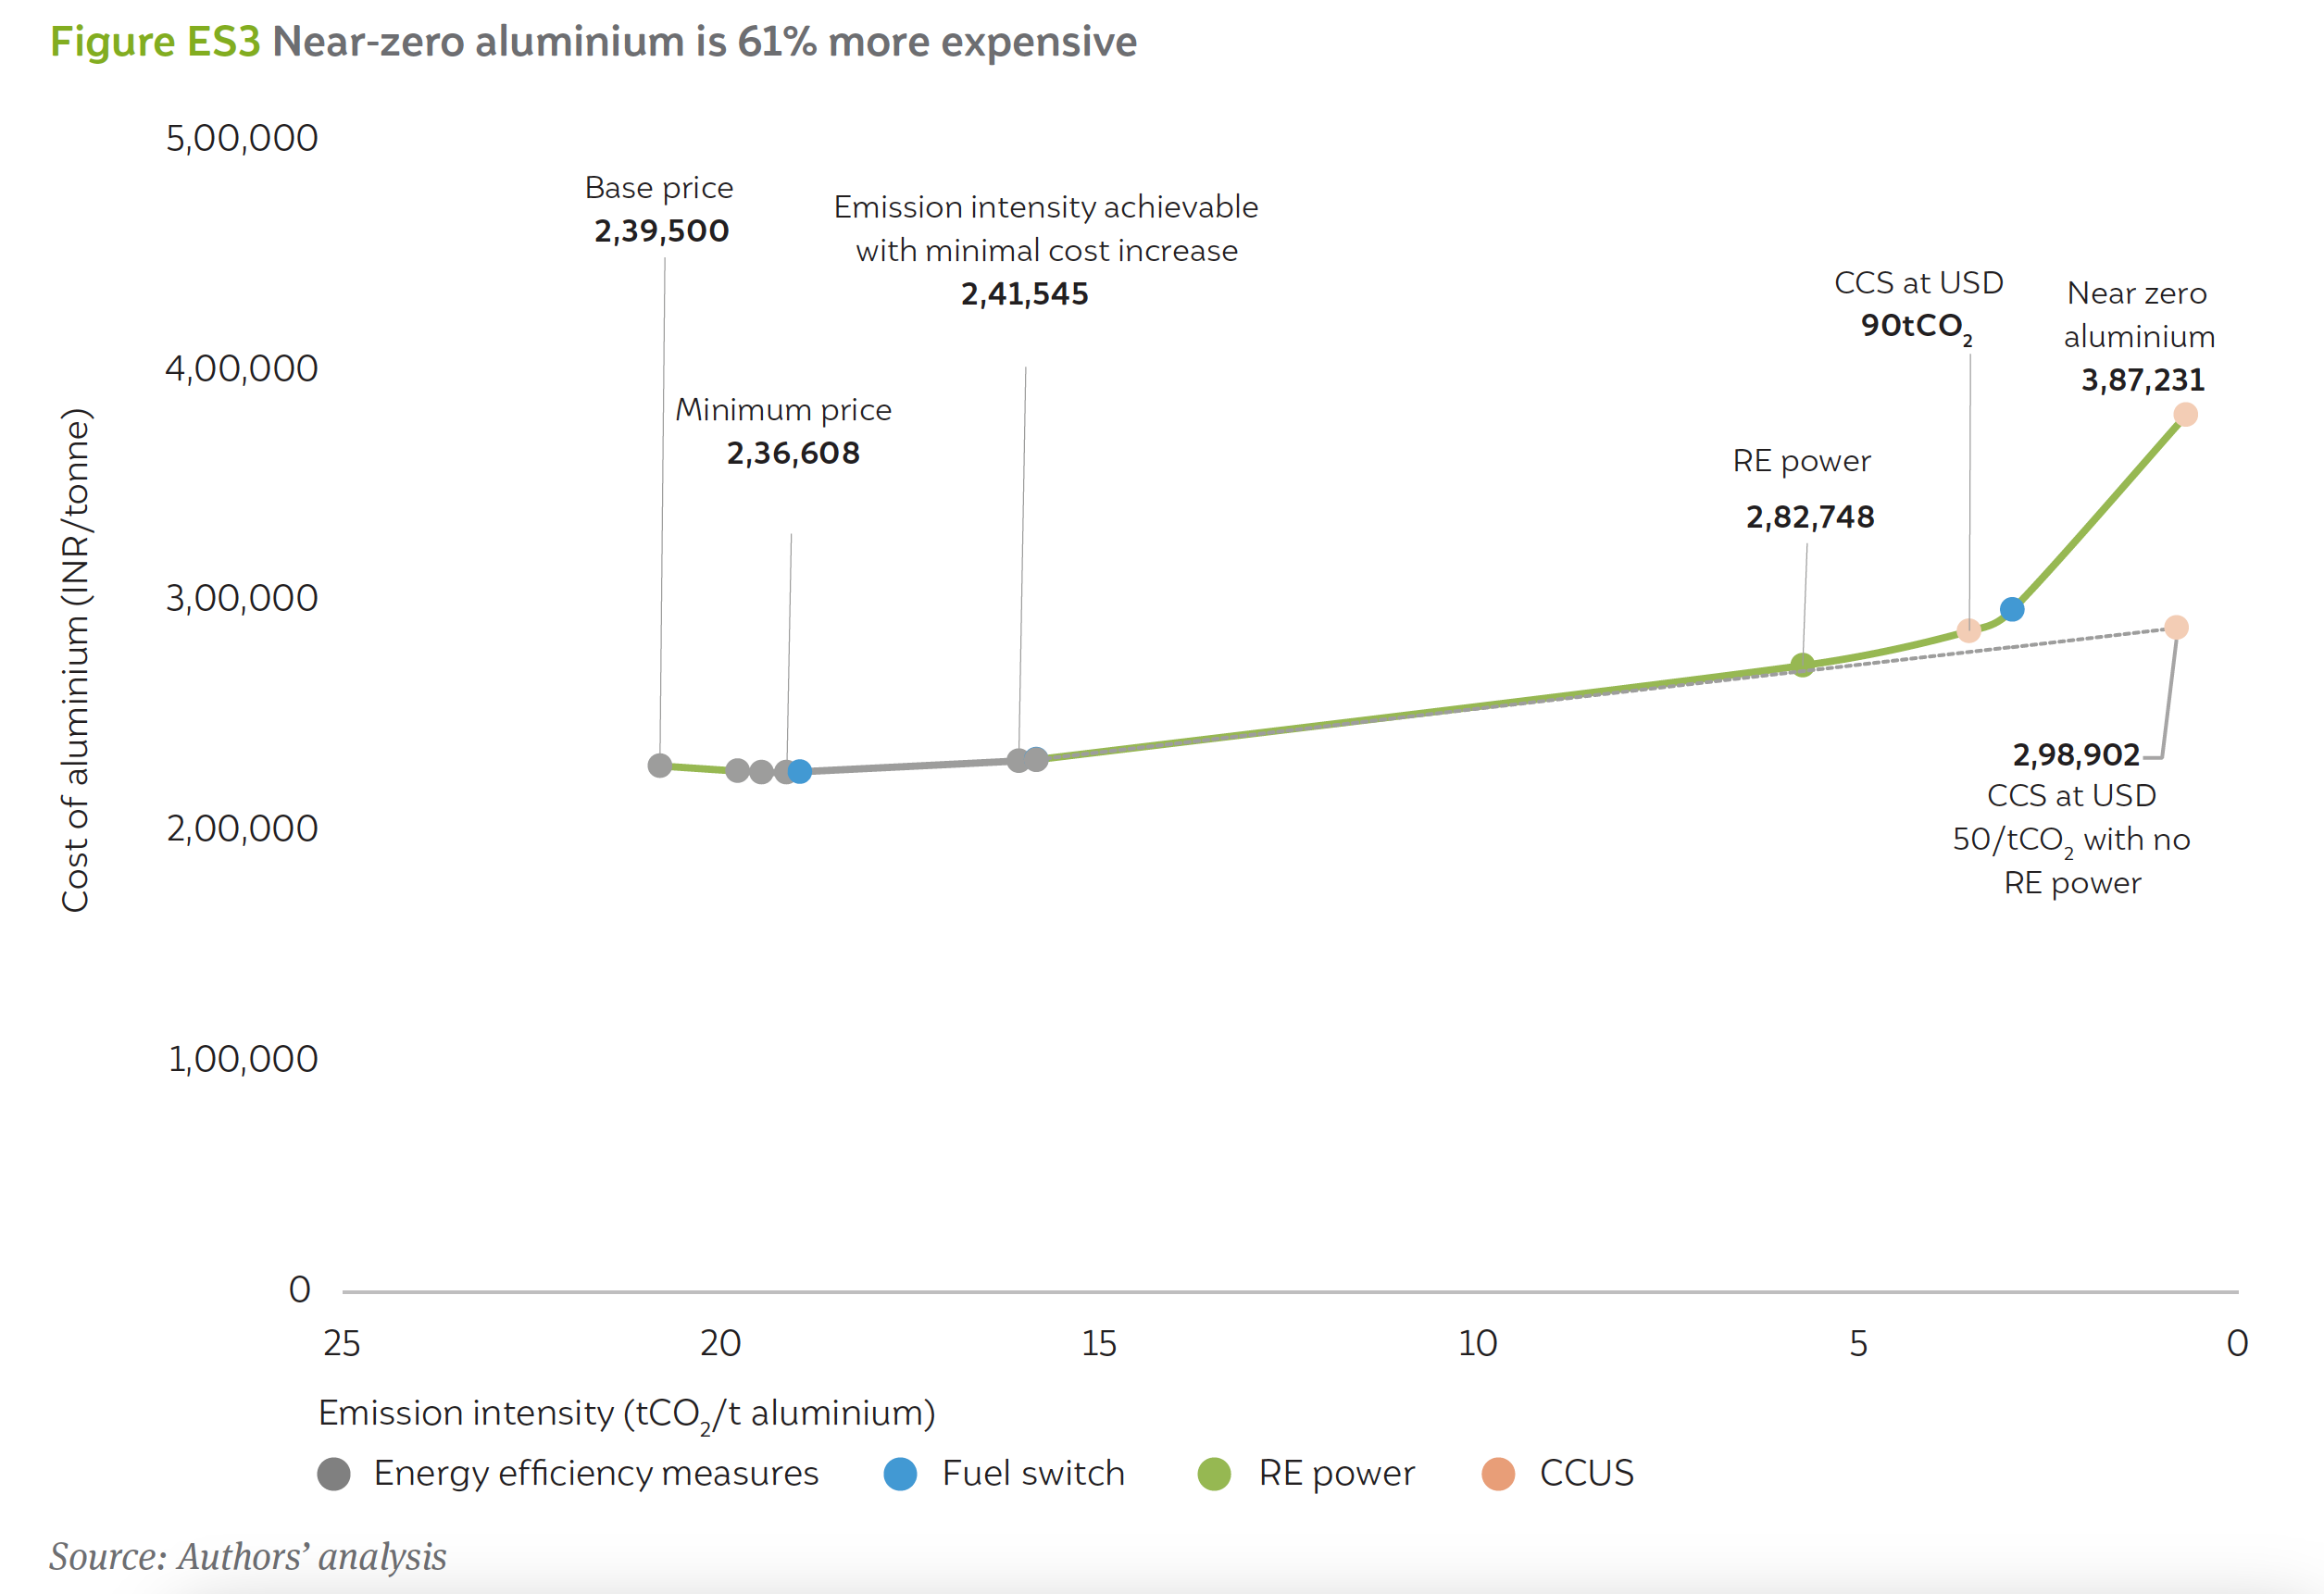
The adoption of carbon mitigation technologies directly affects the cost of producing aluminium due to the requirement of additional capital expenditure (CAPEX) and operating expenditure (OPEX). In a net zero scenario, the industry would require a CAPEX of INR 2,18,241 lakh crore (USD 29 billion), and there would be a yearly increase in OPEX by 26,049 crore (USD 3.5 billion). Consequently, net-zero aluminium is 61 per cent more expensive. Figure ES3 shows the price increase trajectory for net-zero aluminium. According to our analysis, net-zero aluminium is nearly 61 per cent more expensive than conventional aluminium. However, a 1.2 per cent decrease in production costs can be achieved by adopting alumina EE, aluminium EE and electrolysis off-gas WHR. An emission intensity of 16.13 tCO2 per tonne (23 per cent reduction) can be achieved by further using alternative fuels like biomass in alumina refining and retrofitting with inert anodes in aluminium smelting resulting in a cost increase of less than one per cent. However, for further decarbonisation, adopting RE power would result in a cost increase of 18 per cent and net zero aluminium would cost 61 per cent more than the base price. Alternatively, in a scenario where the switch to RE power does not happen and CCS is available at USD 50 per tCO2 , then net-zero aluminium would cost 21 per cent higher than the base price (represented as a dotted line).
Aluminium is one of the most abundantly used metals, and in the non-ferrous-metals sector, it is the fastestgrowing in terms of production. It ranks second, next only to steel, in terms of volumes used due to its unique properties (NITI 2017). India’s per capita aluminium consumption is low, at 2.5 kg, compared to the world average of 11 kg (NITI 2017). According to some estimates, the embodied energy for aluminium is around 211 GJ per tonne, compared to 22.7 GJ per tonne for steel (Bureau of Energy Efficiency (BEE–GIZ 2018). However, since aluminium is much lighter than steel, the energy savings achieved during the lifetime of its end use are roughly three times higher, especially as it can replace steel in sectors such as mobility and transport (BEE–GIZ 2018). The installed capacity and production of aluminium in India for the year 2019–20 were 4.1 MTPA and 3.6 MTPA, respectively (IBM 2020). Currently, the aluminium industry in India accounts for nearly 9 per cent of total industrial emissions (GHG Platform India n.d.). Given the highly energy-intensive production process and the expected growth in demand, decarbonising the energy supply, particularly during the smelting process, will have a significant impact on India’s cumulative industrial emissions and help achieve our climate goals, as stated at COP26.
The aluminium production process broadly consists of three steps. First, the raw material (bauxite) is mined, and this is followed by refining the bauxite ore to produce alumina. Finally, alumina is converted into molten aluminium, using the process shown in Figure 1. The extraction of alumina from bauxite occurs through a multi-step process called the Bayer process, wherein ground bauxite ore is digested in the presence of caustic soda. The mixture obtained (termed ‘green liquor’) is heated and results in the crystallisation of amorphous alumina. This method is particularly advantageous since it is capable of handling various grades of bauxite and can produce a wide variety of alumina. Alumina is then dissolved in a compound consisting of sodium, aluminium, and fluorine, which then undergoes electrolysis. This process is called the Hall–Héroult process, and the resulting product is molten aluminium (Staley, Bridenbaugh, and Van Horn 2018).
The Indian aluminium industry contributes to roughly 3 per cent of the global aluminium capacity. Traditionally, the power sector is the largest consumer of aluminium. A bulk of aluminium usage in India is in overhead conductors and power cables used in the transmission and distribution of electricity. India has an installed capacity to produce 4.1 MTPA of aluminium and 8.1 MTPA of alumina. In the financial year 2019–20, 3.6 MTPA of aluminium and 6.4 MTPA of alumina were produced in the country.
Figure 1 A typical aluminium production process

Source: Authors’ compilation
Figure 2 The supply chain for aluminium production is concentrated in the eastern part of the country.

Source: Authors’ compilation
As can be seen in Figure 2, a significant number of alumina refining and aluminium smelting facilities are concentrated in the eastern part of the country due to the proximity of mines that produce crucial raw materials such as bauxite and coal. A majority of the alumina and aluminium production facilities are located in Odisha (77 and 67 per cent, respectively).
Energy consumed during the aluminium manufacturing process is of two types: thermal and electrical energy. We assume for the purposes of this study (as shown in Figure 3) that only thermal energy is consumed in the alumina refining process, since electrical energy is typically used for the movement of materials in the facility and is negligible in comparison to the overall thermal energy consumption. For alumina refining, the Indian average is 14 GJ per tonne of alumina, whereas the global best is 8 GJ per tonne of alumina. In contrast, the average electricity consumption in India and the global achievable best are relatively similar. The average electricity consumption in India is 14,361 kWh per tonne of aluminium, whereas the global best is 13,599 kWh per tonne of aluminium (BEE–GIZ 2018). The thermal energy consumption for aluminium production is assumed to be unchanged in both the baseline and global bestcase scenarios since electricity consumption is more predominant in aluminium smelting while thermal energy is used only for anode making. Consequently, there is limited literature available on it.
Figure 3 Electricity emissions contribute significantly to the overall emissions.

Source: Authors’ compilation

Source: Authors’ analysis
In order to quantify the potential reduction in emissions, a baseline needs to be established. The baseline emissions estimation constitutes the emissions due to direct fuel use, emissions associated with the electricity consumed in the process, and the emissions generated due to the nature of the process itself, termed ‘process emissions’. The year 2019–20 was chosen as the base year to estimate emissions. This year was chosen to negate the skewing effects of the post-pandemic energy markets. This choice of the base year is of major consequence for the Indian aluminium industry since a large number of them consume electricity produced from coal-fired CPPs and the cost of coal determines the cost of electricity produced which will ultimately determine the overall cost of production. As shown in Figure 5, 80 per cent of the overall emissions are due to electricity consumption, while the remaining is split between process emissions and fuel consumption. These estimations take into account only scope 1 and 2 emissions and are limited to the plant boundary. For the sake of simplicity, it is assumed that all the electricity consumed in the production process is sourced from coal-based CPPs. In total, the industry emits nearly 77 MtCO2 .
Figure 5 Electricity emissions contribute significantly to the overall emissions.

Source: Authors’ analysis
The various technology options we considered for the MAC curves can be broadly divided into four categories and are depicted in Figure 6:
i. Energy efficiency: This involves reducing the energy consumption per unit output in existing equipment or extracting thermal energy or generating electrical energy through WHR.
ii. Alternative sources of energy: This decarbonisation lever uses alternative fuels such as NG, biomass, and renewable sources of electricity to meet energy demands.
iii. Emerging decarbonisation technology: This involves horizon technologies such as inert anodes that not only minimise energy consumption – and, therefore, CO2 emissions – but also abate other GHGs and increase the productivity of the plant.
iv. Emission management: It involves managing the remaining emissions by CCUS and carbon offsets through afforestation.
The evaluation of the abatement cost for each of the mitigation options involves three steps, as shown in Figure 7. First, facility-level data was collated and used to estimate the MAC for various carbon mitigation measures. To evaluate the MAC, we considered a discounted payback period for the required CAPEX over the lifetime of the equipment. We considered the scaling factor for the capital cost of the energy-efficiency equipment in order to reflect the cost in proportion to the size of the equipment. Based on industry feedback, the operating costs for the equipment were assumed to be a percentage of the CAPEX or a function of the net fuel or electricity (after accounting for the savings that result from the adoption of the energy efficiency or decarbonisation measure) used to operate the equipment. Second, the MACs of the mitigation technology were plotted against the emission reduction for each of the technologies analysed. Lastly, the investment required to transition to net-zero aluminium production was estimated and its effect on cost of aluminium was determined.
Figure 6 Carbon abatement options for aluminium manufacturing

Source: Authors’ analysis
Figure 7 Schematic representation of our methodology

Source: Authors’ compilation
The average thermal energy consumption in an Indian alumina refinery is 14 GJ per tonne of alumina, whereas the current best achievable value is 8 GJ per tonne of alumina, as depicted in Figure 3. Given the scope for reduction in thermal energy consumption, energy 0efficiency measures will be one of the key steps in the decarbonising of the alumina refining process. A literature survey showed that measures such as double digesters and the installation of falling film evaporators are still at a low technology readiness level (TRL) (BEE– GIZ 2018).
For the analysis presented in this report, the MACs for energy efficiency measures for alumina refining were estimated differently from those of other mitigation technologies. An in-depth analysis regarding energy efficiency technologies for the cement and steel industries revealed that the nature of these technologies is similar across hard-to-abate industries. Therefore, the capital and operational costs of installing it, normalised to the quantum of energy savings, will be similar for the aluminium industry. However, due to a lack of data regarding the efficacy of specific energy efficiency measures in the context of alumina refineries, the achievable energy reduction is taken as the difference between the energy consumption of the most efficient process in the world and the average energy consumption in an Indian alumina refinery, as shown in Figure 3 Consequently, the MAC for energy efficiency measures for alumina refining was estimated as the weighted average of the MACs and their abatement potential for all the technologies analysed for the cement and steel industries, which resulted in a reduction in thermal energy consumption. This value was estimated at USD −29.06/ tCO2 (Elango et al. 2023; Nitturu et al. 2023).
Figure 8 Natural gas infrastructure in proximity to alumina refineries and aluminium smelters

Source: Authors’ analysis
The literature survey revealed that the use of energy efficiency measures is far more prevalent for aluminium smelting than for alumina refining. Therefore, data regarding specific efficiency technologies and the capital and operational costs of installation were available. In our analysis, we consider two specific energy efficiency measures – namely, electrolysis off-gas WHR and cell operation optimisation. Furthermore, another measure, simply termed ‘energy efficiency measures for aluminium production’, was considered. This was done in order to bridge the gap between the Indian average and the current global best achievable electricity consumption in a smelting plant after accounting for energy reduction achieved by the two measures previously described. The MAC for this technology was estimated along the same lines as energy efficiency for alumina refining but only considered technologies resulting in a reduction in electrical energy consumption, resulting in an MAC of USD −25.64/tCO2 (Elango et al. 2023; Nitturu et al. 2023).
In addition, the inert anode is also considered an energy efficiency measure, even though it is categorised as an emerging decarbonisation measure, which currently has a TRL of 1 (BEE–GIZ 2018). The use of inert anodes results in a reduction in electricity consumption by 1,000 kWh per tonne of aluminium (Kvande and Haupin 2001) and is therefore considered an energy efficiency measure. The benefits of the use of inert anodes are discussed in detail in Annexure II.
In our analysis, we assume that the entire thermal energy requirement is sourced from coal combustion. To reduce emissions, we propose switching to alternative fuels such as biomass and NG. A mapping of the alumina refineries and their proximity to an existing or upcoming NG pipeline (shown in Figure 8) showed that nearly 89 per cent of alumina production capacity lies within 25 km of a pipeline. Consequently, it is considered that 89 per cent of the heat demand is met by NG, while the remaining is sourced from biomass.
Our estimates show that to source 89 per cent of the heat requirement for alumina refining from NG, 0.79 tonnes of coal per tonne of aluminium needs to be replaced by 0.31 tonnes of NG per tonne of aluminium. This translates to a total demand of 2.9 billion cubic metres (bcm) of NG. To make up the remaining energy requirement from biomass, 0.10 tonnes of coal per tonne of aluminium needs to be replaced with 0.12 tonnes of biomass per tonne of aluminium. This amounts to an annual biomass demand of 2.9 MTPA.
Figure 9 shows the breakdown of the delivered cost of NG and biomass. The delivered cost of NG is taken to be USD 11.3 per gigajoule, and it largely depends on its import price, while tax, cost of transport, and distribution account for the rest. In the case of biomass, the cost of the product itself accounts for most of the delivered cost and is taken as USD 4.7 per gigajoule (TIFAC 2018). The biomass source is considered to be within 200 km of the refining unit.
Figure 9 Fuel switch in alumina refining

Source: Authors’ analysis
The role of round-the-clock (RTC) RE is to offset the coalbased captive and grid electricity consumption. In the analysis, we obtained the cost of generating RTC RE and the solar, wind, and battery capacities required to meet the power demand based on recent tenders for grid-scale wind–solar–battery hybrid power plants (ReNew 2021). This hybrid power plant can supply 400 MW of RTC RE using the combined electricity generation capacity of a 400-MW solar power plant, a 900-MW wind power plant, and 100 GWh of battery storage. As per the prices and terms of this tender, we assumed that RTC RE power is available at 3.60 INR/kWh at the generation point, with an 80 per cent availability on an annual basis. We assumed that the remaining power requirement that is to be sourced from RE power is obtained from banked renewable energy from the grid.
We obtained the landed costs of RTC RE across various states where aluminium manufacturing takes place, including banking charges, from the open-access tariff calculator developed by the Council on Energy, Environment and Water (CEEW) Centre for Energy Finance (CEF) (CEEW–CEF 2023). To estimate the abatement cost of switching from CPP to RE, we considered that CPPs generate electricity at INR 3.72 per kWh (Ramakrishnan 2018). It should be noted that in this case, the threshold for RE replacement is taken as 70 per cent. This was done to make up for the intermittency of RE, which would inhibit the continuous supply of power to the smelter plants. The turndown ratio for conventional power plants is about 30 per cent. Hence, the replacement ratio was chosen as 70 per cent (Central Electricity Authority (CEA) 2019).
Figure 5 shows that 80 per cent of the total emissions are due to captive electricity produced in coal-fired power plants. After energy efficiency measures are in place, we estimate that the demand for electricity will be reduced from the current 14,361 kWh per tonne of aluminium to 12,599 kWh per tonne of aluminium. However, it should be noted that inert anodes are not yet commercially available. If inert anodes are not taken into consideration, the net energy consumption reduces to 13,599 kWh per tonne. Additionally, literature sources show that when conventional carbon anodes are used, the combustion of the anode material provides a certain amount of thermal energy required for the electrolysis process. Retrofitting these carbon anodes with inert anodes will lead to increased electricity consumption to make up for the loss in thermal energy (Kvande and Haupin 2001). However, literature sources also reveal that altering inter-polar distances and insulating cell walls will reduce heat losses and consequently lead to reduced demand for electricity. In addition, inert anodes last an average of two years, in contrast to carbon anodes, which last a month, since they are used up during the electrolysis process. Since each smelter plant consists of 100 to 400 individual cells (Kvande and Drabløs 2014), anodes are manufactured in captive units. Taking into account the energy consumption for anode manufacturing as well, there is a net reduction in energy consumption by 1 kWh/kg of aluminium produced (Kvande and Haupin 2001) if inert anodes are used. Therefore, this analysis considers the net electricity demand after energy efficiency is achieved, including inert anode installation, to be 12,599 kWh.
The installation of energy efficiency technologies reduces the electricity demand, and consequently, a lower installed capacity of RE is required. Out of the total requirement of 6.32 GW of power that is to be provided to the smelting facility, we estimate that 3.95 GW will be from RTC RE, which includes 20 per cent banking to make up for 80 per cent availability of RE power, while the remaining 2.37 GW will be captive power capacity.
Deep decarbonisation of the aluminium industry, beyond the use of energy efficiency measures, renewable energy, and alternative fuels, necessitates the use of alternative CO2 abatement measures such as CCUS. Using existing pipeline infrastructure ensures that issues related to the right-of-way for transporting CO2 to storage locations are overcome and the cost of laying new pipelines is eliminated. As seen in Figure 8 nearly 89 per cent of alumina refineries and aluminium smelters lie within a 25-km radius of a pipeline and can therefore implement CCS. However, India does not yet have an established CCUS ecosystem. The trajectory of India’s decarbonisation pathway will decide the cost of abatement of CCUS, given other competing mitigation measures such as alternative fuels. Therefore, CCS and CCU have equal shares in CO2 abatement through CCUS. In addition, CO2 capture has a peak efficiency of 85 per cent to 90 per cent. The remaining CO2 needs to be mitigated using offset mechanisms such as afforestation or direct air capture (DAC). A detailed analysis of the CCUS mechanism in India is presented in Annexure III.
Our analysis shows that deploying energy efficiency measures in alumina refining can reduce emissions by a mere 5 per cent, which corresponds to a reduction in thermal energy requirement of 11 GJ per tonne of aluminium and abatement of 1.03 tCO2 per tonne of aluminium. This reduction was estimated as the difference in energy consumption between an average Indian plant and the most efficient plant in the world (BEE–GIZ 2018). This is depicted in Figure 10. Energy efficiency measures such as installation of falling film evaporators, optimisation of temperature and residence time of second-stage digestion, proper descaling of flash tanks, installation of plate heat exchangers, and so on contribute to the reduction in thermal energy demand.
Similar to energy efficiency measures for alumina refining, deploying energy efficiency measures for aluminium smelting would reduce emissions significantly by 18 per cent. A large share of this, 14 per cent precisely, is due to the use of inert anodes for smelting. Electrolysis off-gas WHR, cell operation optimisation, and other measures contribute to the remaining reduction in emissions.
The use of alternative fuels such as NG and biomass for alumina refining abates 3 per cent of the emissions. Our analysis considers that 89 per cent of thermal energy comes from NG, thereby abating 0.57 tCO2 per tonne of aluminium, while the remaining energy is sourced from biomass, abating 0.17 tCO2 per tonne of aluminium. However, the emissions from the combustion of NG need to be abated through carbon management measures, which accounts for 4 per cent of the overall emission reduction. The use of RE power abates 49 per cent of emissions, corresponding to 38 MtCO2 of total emissions from the industry. However, since 30 per cent of the total electricity demand is still supplied by the CPP, the emissions due to coal combustion are mitigated through carbon management, contributing to 21 per cent of the total emission abatement.
Figure 10 Emission mitigation pathway for alumina refining and aluminium smelting

Source: Authors’ analysis
Figure 11 Cumulative MAC curve for the aluminium industry

Source: Authors’ analysis
scenario with an increased cost of coal is considered in the sensitivity analysis.
The MAC curve also highlights the fact that CCUS is an essential component of aluminium decarbonisation. Amongst the three techniques considered, carbon offset through afforestation is the most expensive while having the least impact and must therefore be implemented after exhausting all the other carbon mitigation measures discussed. On the other hand, CCS and CCU have a greater impact while also costing less in comparison. In addition, even though the MAC curve highlights the fact that the abatement cost for switching to RE is almost similar to that of CCS, a suitable CO2 transportation and sequestration system still needs to be established, with the identification of geological reservoirs. This may take a minimum of two decades for even the most promising reservoirs (Bakshi, Mallya, and Yadav 2023).
Figure 12(a) schematically represents the CAPEX requirement to abate emissions in the alumina refining and aluminium smelting industry. The CAPEX for energy efficiency for alumina refining is INR 5,949 crore (USD 793 million), while the CAPEXs required to abate 2.28 MTPA of CO2 through CCS and 2.28 MTPA of CO2 with CCU are INR 4,713 crore (USD 628 million) and INR 5,839 crore (USD 778 million), respectively. It should be noted that the CAPEXs for energy efficiency technologies for alumina refining were estimated using the weighted average MAC of all energy efficiency technologies studied for the decarbonisation of the cement and steel industries (Elango et al. 2023; Nitturu et al. 2023).
Figure 12(b) also shows the CAPEXs required for achieving net zero for aluminium production. Decarbonising the smelting process would require a CAPEX of INR 2.01 lakh crore (∼USD 27 billion), of which captive RTC RE with installations with 100 GWh of banking alone would require INR 1.18 lakh crore (USD 16 billion). We can see that deploying inert anodes (including a captive anode manufacturing unit) across all smelting facilities in the country would require INR 13,284 crore (USD 1.7 billion). In comparison, WHR and cell operation optimisation and other EE measures cumulatively require INR 13,266 crore (USD 1.76 billion).
Figure 12 CAPEX requirement for CCUS and RE is the highest to produce net-zero aluminium.

The CAPEX for CCS includes the cost of a capture plant and the cost of building dedicated pipelines to the nearest trunk pipeline that transports CO2 (alumina refineries and smelters) to storage locations. In the case of CCU, the CAPEX includes the cost of setting up CO2 capture plants, a methanol conversion facility, for example, and a hydrogen production unit that provides a steady stream of hydrogen for methanol production. The CAPEXs for CCS and CCU are estimated at INR 25,441 crore (USD 3.3 billion) and INR 31,523 crore (USD 4.2 billion), respectively.
Figure 13 shows the net increase in operating costs in a net-zero scenario for both alumina refineries and aluminium smelters. In order to consume 32,840 GWh of RE power, the manufacturing entities have to bear a cost of INR 12,413 crore (USD 1.6 billion), which arises from the open access charges levied on the RE power wheeled from points of generation to the smelting plants. Similarly, the switch to alternative fuels such as biomass (0.9 MTPA) and NG (2.9 bcm) would require additional expenses of INR 262 crore (USD 34 million) and INR 9009 crore (USD 1.2 billion), respectively (at a biomass cost of USD 4.7 per GJ and NG cost of USD 11.3 per GJ). The deployment of CCS and CCU also includes the cost of transporting CO2 through pipelines and other auxiliary operating costs associated with power consumption and so on. (Mukherjee and Chatterjee 2022; Srinivasan et al. 2021). Abatement of 8.77 MtCO2 through CCS results in an OPEX of INR 2,346 crore (USD 314 million), while the OPEX for abating the same amount of CO2 through CCU is INR 2,019 crore (USD 270 million). In total, in a net-zero scenario, operating costs would increase by INR 26049 crore (USD 3.5 Billion).
Figure 13 Net-zero aluminium manufacturing will incur significant operating costs.

Source: Authors’ analysis
switch to alternative fuels such as biomass (0.9 MTPA) and NG (2.9 bcm) would require additional expenses of INR 262 crore (USD 34 million) and INR 9009 crore (USD 1.2 billion), respectively (at a biomass cost of USD 4.7 per GJ and NG cost of USD 11.3 per GJ). The deployment of CCS and CCU also includes the cost of transporting CO2 through pipelines and other auxiliary operating costs associated with power consumption and so on. (Mukherjee and Chatterjee 2022; Srinivasan et al. 2021). Abatement of 8.77 MtCO2 through CCS results in an OPEX of INR 2,346 crore (USD 314 million), while the OPEX for abating the same amount of CO2 through CCU is INR 2,019 crore (USD 270 million). In total, in a net-zero scenario, operating costs would increase by INR 26049 crore (USD 3.5 Billion).
The adoption of carbon mitigation technologies directly affects the cost of producing aluminium due to the requirement of additional CAPEX and OPEX. This section highlights this increase considering a base price of INR 2,39,500 per tonne of aluminium (NALCO 2023). Figure 14a shows the break-up of the cost incurred in the production of aluminium. Thirty-four per cent of the cost of aluminium per tonne (INR 81,430 per tonne) is from electricity consumption during the smelting process; 23 per cent (INR 55,085 per tonne) is from the production of alumina; and 20 per cent (INR 47,900 per tonne) consists of the cost of other raw materials.
Figure 14b shows the price increase trajectory for netzero aluminium. According to our analysis, net-zero aluminium is nearly 61 per cent more expensive than conventional aluminium. However, a 1.2 per cent decrease in production costs can be achieved by adopting alumina EE, aluminium EE and electrolysis off-gas WHR. An emission intensity of 16.13 tCO2 per tonne (23 per cent reduction) can be achieved by further using alternative fuels like biomass in alumina refining and retrofitting with inert anodes in aluminium smelting resulting in a cost increase of less than one per cent. However, for further decarbonisation, adopting RE power would result in a cost increase of 18 per cent and net zero aluminium would cost 61 per cent more than the base price. Alternatively, in a scenario where the switch to RE power does not happen and CCS is available at USD 50 per tCO2 , then net-zero aluminium would cost 21 per cent higher than the base price (represented as a dotted line).
Figure 14 Net-zero aluminium is 61% more expensive than conventional aluminium.

Source: Authors’ analysis
In the base case, we considered pre-pandemic energy prices to eliminate the price distortions that occurred during the pandemic. However, the cost of coal and NG increased significantly in FY 2022–23 due to increased demand after the pandemic and changing geopolitical situations. The sensitivity analysis captures the impact of the higher prices of fossil fuels on the MAC curve. The cost of coal increased to INR 8,000 per tonne, the cost of captive power increased to INR 9 per kWh, and the cost of NG doubled to USD 22 per million British thermal units (MMBtu). Figure 15 reflects the change in the MAC curve as a result of this increase in fuel prices. Compared to the base case, the abatement cost of fuel switching to NG is the highest. Additionally, due to the increase in the cost of coal, the cost of abatement for fuel switching to biomass was reduced. Most importantly, the abatement cost for RE power is negative, meaning there is a net financial gain by transitioning to RE power from coal based captive power plants.
Figure 15 The abatement cost of fuel switch to NG is the highest at a NG price of USD 22 per MMBtu.

Source: Authors’ analysis
The carbon footprint of aluminium production in India is 20.88 tonnes of CO2 (tCO2) per tonne of aluminium. This includes the emissions due to direct fuel use, emissions associated with the electricity consumed in the process and the emissions generated due to the nature of the process itself, also termed ‘process emissions’.
Aluminium and its alloys are used extensively for aircraft manufacturing, building materials, consumer goods like refrigerators and air conditioners, electrical conductors, and chemical and food-processing equipment.
Aluminium production is particularly hard to decarbonise since the process requires large amounts of uninterrupted power supply, which are currently being met through coal-based capacities. In addition, levers such as energy efficiency and fuel switch have a limited role in decarbonising aluminium production.
Our study shows that the use of power sourced from renewable energy (RE) abates 49 per cent of emissions, corresponding to 38 MtCO2 of total emissions from the industry. Since aluminium production requires a reliable supply of electricity, we consider that 30 per cent of the demand would still be supplied by the captive power plant (CPP). Consequently, the emissions due to coal combustion need to be mitigated through carbon management, which would contribute to 21 per cent of the total emissions abatement. The remaining emissions can be abated using levers such as energy efficiency and fuel switch.
Can white hydrogen accelerate India’s energy transition?
Unlocking the Potential for a Gas-Based Economy in India
How Secure is India’s Energy Future?
Advancing India’s Green Steel Transition
CO₂ Pipeline Network for Carbon Capture and Storage in India