Council on Energy, Environment and Water Integrated | International | Independent
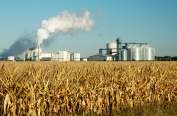
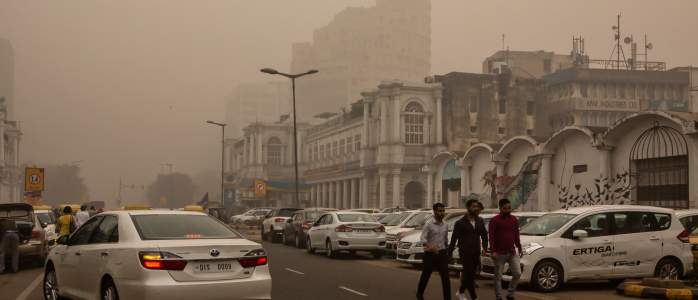
Around 75 per cent of families in Delhi-NCR have at least one member suffering from air pollution-related health issues. A recent study reveals that Delhi residents are increasingly being exposed to much finer particulate pollutants, which pose a severe risk to human health. A combination of local and transboundary sources, along with meteorological factors, are responsible for this deterioration in air quality. To capture this dynamic nature of air pollutants, a 2021 study by the Council on Energy, Environment and Water (CEEW) reviewed five emission databases to understand variations among the leading pollution sources in India. It emphasised the urgent need for an official emissions database to aid management and mitigation efforts. Tackling air pollution in urban centres requires area-specific action plans, which are often more effective than tracking individual pollution sources. Enter air pollution hotspots.
Hotspots are specific locations within a city that consistently or frequently exceed national prescribed limits. These areas are often prioritised for implementing and designing interventions in city action plans. However, there is no standard framework for defining urban air pollution hotspots, as they depend on several factors, including sources, pollutants of interest, and temporal variations. Hotspots can span across neighbourhoods, districts, or entire regions, with their scope varying based on the basis on implementation priorities and compliance monitoring.
In India, several authorities have identified such hotspots. Delhi, for instance, has relied on area-specific action plans to identify pollution hotspots. However, the lack of a uniform framework continues to hinder effective delineation and management.
Delhi, one of India's most polluted cities, has implemented micro-level plans to map, identify, and manage its pollution hotspots. In 2018, the Department of Environment, Government of NCT of Delhi, identified 13 major air pollution hotspots based on annual PM10 levels exceeding 300 μg/m³ and PM2.5 levels exceeding 100 μg/m³ recorded from the nearest located Continuous Ambient Air Quality Monitoring Stations (CAAQMS). These included Anand Vihar, Ashok Vihar, Bawana, Dwarka, Jahangirpuri, Mundka, Narela, Okhla, Punjabi Bagh, R.K. Puram, Rohini, Vivek Vihar, and Wazirpur. Detailed inventorisation of major air pollution sources was also carried out in 24 priority areas within Delhi.
Subsequent efforts have refined this list. A 2021 study identified 11 air pollution hotspots within Delhi using a three-criteria approach: the annual frequency, scale of pollutants, and consistency in exceedance above the National Ambient Air Quality Standards, using the three-year CAAQMS database. By 2024, the number of identified hotspots has increased from 13 to 22, according to a 2024 report that analysed the annual average concentration of PM2.5, examining trends from January 2022 to October 2024. In the last week of October 2024, the Delhi Pollution Control Committee (DPCC) started redefining hotspots and identified eight more hotspot areas in Delhi, with plans to prioritise implementing action plans in these added locations. This blog furthers these efforts by analysing existing data to classify emerging hotspots in Delhi and recommending systemic changes to help improve the city’s action plans.
We analysed PM2.5 and PM10 concentrations from all 40 CAAQM stations for two different time periods to identify variations during the whole year (October 2023 - September 2024) and winter months (October 2023 - February 2024), addressing both seasonal and year-round changes in air quality levels. Adequate data was available for all 40 stations, with an uptime above 60 per cent.
Overview:
Methodology and Findings:
Out of the 40 stations, the top 50 percentile (18 stations) that recorded higher PM2.5 concentration levels were selected separately from both the annual average and winter period average. Similar analyses were also done separately for PM10 levels. Data gaps among any station during a monitoring period may cause statistical errors; thus, all 40 stations were assessed, and they provided adequate data throughout the selected times.
Figure 1: Designed framework for Hotspot identification.
The following methodology was developed for and applied in the current study
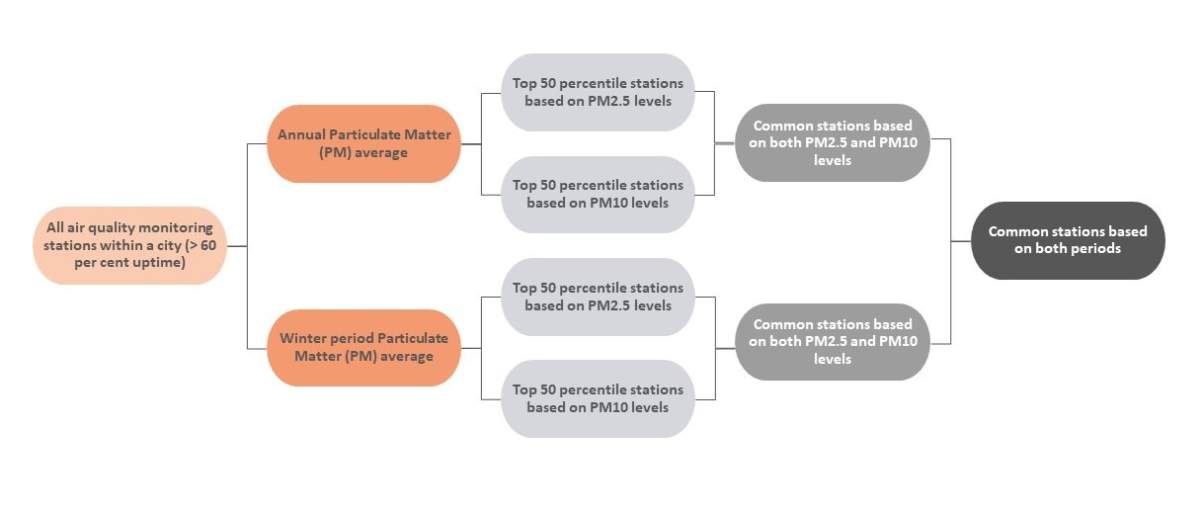
Figure 2: 13 common stations identified through a year-round analysis
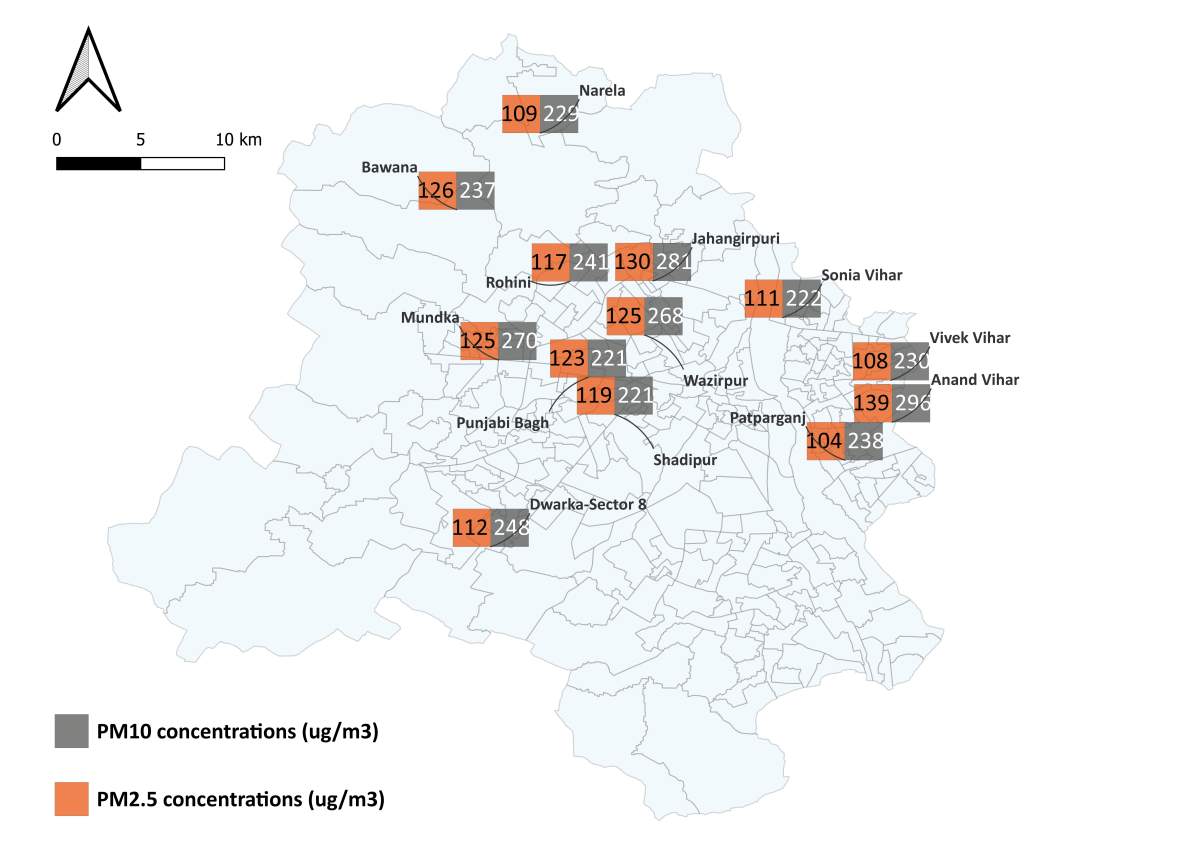
Figure 3: 13 common stations identified during last year’s winter months analysis
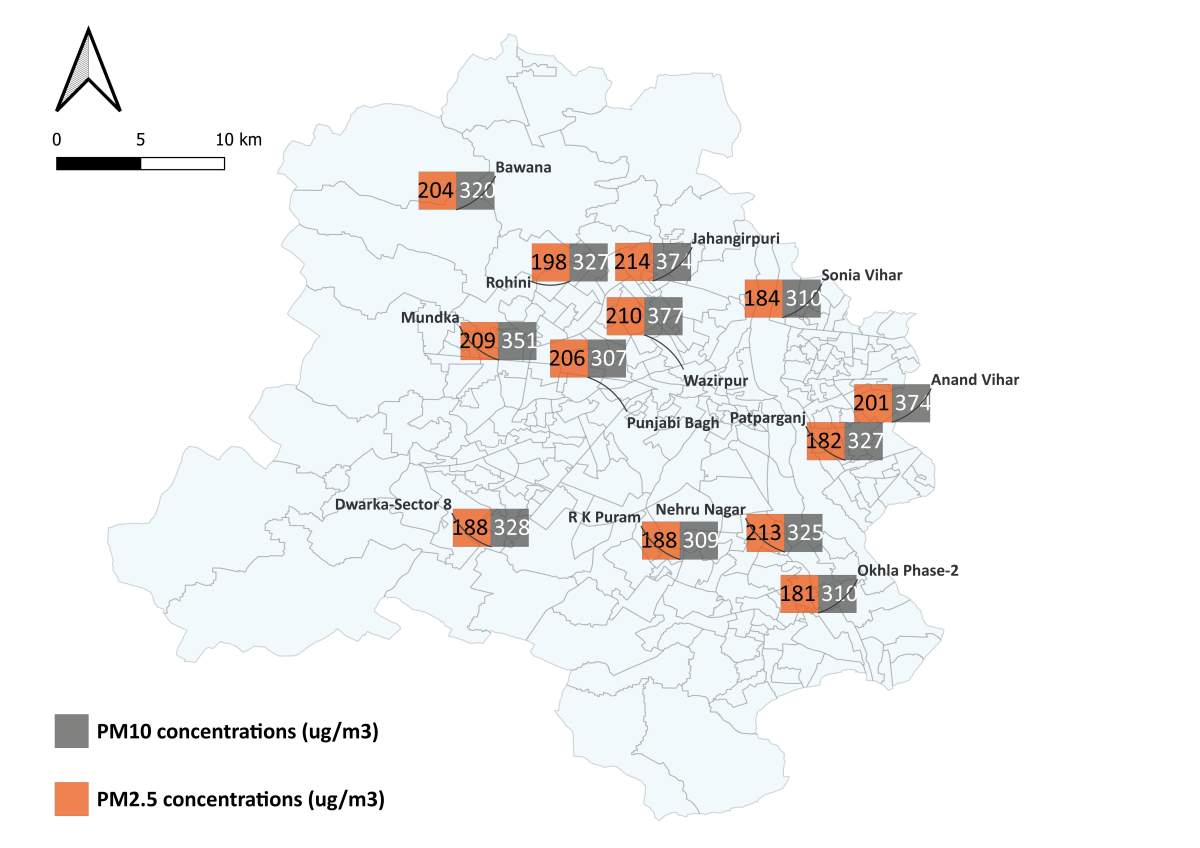
Out of those stations, 13 stations (75 percentile) are identified as common with PM10 and PM2.5 concentration levels for both periods (as shown in the graphs above). Thereafter, comparing the stations from both periods, only 10 (75 percentile) stations were found to be common and emerged as high-priority air pollution hotspots.
The 10 common stations are Anand Vihar, Bawana, Dwarka-Sector 8, Jahangirpuri, Mundka, Patparganj, Punjabi Bagh, Rohini, Sonia Vihar, and Wazirpur.
Figure 4: 10 identified hotspots in Delhi
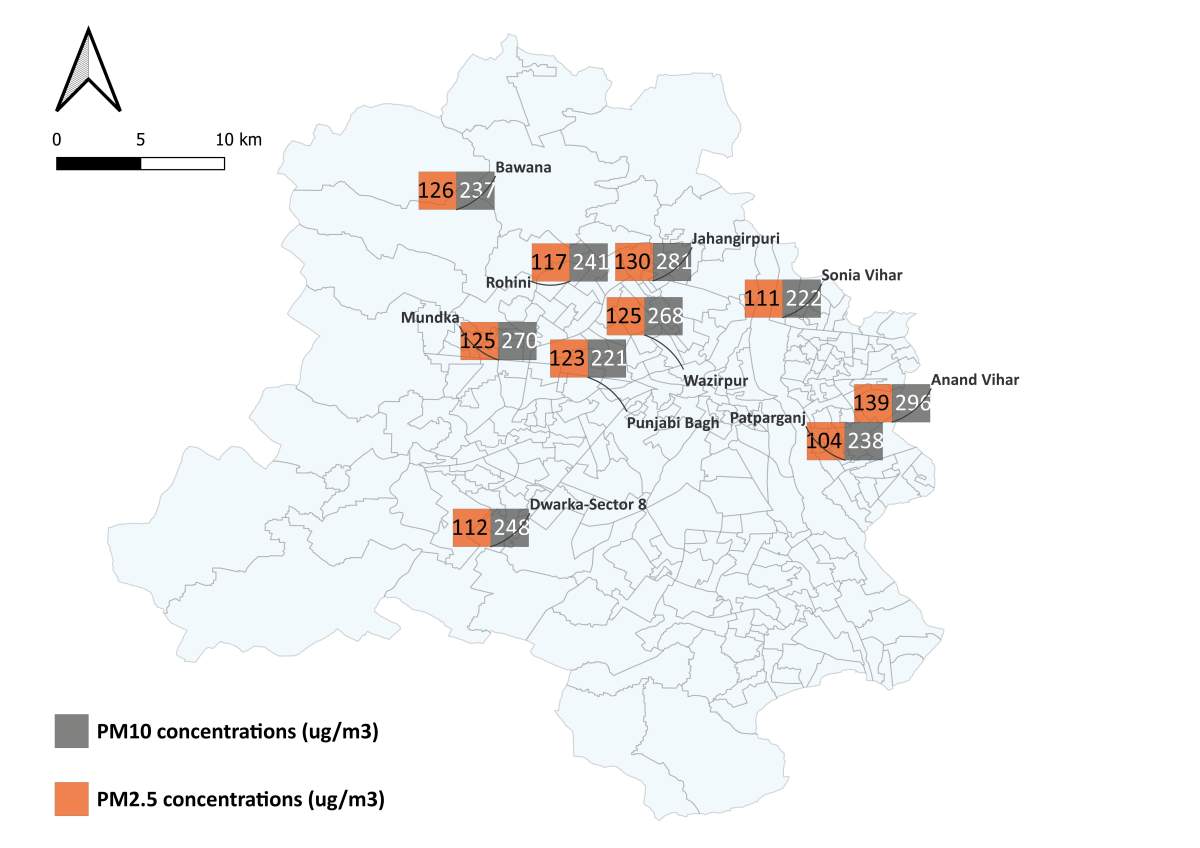
While previous studies have already classified most of these stations as hotspots, Sonia Vihar and Patparganj can now be identified as emerging hotspots in Delhi. On the other hand, areas like Ashok Vihar, Vivek Vihar, Okhla, Narela, and R.K. Puram has also been observed to have improved PM levels compared to the other hotspots.
To assess the observed changes among emerging and improving hotspots, two analyses were conducted:
Ratio Analysis of Marker Pollutants
Linear regression of these ratios from 2018 to 2024 (till 30 September) revealed:
Land Use Land Cover (LULC) Analysis
A 2x2 km grid was used to compare LULC changes between 2018 (when hotspots were first identified by DPCC) and 2023:
Vivek Vihar and Okhla showed no significant LULC changes but likely benefited from stricter enforcement of city action plans.
Figure 5: Yearly variation of air pollutants in Patpargunj

Figure 6: Yearly variation of air pollutants in Sonia Vihar
Such area-specific insight into the city's air pollution hotspots needs to be followed up with similarly targeted interventions backed by dynamic data and strong enforcement mechanisms:
By leveraging area-specific data, standardised methodologies, and strict enforcement, Delhi can make significant progress in improving its air quality and safeguarding public health.
Mohammed Sahbaz Ahmed is a Research Analyst, Monami Dutta is a Consultant, and Arpan Patra is a Programme Associate at the Council on Energy, Environment and Water (CEEW). Send your comments to [email protected]


Add new comment