Council on Energy, Environment and Water Integrated | International | Independent
Suggested citation: Bassi, Nitin, Karthik Ganesan, and Ashish Dangi. 2022. How Safe are Drinking Water Services in Rural India? Case for Strengthening the Existing Data and Information System. New Delhi: Council on Energy, Environment and Water.
This study analyses the extent to which data and information on safely managed drinking water services are reported in India. Such data is characterised by access to the improved source of drinking water that is located on the premises, available when needed, and free from faecal and priority chemical contamination. Based on the analysis, the issue brief recommends ways like expanding the scope of future surveys, scaling up the IoT-based smart water supply monitoring, and metering individual water connections to strengthen the existing reporting system.
India has made tremendous progress in increasing the coverage of the drinking water supply infrastructure in rural areas. As per the joint monitoring programme of the United Nations Children’s Fund and World Health Organization, by 2020, 89 per cent of the rural population in India was covered with at least basic drinking water services, i.e., they had access to an improved water source within a round trip of 30 minutes. Further, as per the latest information reported by the Department of Drinking Water and Sanitation, Ministry of Jal Shakti, Government of India, as of 31 May 2022, 50 per cent of rural households had a tap connection within the dwelling or premises. However, there is a dearth of information on whether the progress in creating the physical infrastructure has translated into an improvement in the reliability and safety of drinking water services in rural households.
With this background, our issue brief focuses on ascertaining the extent to which data on safely managed drinking water services are reported in India and makes recommendations to strengthen the existing data and information system. These services are characterised by access to the improved source of drinking water that is located on the premises, available when needed, and free from faecal and priority chemical contamination (refer to Figure ES 1). For this purpose, the four main national government sources that report data and information on rural drinking water services in India were reviewed. These include the Census of India, National Sample Survey (NSS), National Family Health Survey (NFHS), and the Integrated Management Information System (IMIS) dashboard maintained by the Department of Drinking Water and Sanitation (DDWS), Ministry of Jal Shakti, Government of India. These sources were reviewed concerning the data and information they report on rural drinking water services, various terminologies used, and the possibility of using them to make reliable inferences on the progress made in providing safely managed drinking water services.
Figure ES 1: Safely managed drinking water services refer to an improved water source that is within the premises, is reliable, and is safe
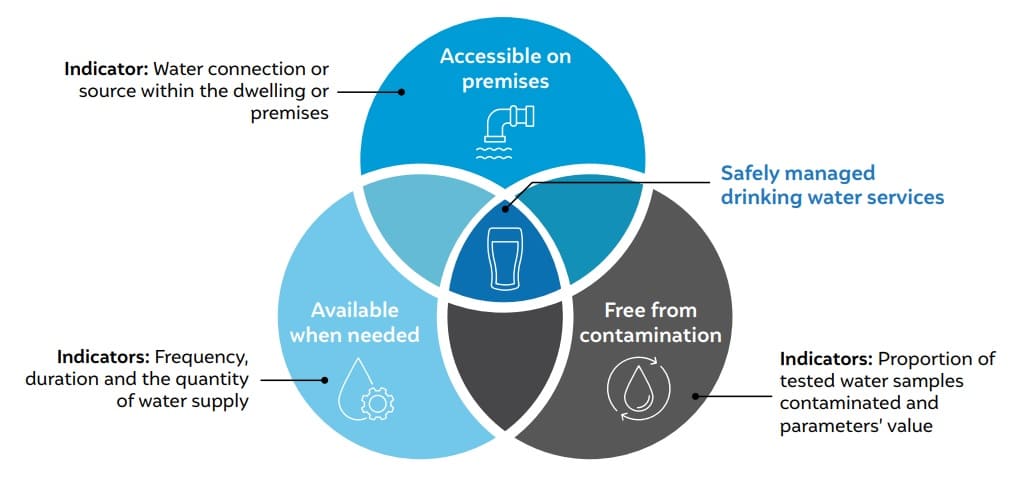
Source: Authors’ proposed framework based on United Nations Children’s Fund and World Health Organization, 2019
Table ES 1: Data and information provided by various national government sources only partially cover all components of safely managed drinking water services
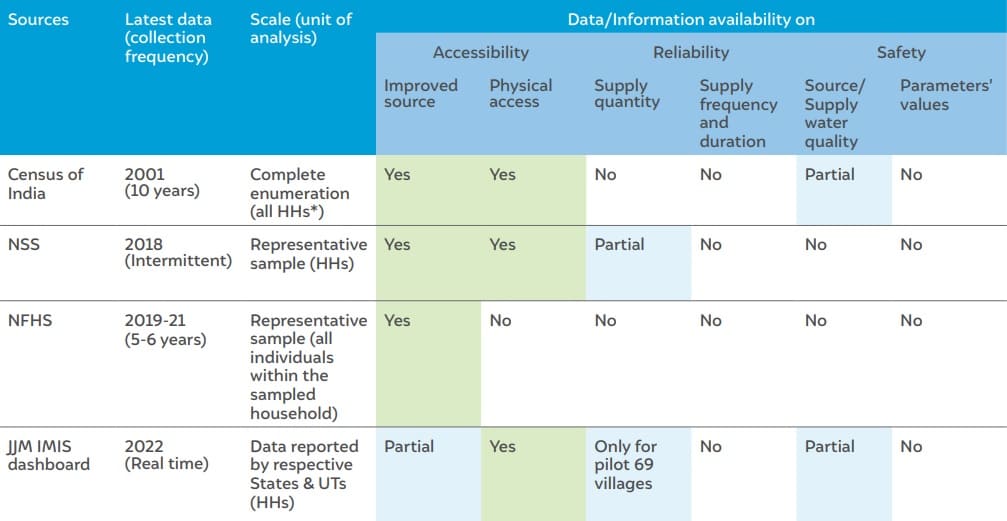
Source: Authors’ analysis
Note: *HHs refers to households
Figure ES 2: In 2018, 50 per cent more rural Indian households had improved drinking water source at their premises compared to 2011
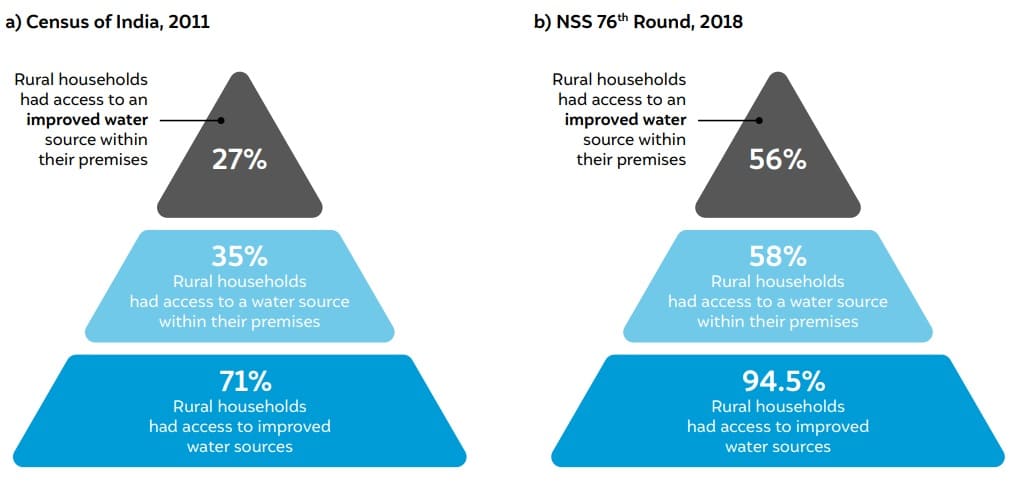
Source: Authors’ analysis using Census of India, 2011 and NSS 76th Round, 2018 data
We make five recommendations to strengthen the existing data and information systems and validate the progress with the provision of safely managed drinking water services in rural areas. They include:
City-level Action Plan for Reuse of Treated Water for Varanasi
The Indian Subcontinent and the Water CycleFrom Monsoon to Ocean
Water, Nature, Progress: Solutions for a New India
India and the GulfA New Strategy for Water, Energy, Food, and Ecosystem Security
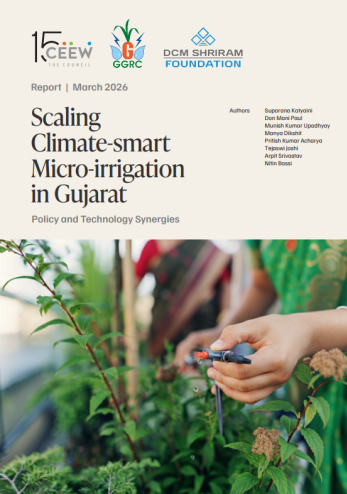
Scaling Climate-smart Micro-irrigation in Gujarat