Council on Energy, Environment and Water Integrated | International | Independent
Suggested citation: UNICEF and CEEW. 2024. Assessing Risks to India's Drinking Water, Sanitation, and Hygiene Systems from Extreme Climate Events. New Delhi, India: Council on Energy, Environment and Water (CEEW), India.

This study, in collaboration with the United Nations Children’s Fund (UNICEF), develops and computes a district-level risk index for India's drinking water, sanitation, and hygiene (WASH) services. It is conducted from an interdisciplinary lens and focuses on risk to the WASH systems in households, educational, and healthcare facilities.
It first shortlists frameworks for conducting a systematic review of the literature; reviews grey and non-grey literature to identify indicators for climate risk assessment of the WASH services in India; shortlist and assign weightage to 50+ indicators using inputs from stakeholders convening following the two steps Delphi approach; and computes the risk index to WASH services for each district of the country using the methodology presented in the Fifth Assessment Report (AR5) framework of the Intergovernmental Panel on Climate Change (IPCC).
Key highlights
Climate change induced extreme events like floods, cyclones, droughts, etc. has been affecting India making it one of the most at risk nations globally (Eckstein, Künzel, and Schäfer 2021). For example, between 2000 and 2019, India experienced an average of 17 flood events per year, making it the second most flood-affected country in the world (CRED and UNDRR 2020). Also, in 2021, about 83 per cent of its population was exposed to droughts (UNCCD 2021). More than 80 per cent of India’s population lives in districts highly vulnerable to extreme hydro-meteorological disasters (Mohanty and Wadhawan 2021). The increasing frequency and intensity of such extreme events is leading to infrastructural and service-delivery failures, especially in the drinking water, sanitation, and hygiene (WASH) sector. Inadequate delivery of WASH services, whether in terms of quantity, quality, or frequency and time of availability, has far-reaching consequences for socio-economic inequities, and this can be directly corroborated through impacts on public health. Estimates by the World Health Organization (WHO) and the Institute of Health Metrics and Evaluation (IHME) for 2016 and 2019 attribute 1.6 million and 1.9 million deaths, respectively, worldwide to unsafe WASH practices (Wolf et al. 2023). Another estimate from 2019 on the burden of diseases attributable to unsafe WASH practices shows that for the year 2019, 69 per cent of diarrhoeal diseases, 14 per cent of acute respiratory infections, 10 per cent of undernutrition-related diseases, and 100 per cent of the burden of soil-transmitted helminthiasis could have been avoided with safe WASH practices (Wolf et al. 2023).
The burden of (climate change–exacerbated) WASH-attributable diseases is borne disproportionately by women, children, elderly people, and impoverished people (WHO 2023b; WaterAid 2017). In 2023, it was estimated that about 1.8 billion people did not have drinking water on their premises, and in two out of three households, women were primarily responsible for water collection (UNICEF and WHO 2023). Improving access to WASH in households, healthcare facilities (HCFs), and educational facilities has been linked to better income, gender equity, lower maternal mortality, and lower child mortality (Richardson et al. 2024; UN Water n.d.; WaterAid 2017).
The attainment of sustainable development goals (SDGs) 6.1 (safe and affordable drinking water for all), 6.2 (adequate and equitable sanitation and hygiene for all), 1.4 (aspects of no poverty), 3.3 and 3.9 (aspects of good health and well-being), 4.a (aspects of quality education), 5 (gender equality and empowerment of women and girls), 11.b and 11.5 (aspects of sustainable cities and communities, including disaster resilience), and 13.1 (aspects of climate action), is contingent on climate proofing of the WASH sector to ensure universal access to adequate WASH services. Estimates show that annualised net benefits worth USD 168 billion can be reaped from 2021 to 2040 by achieving universal access to safely managed water, basic hygiene, and safely managed sanitation (WaterAid 2021).
It is thus imperative for policymakers to prioritise the integration of climate adaptation strategies into WASH planning to safeguard the well-being of India’s most vulnerable populations and to ensure functionality of WASH services during and after hydrometeorological disasters. This will prevent declines in the gains achieved under the Swachh Bharat Mission (SBM) and Jal Jeevan Mission (JJM), India’s two major flagships schemes under WASH. For India, an investment of USD 1 towards adaptation could reduce the annualised average loss from extreme events, slow-onset hazards, and biological hazards by USD 5.5 (UNESCAP 2022). This necessitates identifying underlying risk concerns on a granular level through extensive risk assessments across sectors. This study is an effort in the same direction.
The purpose of this study is to develop a comprehensive climate risk assessment framework specifically tailored to the WASH sector in India. By taking into account the effects of acute and chronic climate events at the district level, the framework provides a granular understanding of how the WASH sector is impacted in different regions by climate-related risks. The study thus has the following objectives:
The definition of risk used in this study is from the Intergovernmental Panel on Climate Change (IPCC) Fifth Assessment Report (AR5), whereby risk is defined as a product of hazard, exposure, and vulnerability (adaptive capacity and sensitivity) (Pachauri and Meyer 2014). The methodology consisted broadly of five steps, starting from conducting a systematic literature review (SLR) of 97 studies from the grey and non-grey literature to plotting the GISbased maps, as seen in Figure ES1.
The method used for the SLR was the larger ‘PSAlSAR’ framework, under which the research protocol was defined using the ‘PICOST’ framework (Figure ES1) and reporting of results was done using the ‘PRISMA’ format. The search phrases used in the SLR were such that there was a special focus on women, children, low-income groups, and caste, to align with the aims of the current study.
This helped with identification of the long list of indicators (428 in total), which were further shortlisted to 53 indicators after applying the inclusion and exclusion criteria. Of these 53 indicators, 19 focus on children, women, scheduled castes (SCs), scheduled tribes (STs), people with disabilities, rural agricultural landless households, and distressed migration (refer to indicator numbers 17, 18, 19, 20, 23, 25, 26, 27, 30, 31, 32, 33, 35, 37, 39, 40, 42, 43, and 44 in Table 4). Figure ES2 presents a synthesised version of findings from the various stages using the PRISMA format.
The shortlisted indicators were ranked using the Delphi method in online and offline mode on a scale of relevance ranging from 0 to 4, whereby 0 corresponds to not relevant, 1 to less relevant, 2 to moderately relevant, 3 to highly relevant, and 4 to very highly relevant. Finally, 53 indicators were selected, some of which were added during the Delphi process by the stakeholders. The ranks were utilised for assigning weights to the indicators. Thus, the risk index was computed and GIS maps were prepared for hazard, exposure, and vulnerability sub-indices and the overall risk index to WASH from climate extremes was determined.
Figure ES1 Research methodology used in this study

Figure ES2 PRISMA chart on reporting of SLR steps

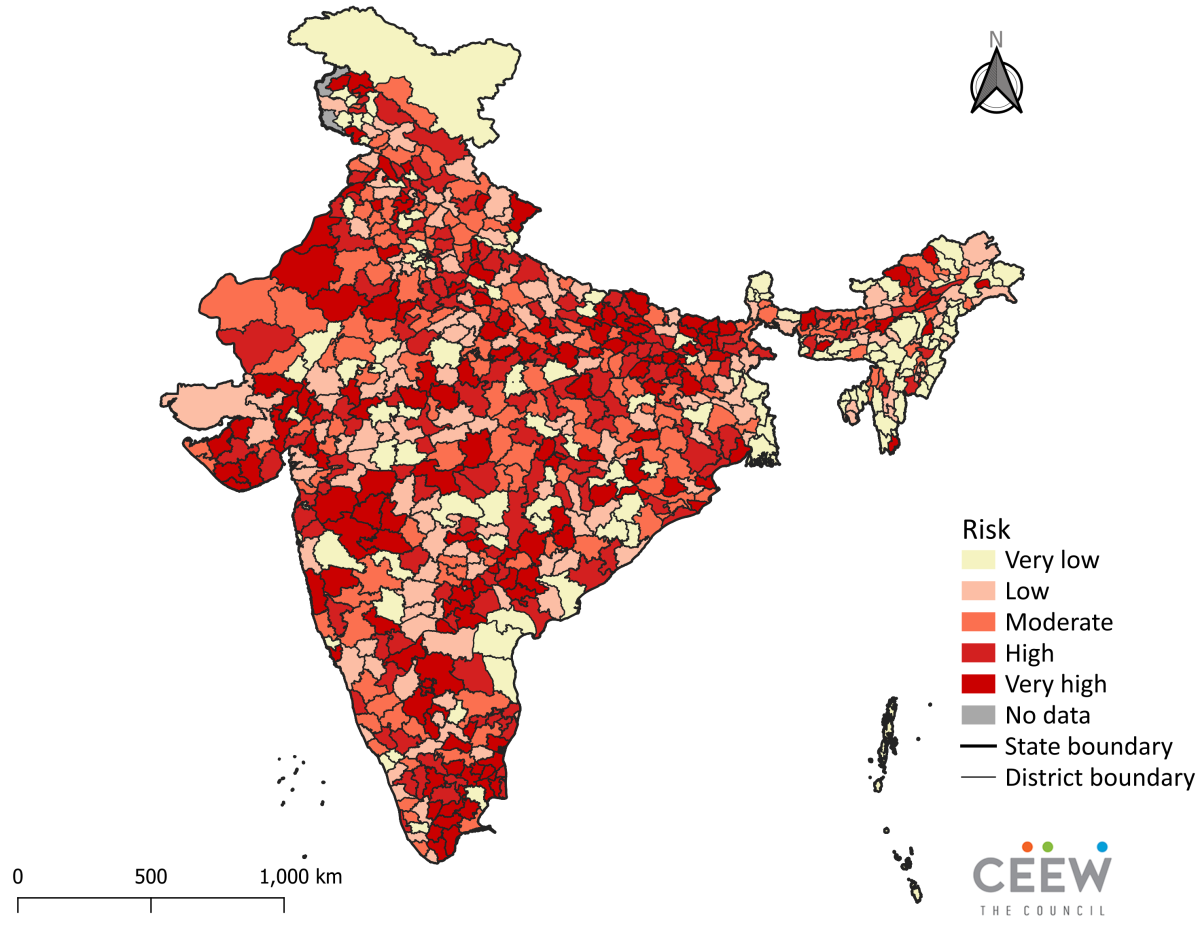
Figure ES3 shows the climate extremes risk map for the Indian WASH sector. More than 40 per cent of districts in India are either at very high or high risk. Furthermore, it can be seen in Figure ES3 that pockets of very high risk to WASH services are seen in nine states: Uttar Pradesh, Tamil Nadu, Bihar, Telangana, Gujarat, Maharashtra, Punjab, Rajasthan, and parts of Karnataka. The districts in the high-risk category are dispersed among seven states, including Uttar Pradesh, Bihar, Madhya Pradesh, Tamil Nadu, Maharashtra, Telangana, and Gujarat. The insights gained from studying the sub-components used in calculating the risk are as follows:
Figure ES3 Risk map for the WASH sector at the district scale for India
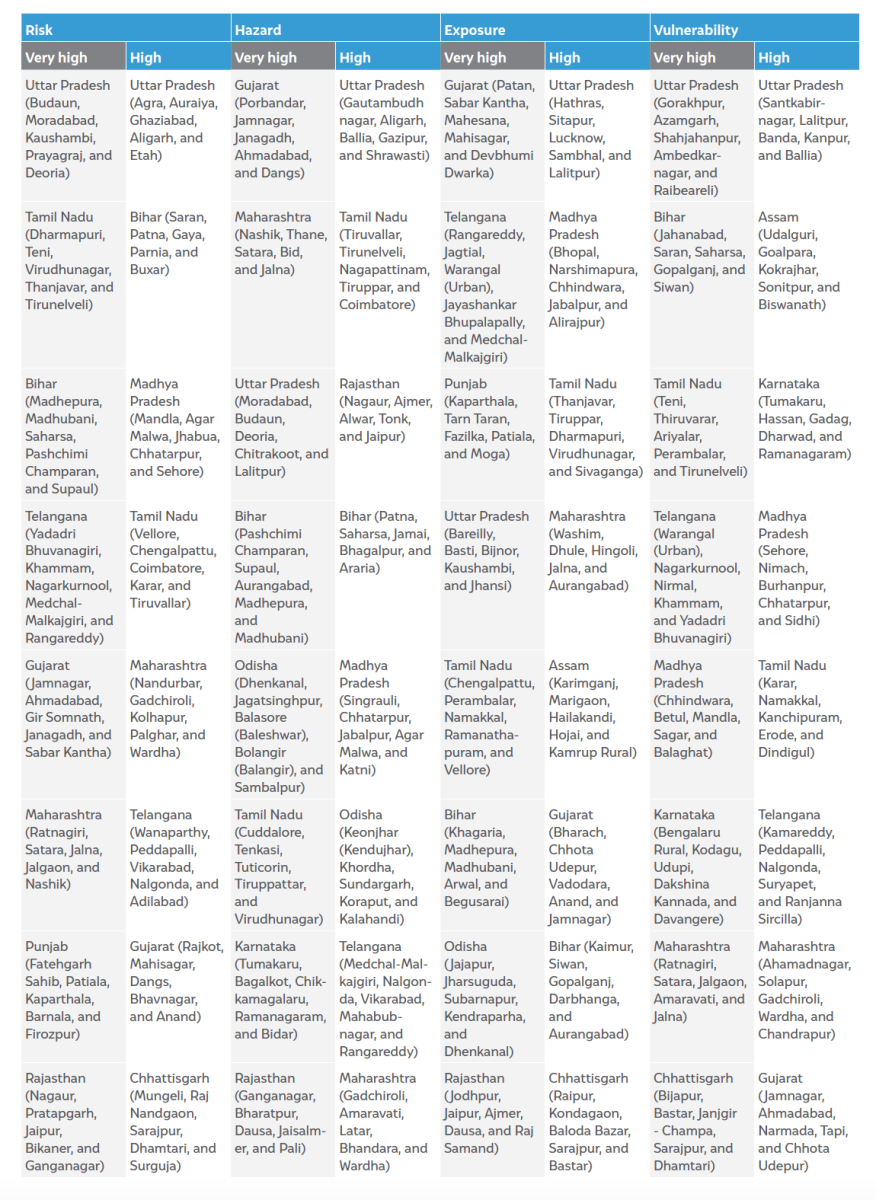
For adaptive capacity, the top five indicators are the number of functional government health facilities in the district per 1,000 population; the density of automatic weather stations (AWSs) and automatic rain gauge (ARG) stations in the district, per square kilometre; the percentage of rural schools and aanganwadis with availability of drinking water through tap connection, at the district level; the annual average budget expenditure by the government on WASH in rural areas per district per household for the years 2020–23; and the percentage of the total wards/urban local bodies declared as ODF++, in the district. The names of the top 5 districts of these states in very high and high vulnerability category is listed in table ES1 below.
Table ES1: The names of the states and top 5 districts under them (in bracket) lying in very high and high categories of risk, hazard, exposure, and vulnerability
The findings can inform the development of hyperlocal strategies that can minimise impacts and avert or reduce loss and damage to WASH systems and services during disasters. We make the following recommendations to ensure the same:
City-level Action Plan for Reuse of Treated Water for Varanasi
The Indian Subcontinent and the Water CycleFrom Monsoon to Ocean
Water, Nature, Progress: Solutions for a New India
India and the GulfA New Strategy for Water, Energy, Food, and Ecosystem Security
Scaling Climate-smart Micro-irrigation in Gujarat