Council on Energy, Environment and Water Integrated | International | Independent

Suggested Citation: Borgohain, Hladinee, Adya Sharma, Rahul Das, and Abhishek Kar. Are Clean Cooking Fuels Reaching India's Urban Poor? Access and Willingness to Pay Across 10 Indian Cities. New Delhi: Council on Energy, Environment and Water (CEEW), 2026.
Cooking with solid fuels causes household air pollution (HAP), which is associated with negative externalities on health and the environment. To ease access to clean cooking fuels, the Government of India (GoI) launched the Pradhan Mantri Ujjwala Yojana (PMUY) in 2016. Aimed at providing poor women subsidised LPG connections, the PMUY has benefited over 105 million women from economically deprived households till July 2026. Yet, according to NSS 79th Round 2023, 37 per cent of households rely primarily on polluting solid fuels—reflecting persistent challenges with affordability, access, and sustained usage.
In India, 41 per cent of the urban population (203 million) lived in informal settlements in 2022. Urban informal settlement households represent a particularly underserved and understudied population in the energy access literature as most studies focus on rural populations or broader urban samples that fail to capture the specific constraints faced by informal settlement dwellers. From previous research by CEEW and reports from Press Information Bureau (PIB), we observe that sustained use of LPG is low—due to the high cost of refills, delays in home delivery of refills, and limiting social barriers. This study draws on a survey of 1,116 households in informal settlements across 10 major Indian cities and attempts to understand the enablers and challenges to the adoption and sustained use of LPG, as well as PNG and electric cooking. We use willingness to pay for LPG to gauge the price point at which a domestic LPG cylinder would be affordable for households in urban informal settlements. Additionally, we use data on demographics, household characteristics, sources of household income, and perspectives on different fuels to understand the factors that shape their cooking fuel choices.
In India, many people still rely on fuels such as charcoal, coal, kerosene, firewood, and agricultural waste. Using these fuels for cooking causes household air pollution (HAP), releasing pollutants like carbon monoxide, nitrogen oxides, and fine particulate matter (PM) (UNEP 2021). PM2.5 in such a setting can exceed WHO recommended levels by 100 times (WHO 2025). Additionally, about 30 per cent of ambient PM2.5 is attributable to HAP that reaches outdoor air and contributes significantly to ambient pollution (Chowdhury et al. 2023; McDuffie et al. 2021). In India, HAP is a leading risk factor for death; in 2023, it accounted for over 9 lakh deaths, one of the highest attributable to a single source (SoGA 2025). Using these fuels for cooking leads to other negative externalities on health and the environment (Kar et al. 2019); and it also affects economic growth by reducing productivity, decreasing labour supply, and increasing health-care expenditure.
To ease access to clean cooking fuels, the Government of India (GoI) launched the Pradhan Mantri Ujjwala Yojana (PMUY) in 2016. Aimed at providing poor women subsidised liquefied petroleum gas (LPG) connections, the PMUY has benefited over 105 million women from economically deprived households (PPAC 2026).
Several reports by CEEW and the Press Information Bureau indicate that sustained usage has been low, due to the high cost of refills, delays in home delivery, and cultural preferences (MoPNG 2024; Mani et al. 2021; Kar et al. 2024). And 37 per cent of households still rely primarily on polluting solid fuels—reflecting persistent challenges with affordability, access, and sustained usage of clean fuels (NSS 79th Round 2023).
Several studies discuss the need to make LPG affordable, but little research has been conducted to determine what price point or price range is acceptable for the primary or exclusive use of alternative clean cooking fuels such as LPG, PNG, or electricity, particularly in informal settlement households,1 which represent a particularly underserved and understudied population in the clean cooking transition. In 2022, 41 per cent of the urban population (203 million) lived in informal settlements (UN-Habitat 2024). However, despite their scale and distinct socioeconomic and household characteristics, urban informal settlement households have received limited attention in the energy access literature (Jha et al. 2021): most studies focus on rural populations or broader urban samples that fail to capture the specific constraints faced by the population in informal settlements.
Therefore, this study attempts to address the gap by examining the fuel use patterns, affordability and related constraints, perspective on cooking fuels, and the willingness to pay (WTP) for clean cooking fuels2 among urban informal settlement households across 10 Indian cities. The COVID-19 pandemic also triggered a significant decline in the use of clean cooking fuels, with a disproportionate impact on vulnerable populations (Das et al. 2023). The findings are drawn from a larger survey of more than 4,000 respondents across urban informal settlements, migrants and rural households. The three respondent groups were selected as they represented the vulnerable population who had higher likelihood of reverting to solid fuel usage after the pandemic in 2020. This issue brief presents findings from 1,116 households living in urban informal settlements across 10 cities in 10 states. Here, we aim to answer three questions.
High penetration of LPG masks stacking behaviour and informal usage of domestic cylinders
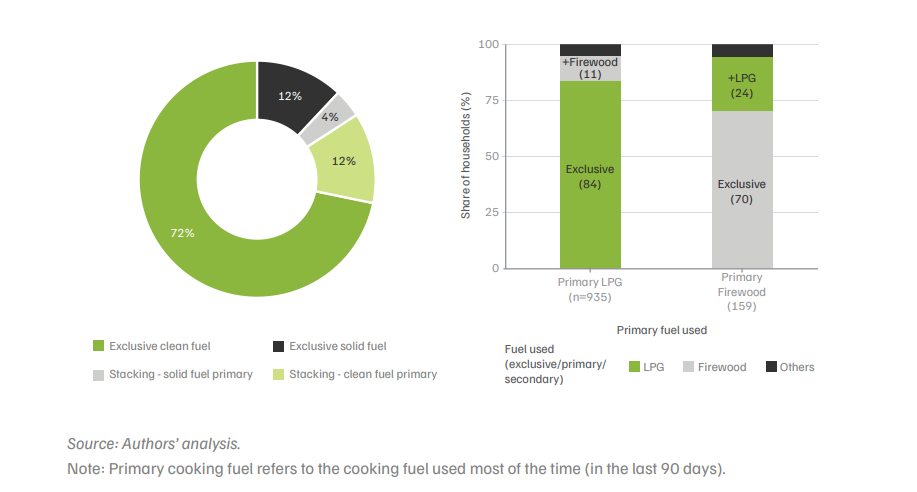
Our study reveals that 70 per cent of urban informal settlement households use LPG exclusively for their cooking purposes; 2 per cent use electricity (exclusively or as a part of their fuel mix); around 12 per cent rely on solid fuel exclusively for cooking; and the remaining households (16 per cent) display stacking behaviour with several combinations of clean and solid fuels (Figure ES1)
While LPG access is widespread among urban informal settlement households, two important challenges persist:
Figure ES1. About 16% of urban informal settlement households use a mix of clean and solid cooking fuels (fuel-stack)
Affordability and documentation constrain the adoption of/exclusive usage of clean cooking fuels
Cost remains the most consistently cited barrier to adopting clean cooking fuels, and its burden falls disproportionately on the low-income households.
Documentation requirements present another barrier: 31 per cent of informally connected users reported that they were denied a formal LPG connection because they did not have the documents required such as proof of identity, proof of address (present address in the city), ration card and bank account details. Another 50 per cent who use informal LPG connections say they cannot afford the installation costs of a formal connection.
The eligibility criteria of the PMUY are women (1) aged 18 years or older, (2) possessing a ration card, (3) holding an Aadhaar card, and (4) not already being a PMUY beneficiary or having a formal connection from an oil marketing company (OMC). Around 13 per cent of respondents are eligible for PMUY but remain unenrolled, representing a significant and addressable policy gap. Notably, 40 per cent of respondents (445 respondents) reported receiving subsidy against their refill and showed markedly higher rates of exclusive use of clean fuels; 83 per cent of subsidy recipients were exclusive users of clean fuels, demonstrating that affordability is a crucial barrier to the sustained usage of LPG. Additionally, income irregularity can be a relevant factor in the pattern of cooking fuel use as 47 per cent of the total households are engaged in the informal sector and exclusive use of solid fuels for cooking is highest among this population (20 per cent of the informal workers). Households engaged in the informal sector also show comparatively more fuel stacking behaviour (21 per cent), a higher share than other income groups such as formally employed, self-employed households or households running on passive income.
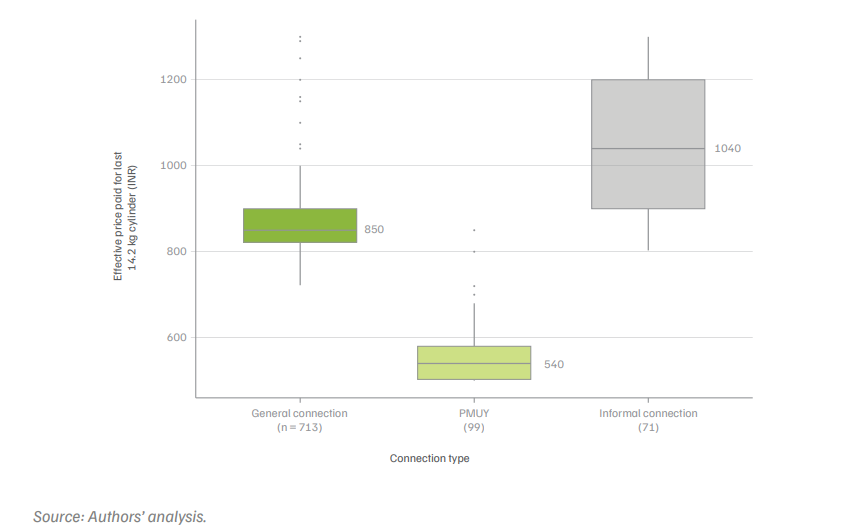
Figure ES2. The price paid by respondents using an informal LPG connection is the highest at INR 1,040, paying a premium of INR 190 per cylinder
Urban informal settlement dwellers’ willingness to pay reveals their affordability issue.
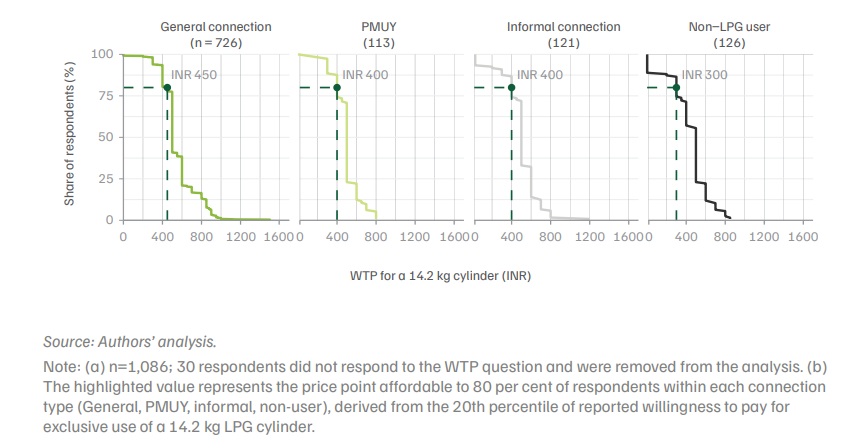
The WTP indicates stated preferences for domestic cylinder refill prices. To analyse WTP, households were asked the price they would be willing to pay for a 14.2 kgs LPG cylinder to transition to exclusive LPG use. Our study makes use of the ‘affordability limit’—a price point that would be affordable for 80 per cent of households to use LPG exclusively—calculated as the 20th percentile of the stated WTP for exclusive LPG use. In other words, if the price of LPG is at the given price point or lower, 80 per cent of surveyed respondents self-report that they will move to exclusive LPG use. Setting the inclusion threshold any higher would decrease feasibility from a fiscal standpoint (Figure ES3). Anchoring the analysis to a 80 per cent threshold instead centres the policy question on inclusion—at what price point does moving to exclusive LPG usage become viable for the vast majority of the urban informal settlement population.
We observe that the affordability limit varies by LPG connection types and non-users of LPG—INR 450 for general connection users, INR 400 for PMUY and users with no formal connection, and at INR 300 for non-LPG users.
Figure ES3. The affordability limit varies across different LPG user groups but 80% of the respondents are willing to use LPG exclusively at INR 400
Ease documentation requirements.
Documentation requirements remain a primary structural barrier: 31 per cent of households without a formal LPG connection were denied LPG due to insufficient paperwork. To obtain a formal connection from an OMC, customers are typically required to present proof of identity, proof of address, ration card and bank account details (as per PMUY eligibility criteria). As many informal settlement dwellers live in non-notified slums, they may lack legal recognition of their residence. This can pose a challenge when providing the required proof of address when applying for a formal LPG connection.
The OMCs and distributors could provide additional assistance to households from informal settlements with the documentation process to obtain a formal LPG connection. Periodic enrollment drives could be introduced to reach the remaining households in urban informal settlements that do not use LPG or use LPG without a formal connection.
Strengthen last-mile delivery infrastructure.
Along with documentation, it would be equally important to bridge the delivery gap, as informal users are far less likely to receive doorstep delivery (21 per cent) than general connection holders (78 per cent). Strengthening the accountability of last-mile distributors would directly improve the reliability of supply for newly formalised households.
Stronger last-mile delivery infrastructure as a supply-side intervention by exploring a differentiated distributors’ commission model for home delivery (Kar et al. 2024) could meaningfully extend reach to hard-to-access households that currently rely on informal channels by necessity.
Design subsidies to reflect actual affordability thresholds.
The upfront refill cost still remains a barrier, especially for low-income households. When asked to choose between interventions, more respondents preferred a reduction in upfront cost compared to buy now pay later option (56 per cent versus 41 per cent), suggesting subsidies at the point of purchase could address the irregular income cycles, liquidity constraints, and present bias among the households. Deferred payment alternatives can still play a complementary role, particularly for households that prefer to smooth costs over time or face liquidity constraints that make lump-sum payments at the point of purchase difficult.
To ease liquidity constraints and break down payment cycles, households can leverage India’s digital public infrastructure (DPI) to use mobile phone-based microsavings and make micropayments towards LPG distribution systems. In addition, smaller cylinder sizes—5 kg and 2 kg, used by 11 per cent of respondents—should be incentivised as an affordable and flexible entry point for the sustained adoption of clean fuels.
Build pathways beyond LPG.
Currently, adoption of PNG and electric cooking is negligible in the sample: no one reported using PNG, and only 2 per cent of respondents use electric cooking. The WTP for the two alternative fuels ranges between INR 250—500 per month for PNG and INR 100—300 per month for electric cooking, reflecting that a latent demand exists.
City-level pilots covering urban informal settlement areas should be prioritised in areas with a stable electricity supply and an existing LPG user base. For alternatives like biogas, a lack of space and lack of access to feedstock can impede uptake of such a technology in urban informal settlements. Additionally, there is also a lack of proper infrastructure to support piped gas connections in informal settlements (Mathur 2026). Electric cooking remains one of the viable options in such a setting and the households can be provided with a choice of e-cooking capital subsidy to PMUY customers to add electric cooking as part of their clean cooking stack, rather than substituting LPG completely with electric cooking. A significant share of respondents report safety concerns around electric appliances and perceive electricity as too expensive. City-level pilots that combine subsidised induction cookstoves with targeted behaviour change communication (BCC) interventions would help address both financial and informational barriers simultaneously. Initial deployment should target existing clean fuel users who demonstrate the highest WTP and require the smallest behavioural shift, followed by scaling the intervention to households currently dependent on solid fuels.
Fostering an environment in which households can realistically transition to clean cooking fuels requires addressing challenges to access, adoption, and usage. The government needs to move beyond only supplying connections for clean fuels to solutions that incentivise consumers and account for behavioural changes for sustained and exclusive use of clean fuels
Globally, access to clean cooking fuels has improved— from about 64 per cent of the population in 2015 to 74 per cent in 2023. Yet, nearly 2.1 billion people rely on polluting solid fuels—such as charcoal, coal, kerosene, firewood, and agricultural waste—for cooking (IEA, IRENA, UNSD, World Bank, WHO 2025).
Using these fuels for cooking causes household air pollution (HAP) and other negative externalities on health and the environment (Kar et al. 2019). Burning solid fuels releases pollutants like carbon monoxide, nitrogen oxides, and fine particulate matter (PM) (UNEP 2021).
PM2.5 in such a setting can exceed WHO recommended levels by 100 times (WHO 2025). Additionally, approximately 50 per cent of ambient PM2.5 is attributable to HAP that reaches outdoor air, making HAP a major contributor to ambient pollution (Chowdhury et al. 2023; McDuffie et al. 2021). In 2023, HAP accounted for over 9 lakh deaths, one of the highest attributable to a single source (SoGA 2025). Diseases attributable to air pollution also affect the country’s economic growth by reducing productivity, decreasing labour supply, and increasing health-care expenditure. As the consequences extend well beyond the household, to improve household health and national ambient air quality reduction efforts in India, households must transition from solid fuels to cleaner alternatives, like electricity, piped natural gas (PNG), and liquified petroleum gas (LPG).
India has made significant strides in expanding access to clean cooking—especially over the past decade—through the PMUY, which extended LPG connections to over 105 million women (PPAC 2026) from economically deprived households, which face the double burden of higher adult mortality rates and lower household income and consumption, finds a study (Dhakad et al. 2023) that uses data from the India Human Development Survey (IHDS). However, 37 per cent of households still rely primarily on polluting solid fuels—reflecting persistent challenges with affordability, access, and sustained usage (NSS 79th Round 2023).
In 2022, 41 per cent of the country’s urban population (203 million) lived in informal settlements (UNHabitat 2024). In the clean cooking transition in India, urban informal settlement households represent a particularly underserved and understudied population. However, despite their scale and distinct socioeconomic and household characteristics, urban informal settlement households have received limited attention in the energy access literature (Jha et al. 2021): most studies focus on rural populations or broader urban samples that fail to capture the specific constraints faced by households in informal settlements.
Across urban informal settlements in six major Indian states—Bihar, Uttar Pradesh, Rajasthan, Madhya Pradesh, Jharkhand, and Chhattisgarh— approximately 86 per cent of households possessed an LPG connection in 2021; despite high connectivity, however, only 55 per cent of these households use LPG exclusively for cooking, found a CEEW study (Jha et al. 2021). Sustained usage is low—due to the high cost of refills, delays in home delivery of refills, and cultural preferences—indicate several reports by CEEW and the Press Information Bureau (MoPNG 2024; Mani et al. 2021; Kar et al. 2024).
Several studies discuss the need to make LPG affordable. However, in recent years, little research has been conducted on the ground on what price point or price range is acceptable for the primary or exclusive use of gas, especially for alternative clean cooking fuels such as PNG or electricity. The increase in the push for PNG (Kalyanaraman 2026) has also created the need to assess the current levels of awareness and affordability—capital costs and recurring fuel costs— for PNG in urban areas.
Information needs to be gathered on current access and affordability parameters and on informal settlement household expectations regarding the transition to gas (LPG or PNG) and electricity for cooking. However, no recent study provides insight into these aspects. Therefore, this study aims to answer three questions:
1. What fuel (or fuel combinations) do households in informal settlements use for cooking?
2. How much are households in informal settlements willing to pay to use LPG as an exclusive fuel5 ?
3. What challenges and enablers influence the choice of cooking fuel use for urban informal settlement households?
In India, households in informal settlements choose clean cooking fuels based on affordability, willingness to pay, demographics, income, education, and cooking preferences. We designed this study to investigate these factors, which influence the uptake and sustained use of cleaner cooking fuels among Indian households in informal settlements.
Sampling
We conducted the survey across 10 cities. For the methodology, we deployed convenience sampling.
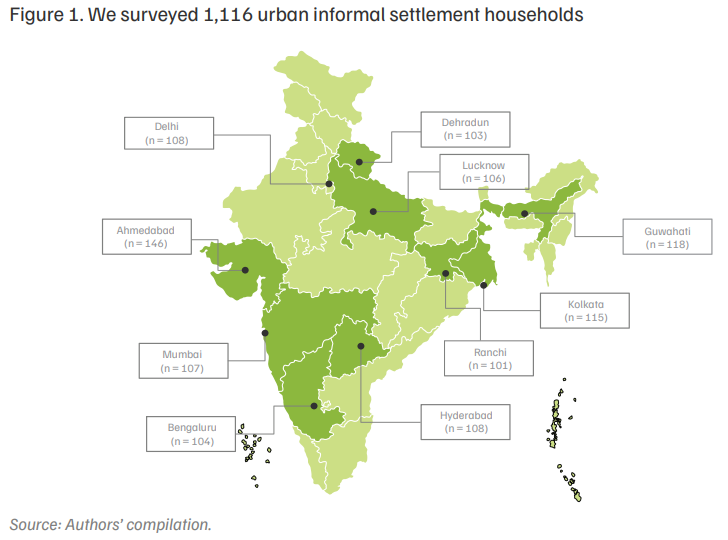
We selected six state capitals: Guwahati (Assam), Ranchi (Jharkhand), Mumbai (Maharashtra), Hyderabad (Telangana), Lucknow (Uttar Pradesh), and Dehradun (Uttarakhand). To identify the six states, we borrowed the sampling methodology from a similar CEEW study (Kar et al. 2024), and we used each state’s stage of transition to LPG (as a clean cooking fuel), which is reflected in the composite index that is derived from
1. alternative fuel availability (share of area with above-ground biomass);
2. affordability (per capita net state domestic product);
3. awareness (share of households using clean fuels); and the
4. bandwagon effect (average LPG consumption per person).
The composite index captures the state’s propensity to adopt clean cooking fuels. We divided the states into six groups ranked in order of the index. To select one state from each of the six index-ranked groups, we used purposive sampling.
We selected four other large metropolitan cities with high population density: Delhi, Bengaluru, Ahmedabad, and Kolkata.
Households in urban informal settlements are clustered in small areas, and there is no inventory; therefore, in each city, we selected four wards from the north, south, east, and west, and we selected 25 households from each ward to interview. Additionally, to ensure representativeness among respondents facing increased exposure risks such as pregnant women and children, we instructed the survey team in each city to prioritise households with pregnant women or children under five. Exposure to indoor air pollution affects the health of pregnancies and PM2.5 exposure from solid fuel burning has the strongest consequence for poor health among infants/young children (UNICEF 2025). Also, our inclusion criteria for the survey are respondents who are:
1. not living in temporary accommodation;
2. living in their accommodation for the past six months;
3. planning to live in their accommodation for the successive 12 months; and
4. the primary cook, responsible for preparing all meals.
Across the 10 cities, we interviewed 1,1166 urban informal settlement households in total (Figure 1). The respondent profile comprises primary cooks only.
The coverage in this study of the country’s largest cities, at varying stages of transition to clean cooking fuels—together with capitals drawn from geographically diverse states—provides an indicative picture of urban informal settlement households across India.
Questionnaire design and data collection
The questionnaire has sections on
1. household demographics, including the details of household head and the primary cook;
2. an assessment of household assets and income sources; and
3. an extensive evaluation of cooking fuel practices.
We explored usage patterns, costs, and preferences for various fuels—LPG, PNG, electricity, firewood, coal, and cow dung cake—and also logistical details such as cylinder refill history, government subsidy awareness, preference for financial schemes, etc.
After we developed the questionnaire, we handed over the data collection to Sigma Research and Consulting, the survey agency, which secured approval for compliance with ethics from the Institutional Review Board (IRB) (IRB Number 10021/IRB/24-25). Through SurveyCTO, we deployed collaborative development of the Computer-Assisted Personal Interviewing (CAPI) system, integrated with the survey logic and the final survey tool.
A team of more than 60 trained enumerators conducted in-person interviews in seven languages —Hindi (in Delhi, Uttar Pradesh, Uttarakhand, and Jharkhand); Telugu (in Telangana); Assamese (in Assam); Marathi (in Maharashtra); Kannada (in Bengaluru); Gujarati (in Ahmedabad) and Bengali (in Kolkata). The data collection commenced in September 2024 and ended in January 2025.
Data quality and limitations
During data collection, multiple biases—recall bias, social desirability bias, enumerator bias—can occur in a self-reported survey. The limitations of this survey are self-reported data and associated biases, geographic generalisability, and price sensitivity. To minimise such errors and ensure that the standards of analysis and data are high, we conducted numerous rounds of quality checks at various stages of the survey.
Self-reported data and associated biases
As with all survey-based studies, the findings are subject to biases inherent in self-reported data.
Recall bias may affect the accuracy of reported fuel expenditure and usage frequency, particularly among households that use multiple fuels intermittently. To minimise this, expenditure questions were framed around a short, fixed reference period—the preceding 90 days or the most recent purchase—which has been shown to improve accuracy compared to longer recall windows.
Social desirability bias may have led some respondents to over-report clean fuel use or understate reliance on solid fuels, given that clean cooking is perceived to be socially acceptable.
Additionally, hypothetical bias—respondents tend to report a different WTP amount than they would demonstrate in practice—is a limitation of stated preference WTP studies that is well documented (Ebert et al. 2025).
Geographic generalisability
The study covers 10 cities in India. We selected the cities to represent the regional diversity in the country. Our selection ensures breadth of coverage. However, given that each city contributes approximately 100 households to the sample—insufficient to recognise broad patterns among households in informal settlements—rather than being nationally representative city-level findings are indicative, in nature.
Price sensitivity can vary
Our WTP estimates are sensitive to the economic and market conditions prevailing at the time of the survey —LPG prices, subsidy levels, and household income. As these conditions change—given, particularly, the volatility of LPG prices—the affordability thresholds reported may not hold over time. Further, WTP can vary significantly by season, income shock, and local availability of fuels.
Additionally, and since median values are less affected by extreme outliers and therefore provide a better sense of central tendency, we make use of median values for most of the critical variables in the study.
While analysing WTP data points, we use winsorisation7 to handle extreme outliers and cap values at INR 800 for PMUY customers and at INR 1,500 for respondents using general, informal, or nonLPG users.
We look at the fuel usage pattern of households living in urban informal settlement areas across the 10 cities. Along with fuel usage patterns we try to understand the demographic characteristics distinct to urban informal settlement households, their historical prices paid for LPG refills, and preferences for various fuels —LPG, PNG, electricity, firewood, coal, and cow dung cake; along with factors that drive these choices.
Demographic characteristics
The respondents to this survey were primary cooks only. About 91 per cent of respondents are women, showing that the labour of domestic cooking is gendered. Further underscoring household vulnerability is the presence of at-risk members: one in three households (33 per cent) had at least one child aged 0–5 years and 5 per cent reported a pregnant woman in the household. Both groups are disproportionately affected by indoor air pollution, from the use of solid cooking fuels, due to higher exposure from being indoors most of the time (Ali et al. 2021).
Table 1. 43% of the respondents belonged to ST/SC category and 52% belonged to BPL households
| Categories | Count (n) | % | |
|---|---|---|---|
| Social category | General | 314 | 28 |
| ST/SC | 477 | 43 | |
| OBC | 308 | 28 | |
| Don’t know | 17 | 2 | |
| Ration card type | BPL (Below Poverty Line) | 575 | 52 |
| APL (Above Poverty Line) | 146 | 13 | |
| PHH (Priority Households) | 51 | 5 | |
| AAY (Antyodaya Anna Yojana) | 67 | 6 | |
| Don’t know/NA | 274 | 25 | |
| Others | 3 | 0 | |
Source: Authors' analysis.
In terms of housing features, 61 per cent of respondents owned their place of residence, 33 per cent were renters, and 4 per cent lived in highly precarious conditions such as footpaths or open spaces. The median monthly rent among renting households was INR 2,500. Socioeconomic vulnerability is also reflected in ration card status, as 52 per cent of respondents held a Below Poverty Line (BPL) card.
Scheduled Tribes and Scheduled Castes (ST/SC) comprised the largest caste group at 43 per cent, followed by General category (28 per cent) and Other Backward Classes/OBC (28 per cent) (Table 1).
Kitchen infrastructure is a concern. Across the sample, 77 per cent8 of households had an indoor kitchen but 6 per cent cooked outdoors and 20 per cent lacked dedicated cooking space. Similarly, ventilation is inadequate in a significant share of households: 21 per cent had no ventilation or platform features though 71 per cent reported having a window or door in their cooking area (Table 2).
Table 2. 20% lacked any dedicated space for cooking and 21% do not have any ventilation feature in their cooking spaces
| Categories | Count (n) | % | |
|---|---|---|---|
| Settlement type | Owned the place | 686 | 61 |
| Rented the place | 373 | 33 | |
| Open spaces/footpaths | 43 | 4 | |
| Others | 14 | 1 | |
| Kitchen features | Indoor space for cooking | 828 | 74 |
| Outdoor space for cooking | 40 | 4 | |
| Both indoor and outdoor space for cooking | 26 | 2 | |
| No separate space for cooking | 222 | 20 | |
| Ventilation features | Have at least one of the following in cooking space: Chimney, ventilator, exhaust fan, window/ door, slab/platform | 879 | 79 |
| No ventilation features in cooking space | 237 | 21 | |
Source: Authors' analysis.
We make use of an asset index based on household features to gauge household wealth. The index contains data on settlement and assets owned: fan, cooler, AC, smartphone, room heater, TV, bicycle, car, fridge, inverter, if household members had used a digital payment platform in the preceding month, or if there was a separate cooking space, or if there were ventilation features in cooking spaces.
For our analysis (see Annexure), we use principal component analysis (PCA), and we divide the PCA scores into quintiles (five equal groups).
Fuel use patterns and stacking behaviour
The penetration of LPG is high across the 1,116 households surveyed in urban informal settlement areas. Around 70 per cent use LPG exclusively for cooking purposes and 12 per cent use LPG alongside firewood (Figure 2).
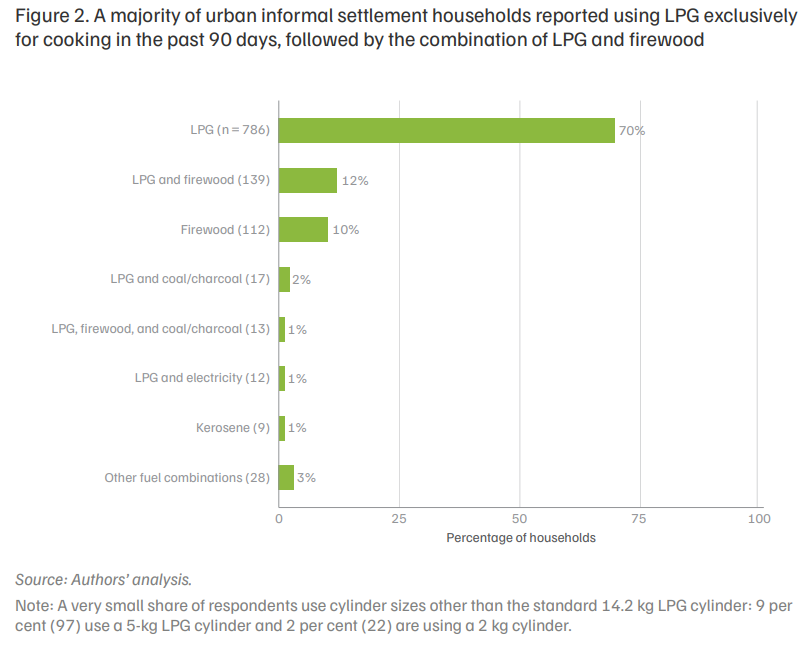
Those who depend on solid fuels to meet their cooking needs predominantly use firewood. Fewer than 5 per cent of respondents reported using polluting fuels like coal/charcoal, kerosene, or cow dung as part of their cooking fuel mix. Additionally, 2 per cent of households use electricity for cooking either exclusively or along with LPG.
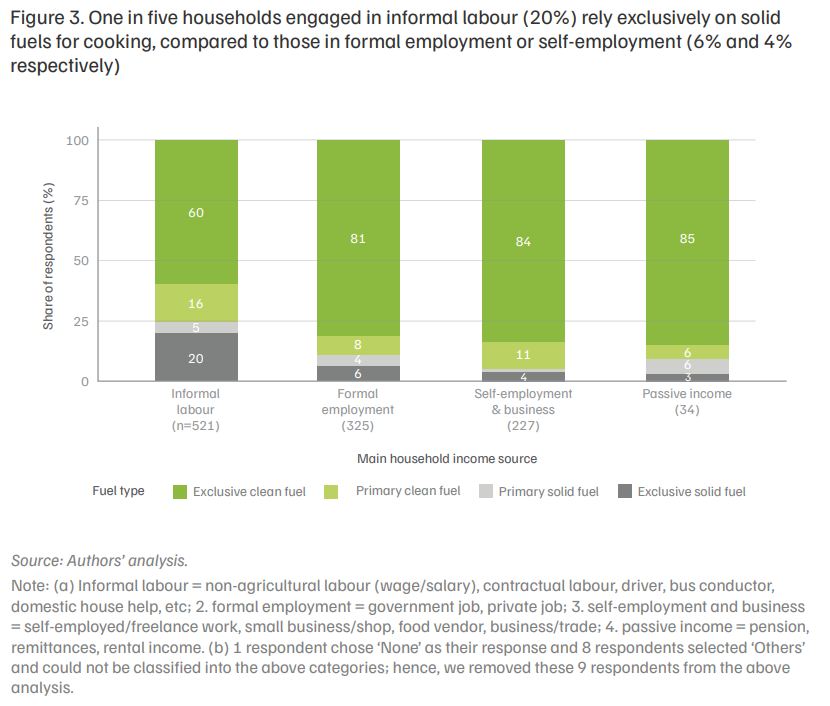
In urban informal settlement households, 16 per cent of the total respondents use clean cooking fuel (mostly LPG), either primarily or secondarily, along with other solid fuels, reflecting a pattern of fuel stacking. Households that stack LPG with solid fuels cannot realise the full health benefits associated with reduced HAP (Gould and Urpelainen 2018).
Exclusive use of solid fuels was highest at 20 per cent among informally employed households, compared to formally employed households (6 per cent) and selfemployed households (4 per cent). Among informally employed households, fuel stacking is about 21 per cent, reflecting the irregular nature of informal-sector income, which can make the upfront and sustained costs of clean cooking fuels difficult to absorb (Figure 3).
About 40 per cent (445 respondents) of respondents reported receiving a subsidy against their last LPG refill; 31 per cent of this group are from the bottom 2 wealth quintiles. Among the respondents who did not receive any subsidy, 34 per cent fall in the bottom 2 wealth quintiles. This points to a possible target gap as we would expect a larger proportion of bottom quintile households among recipients of subsidy but the proportion of poorer households are similar across both recipients and non-recipients of subsidy.
What type of connection do LPG users have?
Access to LPG is mostly formal: 66 per cent of households have a general LPG connection;9 of which 50 per cent have a connection from Indian Oil Corporation Limited (IOCL), 32 per cent have one from Bharat Petroleum Corporation Limited (BPCL), and 18 per cent have one from Hindustan Petroleum Corporation Limited (HPCL).
A smaller but notable share (10 per cent) hold connections under the PMUY. Meanwhile, 11 per cent of respondents reported not having a formal LPG connection, showing that urban informal settlements still lack access to a formal LPG connection and buy LPG from unauthorised sources (Table 3).
Table 3. Informal LPG connections are used in 11% of urban informal settlement households
| Categories | Households (%) |
|---|---|
| General connection (n=738) | 66 |
| PMUY connection (113) | 10 |
| No formal connection (125) | 11 |
Source: Authors' compilation.
Note: n=976; 140 respondents (13 per cent) do not use LPG.
Those without a formal connection were far less likely to benefit from doorstep delivery; only 21 per cent reported that their distributor delivered LPG cylinders to their home, and 57 per cent sourced their cylinders from unauthorised kirana stores or informal markets, highlighting a stark contrast to households with general connections, among whom as many as 78 per cent received home delivery. This gap in access to delivery shows that the supply of clean fuel is neither reliable nor convenient. In addition, respondents without a formal LPG connection pay INR 190 more per 14.2 kg domestic cylinder compared to a general connection user. (Figure 4).
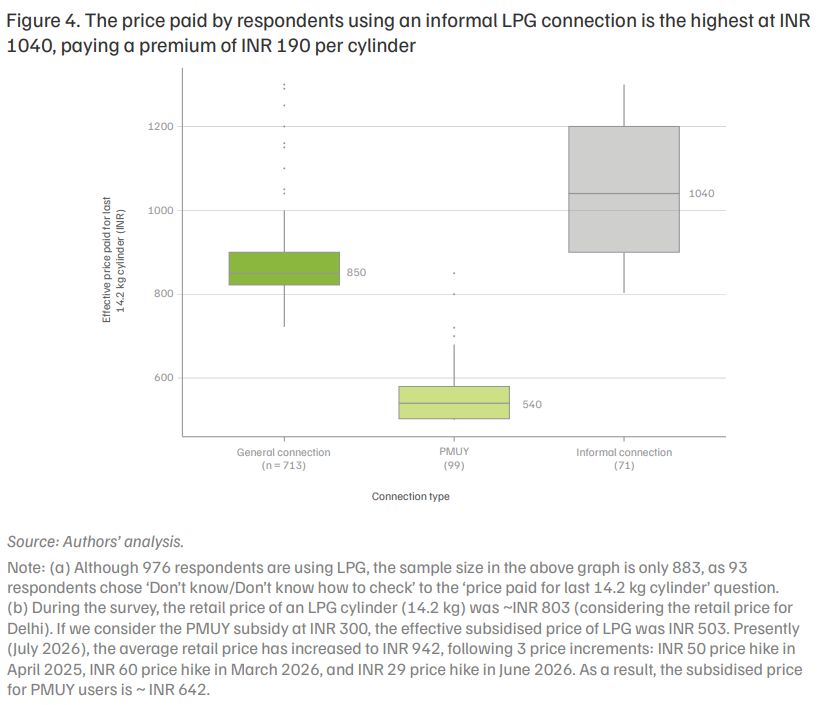
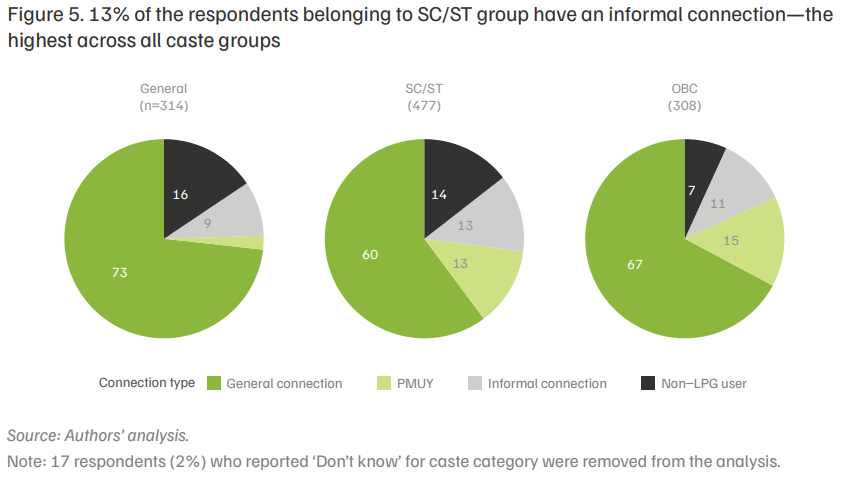
Informally connected users source their cylinders from outside regulated channels, forgoing access to government subsidies and doorstep delivery; as a result, they pay more for fuel supply that is less reliable. Also, as these households source their cylinders through unauthorised kirana stores or the grey/black market, bypassing standard safety and quality protocols. These households forgo access to government subsidies and doorstep delivery. The fuel supply is potentially hazardous and subject to concerns over safety and fuel quality. In addition, 13 per cent of SC/ST respondents have an informal connection, highest among the caste groups, followed by OBC (11 per cent) and the General category (9 per cent).
The eligibility criteria of the PMUY are women (1) aged 18 years or older, (2) possessing a ration card, (3) holding an Aadhaar card, and (4) not already being a PMUY beneficiary or having a formal connection from an oil marketing company (OMC). Only 10 per cent of the respondents hold a connection under the PMUY. However, when the remaining respondents were assessed, an additional 147 respondents (13 per cent) were found to be eligible to apply for a connection .
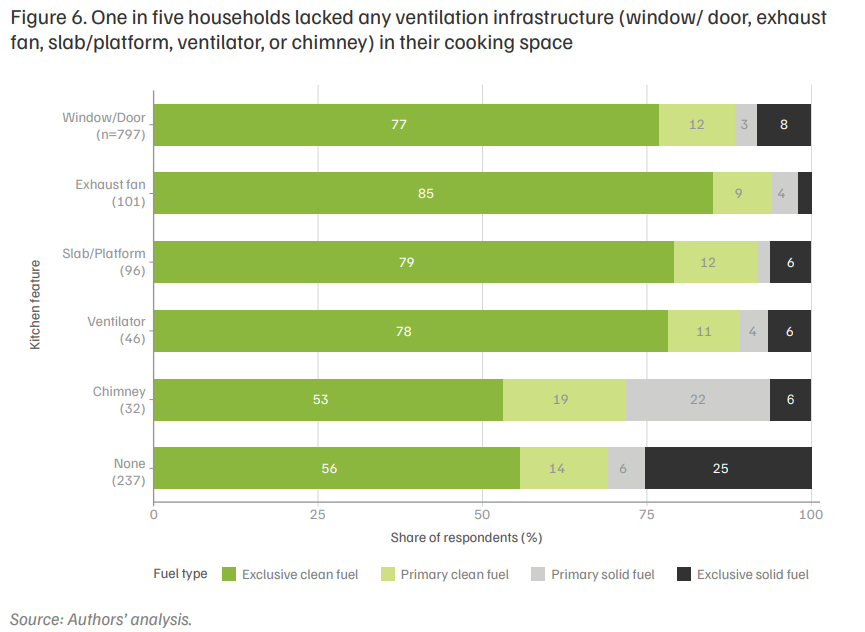
In addition to access to clean fuels, ambient cooking conditions can compound health risks. One such condition, inadequate ventilation, causes high levels of pollutant exposure and it impacts health negatively (WHO 2014). Ventilation plays an important role in the rate of removal of cooking-generated pollutants from the kitchen (Xu et al. 2024).
In this survey, we observed, 21 per cent of the respondents lack ventilation devices/platforms in kitchen spaces; of such cases, exclusive users of solid fuel account for 25 per cent, the highest proportion.
About 71 per cent have a window or a door in their kitchen space; only a few have an exhaust fan (9 per cent), ventilator (4 per cent), and chimney (3 per cent); and 20 per cent lack separate space for cooking, which can increase exposure for all the household members and not just the primary cook (Figure 6). This compounds the risks of exposure from both combustion of solid fuel and from poor ventilation, thereby heightening the risks of health problems. Given the health benefits of adopting clean cooking fuels and the concomitant improvements in the quality of life, it is all the more important to wean households away from polluting fuels (WHO 2021).
Perceptions about clean vs solid fuels
The availability of clean cooking technologies alone is not sufficient for a sustained uptake; evaluation of the technologies and removal of the barriers to adoption play an important role in sustained transition (Nerini et al. 2026).
Across all three clean technologies, cost emerges as the most pervasive barrier to the adoption of clean cooking fuels and sensitivity to price as a systemic challenge to transitioning: 78 per cent of respondents cited high cost as a barrier to adopting LPG; 50 per cent of those without a formal connection identified the expense of installation as a key deterrent to formalisation; 18 per cent of respondents flagged cost as a barrier to PNG adoption; and 75 per cent cited it as a barrier to cooking using electricity (Figure 7).
About 62 per cent of the households that report that the expense of installation is a barrier fall in the bottom 2 quintiles of the asset index. However, such perceptions might not reflect the true cost saving in the long run: a cost comparison study (Mani et al. 2026) reveals that operational expenditure for electric cooking is cheaper than unsubsidised LPG refills if the effective price of electricity does not exceed INR 7 per kWh. Overall, 58 per cent of informally connected users fall in the bottom 2 wealth quintiles.
Documentation requirements pose another structural barrier – beyond cost – to formal energy access. About 31 per cent of informally connected respondents reported having been denied a formal LPG connection because their documentation was insufficient. Unavailability and high cost are the most common barriers associated with the adoption of PNG. Perceptions of safety risks around cooking with electricity present an additional barrier to transitioning.
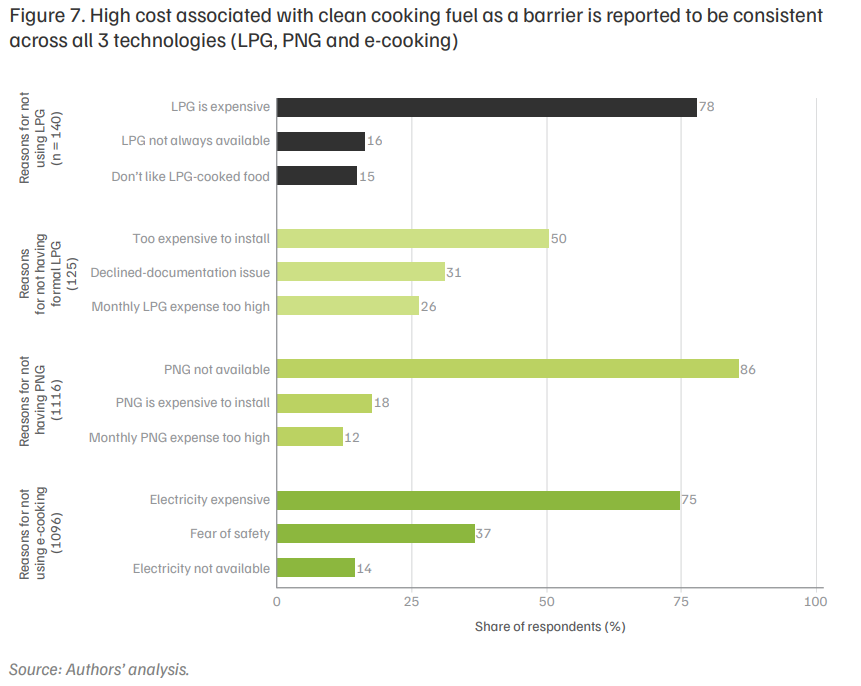
Especially in informal settlements, fear and concerns over cooking with electricity suggest that demand-side barriers are not purely financial but also a fallout of poor infrastructure and awareness. The illegal status of urban informal settlements prevent users from accessing formal connections, and households’ access to electricity often depends on illegal connections, informal resellers, and unsafe shared meters—all of which pose safety risks for the use of electric cooking (Khalifa et al. 2026). In addition, poorer households are disproportionately affected—among those without electricity access, 54 per cent fall into the bottom two wealth quintiles.
When examining reasons for not using solid fuels, limited availability emerges as the primary deterrent reported by 70 per cent of those who do not use firewood, 57 per cent of those avoiding coal, and 74 per cent of those not using cow dung. About 31 per cent of those who do not use firewood, 26 per cent of those avoiding coal, and 22 per cent of those not using cow dung reported a negative perception of solid fuels and associated health concerns. Respondents also acknowledged the time burden associated with using solid fuels for cooking (13 per cent for firewood, 11 per cent for coal, and 6 per cent for cow-dung).
Box 1. Variation in LPG usage among the 10 cities
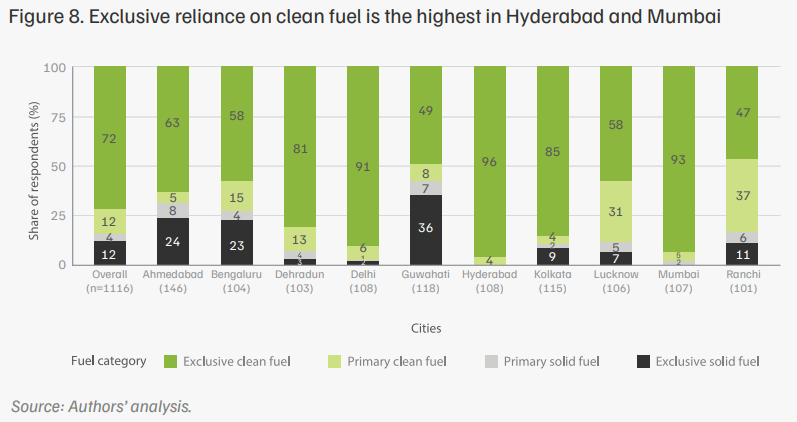
Usage of clean fuels vary by city (Figure 8). In Guwahati, about 36 per cent of the respondents rely on solid fuel exclusively, and only about 50 per cent use clean fuel exclusively. In Ahmedabad, more than 60 per cent use LPG exclusively, but 24 per cent still rely exclusively on solid fuels. The fuel stacking patterns are highest in Ranchi (43 per cent) and Lucknow (36 per cent). In these cities, LPG appears to function largely as a complementary fuel rather than a substitute for solid fuels, suggesting that access alone does not guarantee exclusive usage. These city-level differences may be shaped by a number of factors.
Ranchi has the highest share of PMUY connections among all cities studied (31 per cent) and also the highest fuel stacking; a pattern that is consistent with existing evidence that PMUY beneficiaries have lower odds of using LPG exclusively compared with general (non-subsidised) consumers, regardless of income status (Mani et al. 2020). Lucknow follows suit, with PMUY users at around 15 per cent (the third-highest among cities) and a higher share of the population relying on fuel stacking.
Notably, Delhi has the second-highest share of PMUY connections but comparatively low fuel stacking, pointing to city-specific enabling factors such as weaker access to free biomass. In Ranchi’s case, continued reliance on forest biomass at low prices may be sustaining stacking behaviour even where LPG connections exist (Sharma et al. 2023). Mumbai’s relatively high exclusive clean fuel use, by contrast, has been linked to LPG’s dominance as the primary fuel of choice among informal settlement households because of lower affordability issues (Chatterjee 2019).
State-level schemes may also play a role; for instance, Telangana’s Mahalakshmi scheme (Government of Telangana 2023) offers additional cylinder subsidies that could be contributing to Hyderabad’s stronger adoption of clean fuel. Together, these patterns suggest that connection access, local fuel availability, and state-specific subsidy design interact to shape whether households complete the transition to clean cooking fuels.
Demand for clean cooking fuels among households in informal settlements
Willingness to pay for exclusive LPG use
Before the GoI introduced the PMUY in 2016, several studies analysed the WTP for cooking fuels. Drawing on previous research and literature, a CEEW study (Jain et al. 2014) found that a typical Indian household would need to allocate 6 per cent of its total household monthly expenditure to cooking expenses, the threshold to be considered affordable for cooking energy expenditure.
A primary survey conducted by CRISIL (PPAC 2016) and drawing on data from over 1 lakh respondents determined the amount urban households were willing to pay for LPG. Their average WTP for LPG in 2016 was estimated at INR 313 per month for rural areas and INR 333 per month for urban areas. Citing this analysis, The Energy and Resources Institute (TERI) concluded that INR 313 per month would be the optimal price to boost the uptake of LPG refills (Palit et al. 2021).
A similar study (Chindarkar et al. 2021) found that PMUY households were willing to pay INR 372 per month for using LPG exclusively for cooking. For lowerincome households, the cost burden of cooking fuel is 7–10 per cent of their total monthly expenditure (Haider 2022).
This study considers the WTP for LPG for exclusive use. However, in contrast to previous studies, we estimate WTP for a single 14.2 kg cylinder rather than calculating it over a time period (such as a month— the amount households are willing to spend on LPG cylinders per month).
Willingness to pay for exclusive LPG use is the respondent’s stated preference collected as a continuous variable. It is not the respondent’s revealed preference, the WTP can vary from the historical price the consumer paid for the good or their willingness to accept value for the good—as a result of hypothetical bias associated with the nature of the survey, which in our case is a household’s WTP for using LPG cylinders exclusively (Ebert et al. 2025).
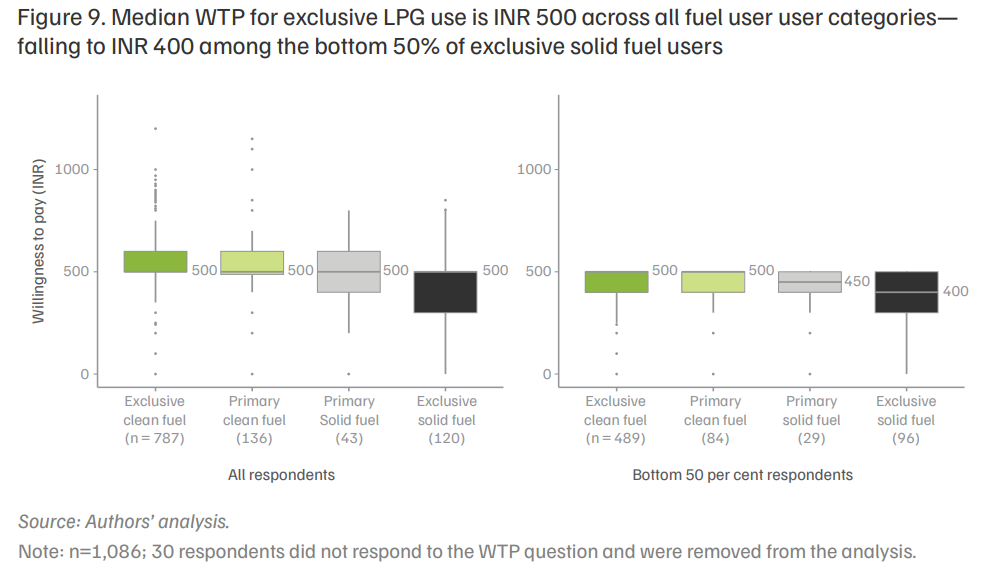
To analyse household WTP for exclusive LPG use, we asked households about the price they would be willing to pay for each 14.2 kg LPG cylinder to transition to using LPG exclusively: the median is INR 500 (Figure 9). The question was anchored to the number of cylinders they would need for exclusive usage of LPG in a year based on household size.
When we look at the bottom 50 per cent of each of the four categories of fuel user—exclusive clean fuel user, primary clean fuel user, exclusive solid fuel user, primary solid fuel user—primary solid fuel users are willing to pay INR 450 per cylinder and exclusive solid fuel users INR 400. This suggests that affordability is a greater barrier for those furthest from the clean cooking fuel transition. The respondents who quoted that they are not willing to pay for exclusive use of LPG are from the poorest strata (88 per cent are in the bottom 2 quintiles according to the asset index).
What price seems affordable for most respondents?
At the time of our survey, the price of an unsubsidised 14.2 kg LPG cylinder was INR 803, and the effective price for PMUY customers was INR 503.The current LPG price has soared following the West Asia crisis in 2026, and the market price is INR 942 per 14.2 kg domestic cylinder; as a result, the effective price for PMUY has increased to INR 642 with a subsidy of INR 300.
Notably, 40 per cent of respondents (445 respondents) reported receiving subsidy against their refill and who did receive a subsidy showed markedly higher rates of exclusive use of clean fuels; 83 per cent of subsidy recipients were exclusive users of clean fuels, demonstrating that affordability is a crucial barrier to the sustained usage of LPG.
Our study makes use of the ‘affordability limit’. It is a price point at which LPG refills would be affordable for 80 per cent of households to use it exclusively, calculated as the 20th percentile of the stated WTP for exclusive LPG use. Setting the inclusion threshold any higher would decrease feasibility from a fiscal standpoint. For 80 per cent10 of respondents, LPG becomes affordable only at INR 400, approximately INR 100 less than the effective price11 for PMUY customers (Figure 10). While 39 per cent of respondents quote a WTP of INR 401–500, around 3 per cent quote prices as low as INR 0–100; exclusive solid fuel users constitute 45 per cent of this lowest-tier group (Figure 11). The affordability limit is at INR 400 for holders of PMUY and informal connections and drops to INR 300 for those without an LPG connection (Table 4).
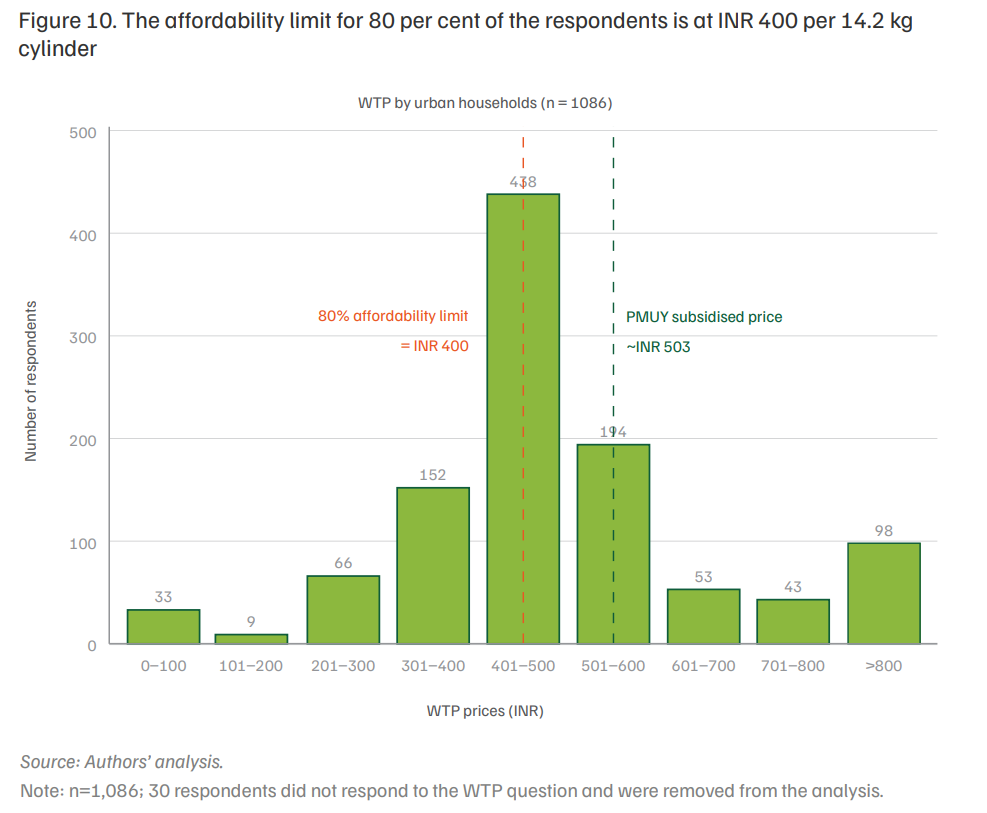
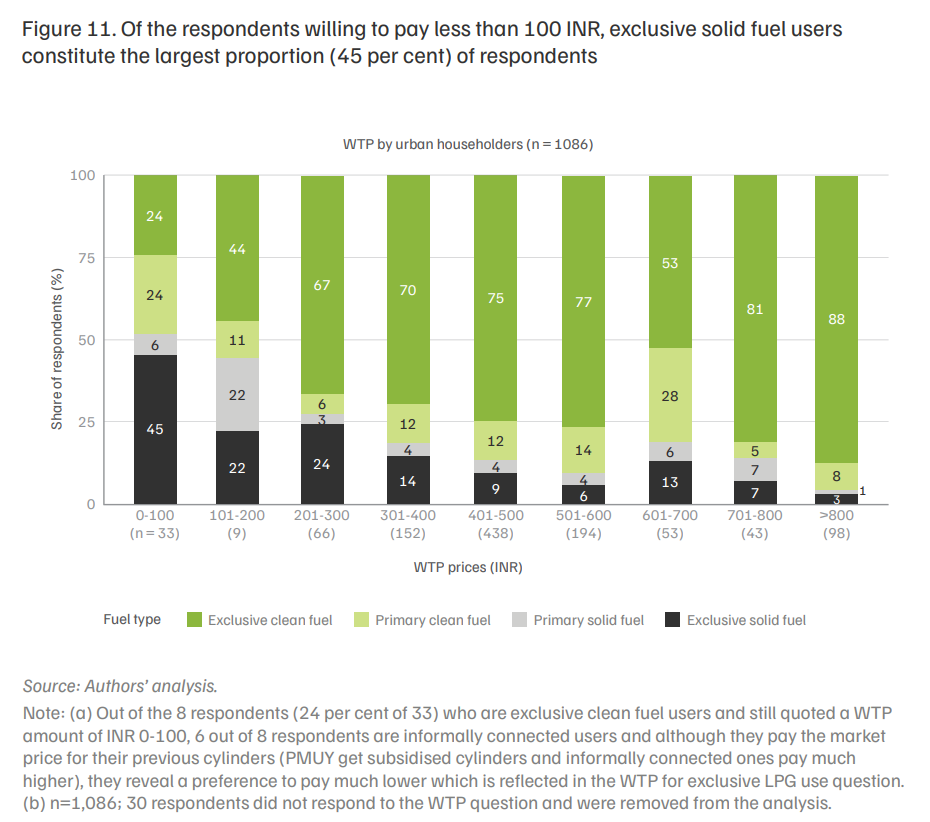
Table 4. Affordability limit (for >=80 per cent of the respondents) varies across different types of LPG connection users and non-LPG users
| Categories | Affordability limit (in INR) |
|---|---|
| General connection (n=726) | INR 450 |
| PMUY connection (113) | INR 400 |
| No formal connection (121) | INR 400 |
| Non-LPG users (126) | INR 300 |
Source: Authors' analysis.
Note: (a) n=1,086; 30 respondents did not respond to the WTP question and were removed from the analysis.
Willingness to pay for PNG and electric cooking
None of the respondents reported using PNG; 2 per cent use electric cooking devices, about 40 per cent of whom use induction cookstoves—reflecting that, in urban informal settlements, the penetration of alternative clean fuel technologies is limited. Also, the infrastructure required to support piped gas connections is not available in informal settlements (Mathur 2026). Despite this, the stated WTP for both fuels offers useful signals about latent demand.
Across all fuel user categories, monthly WTP for PNG is consistently higher than for electric cooking, at INR 250–500, compared to INR 100–300 for electric cooking (Figure 12).
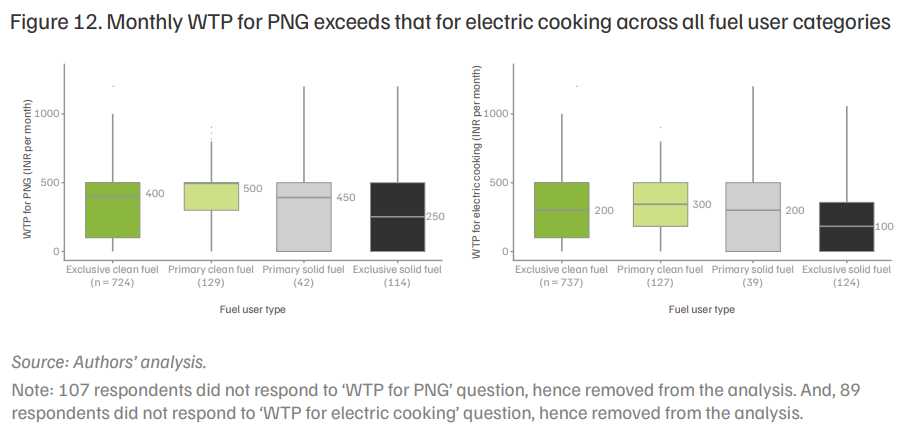
Exclusive users of solid fuels report the lowest WTP for PNG (INR 250) and electric cooking (INR 100); those who primarily use clean fuels report the highest WTP for PNG (INR 500) and for electric cooking (INR 300). The higher WTP for PNG likely reflects its resemblance to LPG in the cooking experience as both fuels are gas-based. On the other hand, electric cooking is underutilised, as the population perceives that it is expensive and that they are unfamiliar with electric cooking appliances (Leary et al. 2021).
Perceptions around schemes for LPG usage and how LPG can be made more affordable
To understand the consumer perspective, we asked them to predict how each scheme would affect their LPG consumption. To make LPG affordable and help to incentivise customers to increase uptake, the government has initiated three schemes: reduction in upfront cost; the ‘save and get’ scheme (prepaid); and the ‘buy now, pay later’ scheme (postpaid).
Reduction in upfront cost
The subsidy, applied directly at the point of sale, reduces the immediate cash payment required: for example, instead of paying INR 800 and receiving an INR 300 subsidy later, the customer pays only INR 500 upfront.
‘Save and get’ scheme (prepaid)
A savings-based model where households can make small, regular deposits (INR 100 per week, for instance) into a bank account. Once the accumulated savings are sufficient to cover the cost of a cylinder, the household purchase will be automatically deducted from the account.
‘Buy now, pay later’ scheme (postpaid)
The credit-based model allows households to acquire an LPG cylinder by paying, initially, a small fee and pay off the remaining balance in easy instalments—instead of having to make a lump-sum payment at the point of purchase.
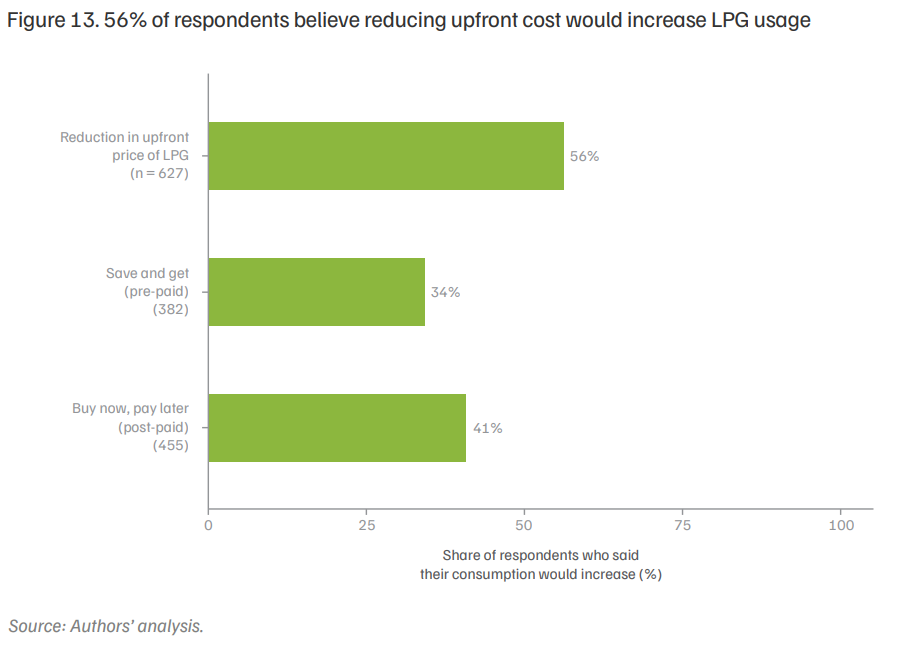
Most consumers prefer to reduce the cost of LPG upfront: 56 per cent report that adopting a scheme that reduces the upfront cost of LPG would increase their
Recommendations
Access to LPG is high (70 per cent use it exclusively), yet many (11 per cent) remain out of formal channels and resort to using informal cylinders; and access alone does not translate to a complete transition to cleaner fuels, as almost 16 per cent of households fuelstack. An increase in the sustained usage of cleaner fuels like LPG that lead to a complete substitution of solid fuels can only improve indoor air quality (WHO 2014).
Fostering an environment in which households can realistically transition to clean cooking fuels requires addressing challenges to access, adoption, and usage. The government needs to move beyond merely supplying clean fuels to solutions that incentivise consumers and account for behavioural changes. Based on our study, we make four recommendations.
Ease documentation requirements
Households relying on informal LPG markets need to be brought into the fold of formal LPG connections, as many may be eligible for PMUY or a formal connection but are not covered by it. Documentation requirements remain a primary structural barrier: 31 per cent of households without a formal LPG connection were denied LPG due to insufficient paperwork. As many of the urban informal settlement dwellers live in nonnotified slums, i.e., they may lack legal recognition of their residence, making the requirement for proof of address a challenge.
The OMCs and distributors could therefore provide additional assistance to households from informal settlements with the documentation and enrollment processes required to obtain a formal LPG connection. Additionally, periodic enrollment drives could be organised to reach households that either use solid fuels exclusively (13 per cent) or use LPG without a formal connection (11 per cent). This will ensure such households are not excluded from the formal LPG network.
Strengthen last-mile delivery infrastructure
Equally important is bridging the delivery gap (Kar et al. 2024), as informal users are far less likely to receive doorstep delivery (21 per cent) than general connection holders (78 per cent), forcing them towards less reliable and potentially hazardous sources. Strengthening the accountability of last-mile distributors would directly improve the reliability of supply for newly formalised households.
As a supply-side intervention exploring a differentiated distributors’ commission model for home delivery (Kar et al. 2024) could strengthen last mile delivery infrastructure—meaningfully extending reach to hard-to-access households that currently rely on these informal channels out of necessity. Infrastructure can be strengthened by promoting Common Service Centres (CSCs) as micro-distributors if there is no LPG distributorship nearby (Kar et al. 2024).
Design subsidies to reflect actual affordability thresholds
The PMUY subsidises LPG, but the subsidy level is insufficient: 80 per cent of users report INR 400 as their affordability threshold, but the effective PMUY price at the time of our survey was INR 503; the upfront refill cost still remains a barrier, especially for low-income households.
Consistent with intertemporal choice theory, interventions should shift towards point-of-purchase cost reductions: 56 per cent of respondents identify it as the most effective motivator for increasing LPG use; 34 per cent report their consumption would increase for a prepaid scheme and 41 per cent for a postpaid scheme. Applying subsidies at the point of purchase and supplementing these subsidies with deferred payments alternatives could address the irregular income cycles, liquidity constraints, and present bias of households.
To ease liquidity constraints and break down payment cycles, households can leverage India’s digital public infrastructure (DPI) to use mobile phone-based microsavings and make micropayments towards LPG distribution systems. The Ministry of Petroleum and Natural Gas and OMCs can help to implement micropayments; for instance, OMCs could partner with UPI-enabled payment platforms—Bharat Interface for Money (BHIM), PhonePe, Paytm—to let households make small, recurring contributions toward their next refill rather than paying the full refill amount of INR 800–900 in one instalment.
In addition, smaller cylinder sizes like 5 kg and 2 kg cylinders, used by 11 per cent of respondents— should be incentivised as an affordable and flexible entry point for the sustained adoption of clean fuels. For those who do not use LPG and report no WTP, price-based interventions alone are insufficient, and these must be accompanied by behaviour change campaigns.
Build pathways beyond LPG
Currently, adoption of PNG and electric cooking is negligible: no one reported using PNG, and only 2 per cent use electric cooking. The WTP (INR 100–500 per month) shows latent demand.
However, as demand falls below that for LPG, city-level pilots that combine subsidised installation costs for induction cookstoves with targeted BCC interventions would help address both financial and informational barriers simultaneously. Given that a significant share of respondents report safety concerns around electric appliances and perceive electricity as too expensive, BCC interventions are particularly important. Initial deployment should target existing clean fuel users who demonstrate the highest WTP and require the smallest behavioural shift, followed by scaling the intervention to households currently dependent on solid fuels.
Electric cooking remains one of the viable options in such a setting. PMUY customers could be offered a capital subsidy for electric cooking appliances, allowing them to add electric cooking to their clean cooking stack rather than substituting LPG completely with electric cooking.
The urban poor referred to in the study are households living in urban informal settlements. UN-Habitat defines "informal settlements" as households that lack secure tenure; neighbourhoods that are cut off from formal basic services and do not comply with housing/planning standards; and settlements that are often located in hazardous areas without municipal permits. It is broadly synonymous with slums, where households face one or more deprivations, according to UN-Habitat's operational definition: inadequate water, sanitation, living space, housing durability, or tenure security.
Yes, 70 per cent of households in urban informal settlements use LPG exclusively, and 16 per cent use it as part of their fuel mix alongside solid fuels. Despite high reliance on LPG cylinders, not all households procure it through formal channels – 11 per cent still rely on informal LPG cylinders for cooking.
Fuel stacking is when a household uses a mix of clean and unclean fuels for cooking – for example, LPG for some meals and firewood for others rather than using clean fuel exclusively. It matters because household air pollution exposure is driven by solid fuel use, so realising the full health benefits of cleaner cooking fuels like LPG requires exclusive use rather than just access to a cylinder.
No. General users who buy cylinders from official OMC distributorships pay the market price, which, around the time of the survey, was INR 850 (median), while informal users paid a median of INR 1040. Pradhan Mantri Ujjwala Yojana (PMUY) beneficiaries receive a subsidy of INR 300 and pay INR 540 (median).
Willingness to pay is the stated price point at which the respondent will switch to exclusive use of LPG (14.2 kg domestic cylinder). Exclusive usage is defined as twice the household size (two cylinders per person per year), which is based on a baseline cooking energy requirement of 3,500 MJ per year for an average 5-person household, or ~700 MJ/year per individual. We found that the median WTP is INR 500, but the range varies across different fuel user groups.
Inability to produce the required documents, high levels of informal use, high upfront costs, and lack of doorstep delivery are barriers to the exclusive use of LPG in urban informal settlements. Additionally, no respondents use PNG, and the lack of piped gas infrastructure in informal settlements makes the technology largely unavailable. A small share of households (2 per cent) use electricity for cooking (exclusively or as part of their fuel mix), and many cite cost as a barrier to adoption of electric cooking.
Unlocking Finance for India’s Textile Waste Management
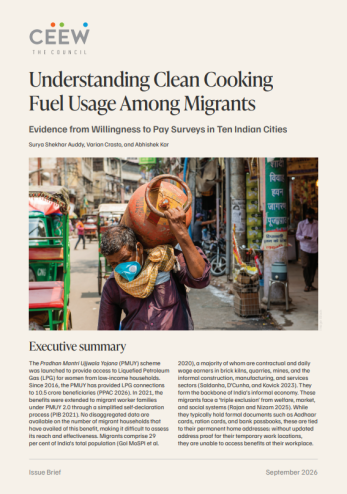
Understanding Clean Cooking Fuel Usage Among Migrants