Council on Energy, Environment and Water Integrated | International | Independent
Jain, Abhishek, Wase Khalid, and Shruti Jindal. 2023. Decentralised Renewable Energy Technologies for Sustainable Livelihoods: Market, Viability, and Impact Potential in India. New Delhi: Council on Energy, Environment and Water.
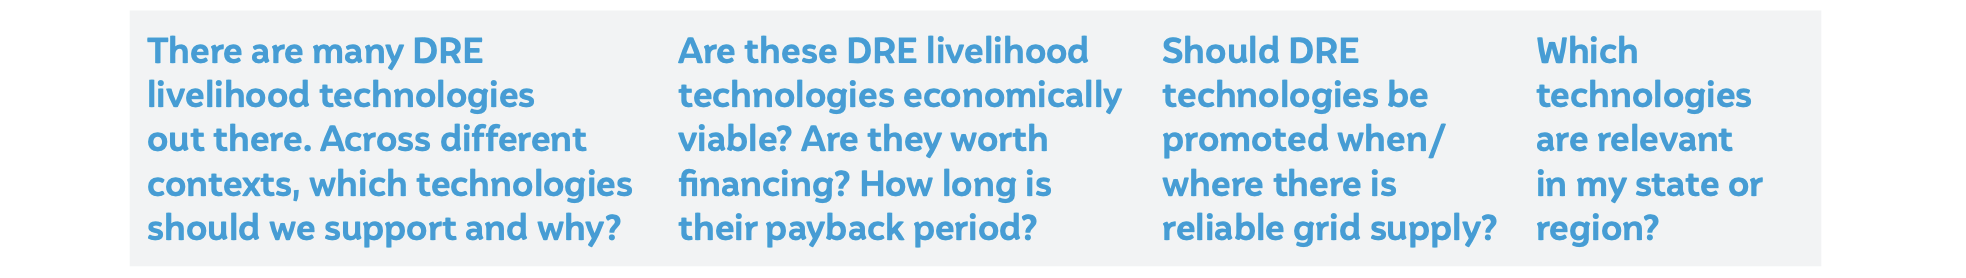
Key stakeholders are now starting to recognise the potential of using decentralised renewable energy (DRE) technologies such as dryers, silk-reeling machines, vertical fodder grow units, and others to transform India’s rural economy. But several questions on their market potential, viability and impact are also emerging. As part of the Powering Livelihoods programme, this study examines and answers these questions that are emerging as the sector is in its nascent stage while also evolving rapidly. The questions from stakeholders such as government officials, philanthropic funders, investors, financiers, think tanks, incubators, entrepreneurs, and users include the following:
DRE livelihood technologies provide a significant opportunity to impact tens of millions of livelihoods across the country. The study recommends that sector stakeholders must extend context-specific support to mainstream DRE livelihoods while appreciating the relative impact potential and the factors guiding the financing, business, and stakeholder engagement models.
India needs to generate 90 million jobs by 2030 (Sankhe et al. 2020). Simultaneously, it needs to rapidly transition its economy to a low-carbon and resilient one, in line with the national commitments on climate action. While deploying large-scale renewables and transitioning to green hydrogen will create more jobs, these will not be sufficient to productively engage the more-than-a-million additional youth reaching employable age every month (Mallapur 2018). We need much more entrepreneurship, livelihood opportunities, and jobs that are economically rewarding, environmentally sustainable, and socially equitable.
One solution to increase livelihood opportunities is to power microenterprises across India through clean energy. Energy-efficient technologies powered by decentralised renewables can help enhance the incomes and resilience of many of India’s more than 60 million microenterprises while fostering climate action (MoMSME 2022). Recognising the unique opportunity that such DRE–based livelihood technologies pose, the Ministry of New and Renewable Energy, Government of India, released a dedicated policy framework titled Framework for Promotion of Decentralised Renewable Energy Livelihood Applications (MNRE 2022).
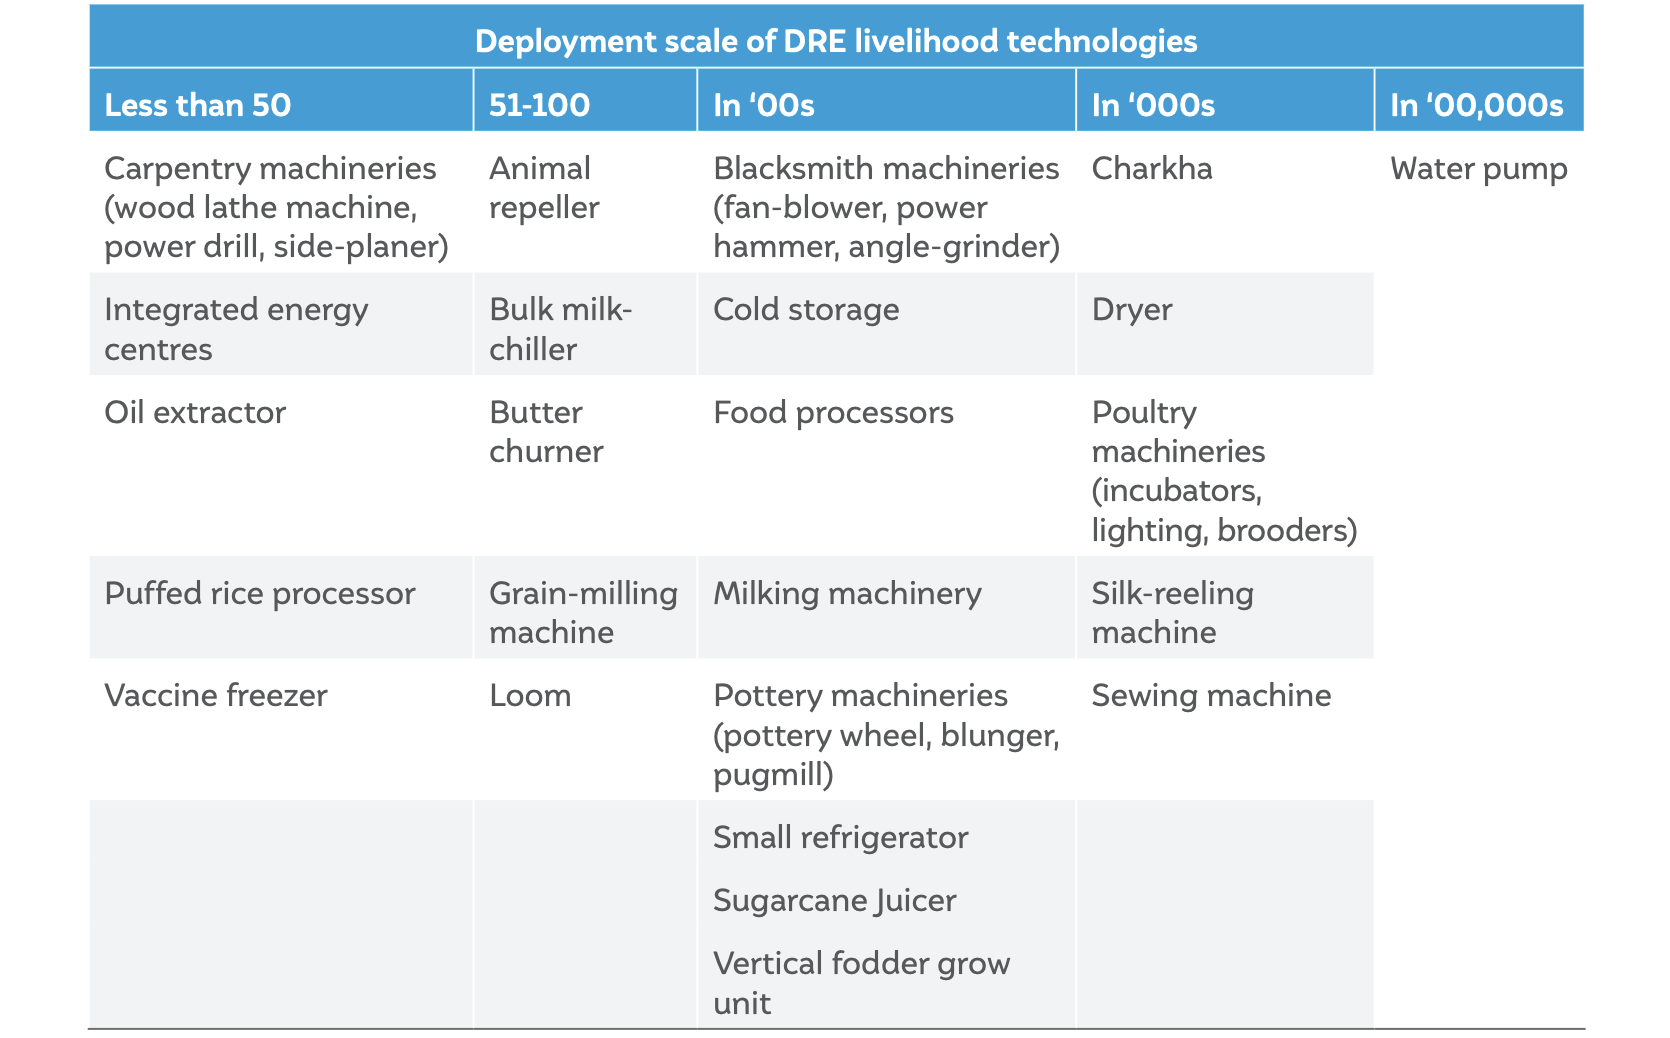
In recent years, many livelihood technologies have emerged that are highly energy efficient and designed to run with DRE sources, from solar-powered looms and charkhas to solarpowered cold storages, solar dryers, and solar-powered vertical fodder grow units (SELCO 2021). While many of these technologies are already being sold commercially, some are being supported via grants and philanthropy to enable adoption among end customers. Others are in development or being tested under technical pilots. Based on our mapping of these technologies, Table ES1 presents the broad landscape of DRE livelihood technologies in the country. The aim is not to be exhaustive but to indicate the broad spectrum of technologies and their commercial maturity.
 Source: Authors’ Analysis
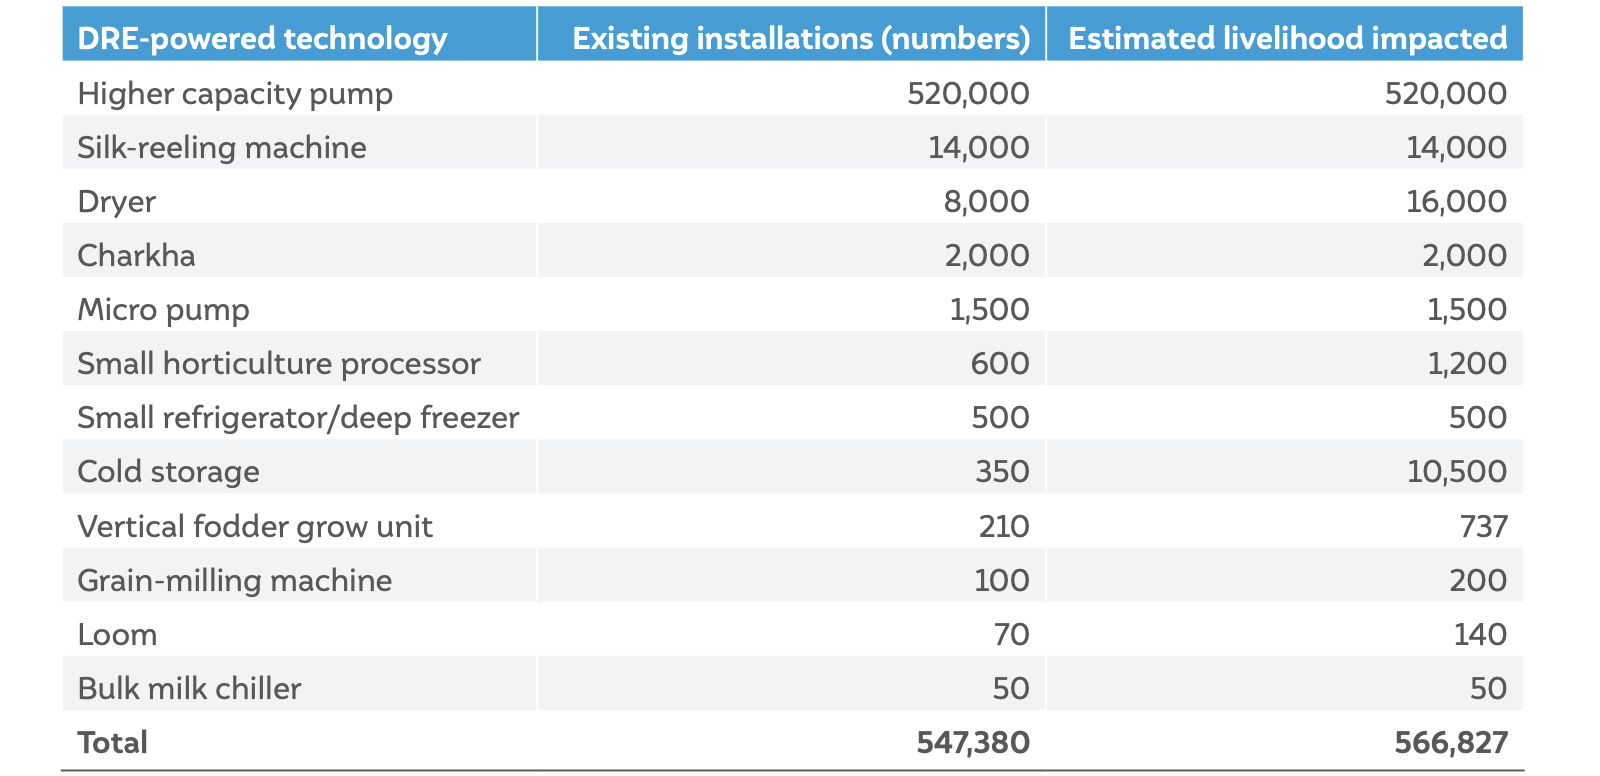
Table ES1 Few DRE livelihood technologies have scaled to reach thousands of users.
 Source: Authors’ compilation
As a rapidly evolving sector that is still in its early stages, stakeholders who are trying to engage, support, or promote these DRE livelihood technologies – including policymakers, bankers, financiers, donor, enterprises, incubators, and development sector professionals – are often confronted with the following questions:
Our report answers these questions. In the process, we propose a framework that can help us navigate the DRE livelihoods landscape, even as technologies and markets evolve over time.
To answer these emerging questions, we use an impact-feasibility framework.
We define impact as the number of livelihoods a DRE livelihood technology can positively impact in a given region. In some ways, it pertains to the ‘scale of impact’.
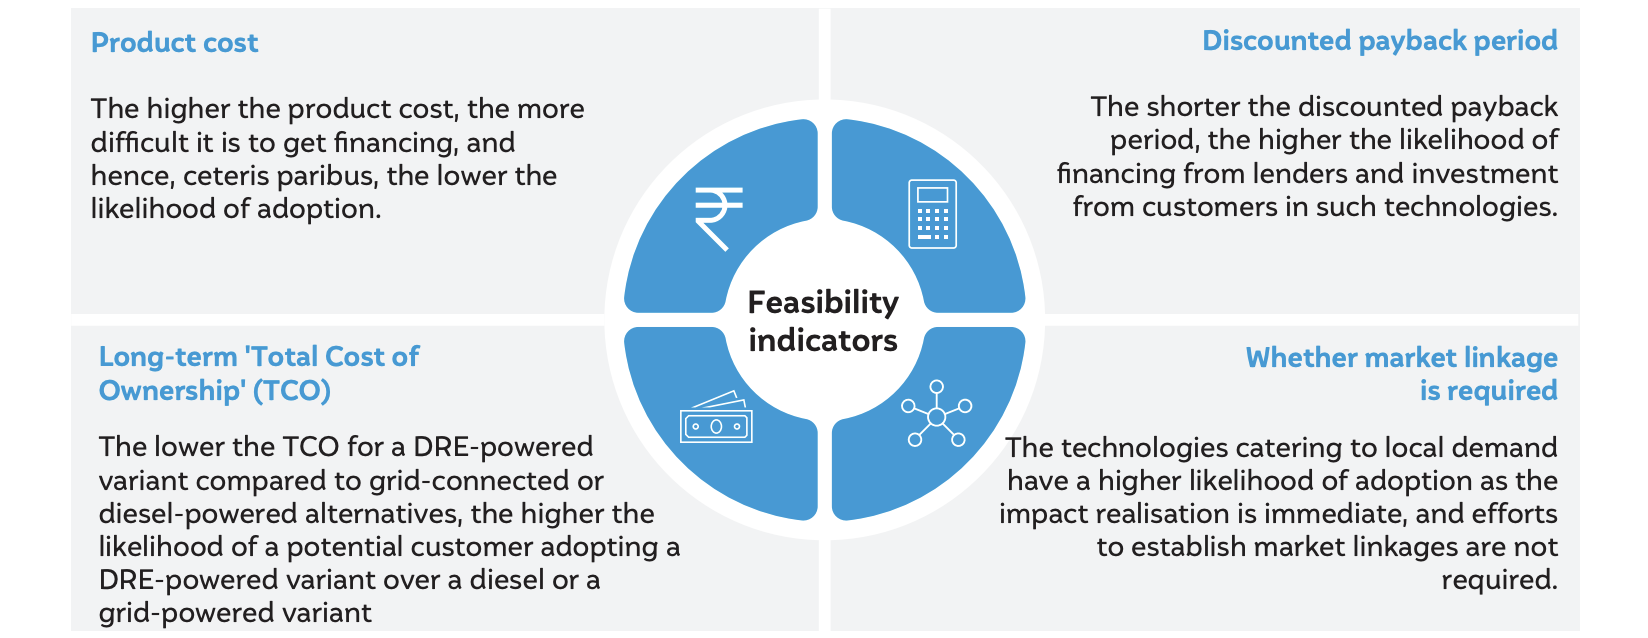
We define feasibility as the likelihood of realising the impact. It is essentially a measure of how feasible it is to realise the impact that the DRE livelihood technology promises. We assess feasibility through a combination of indicators.
Based on this framework, we undertook a comparative assessment of the DRE livelihood technologies that have achieved commercial maturity (in the agriculture and textile sectors). The findings around these 12 commercially-mature technologies are discussed below.
Figure ES1 Feasibility assessment indicators
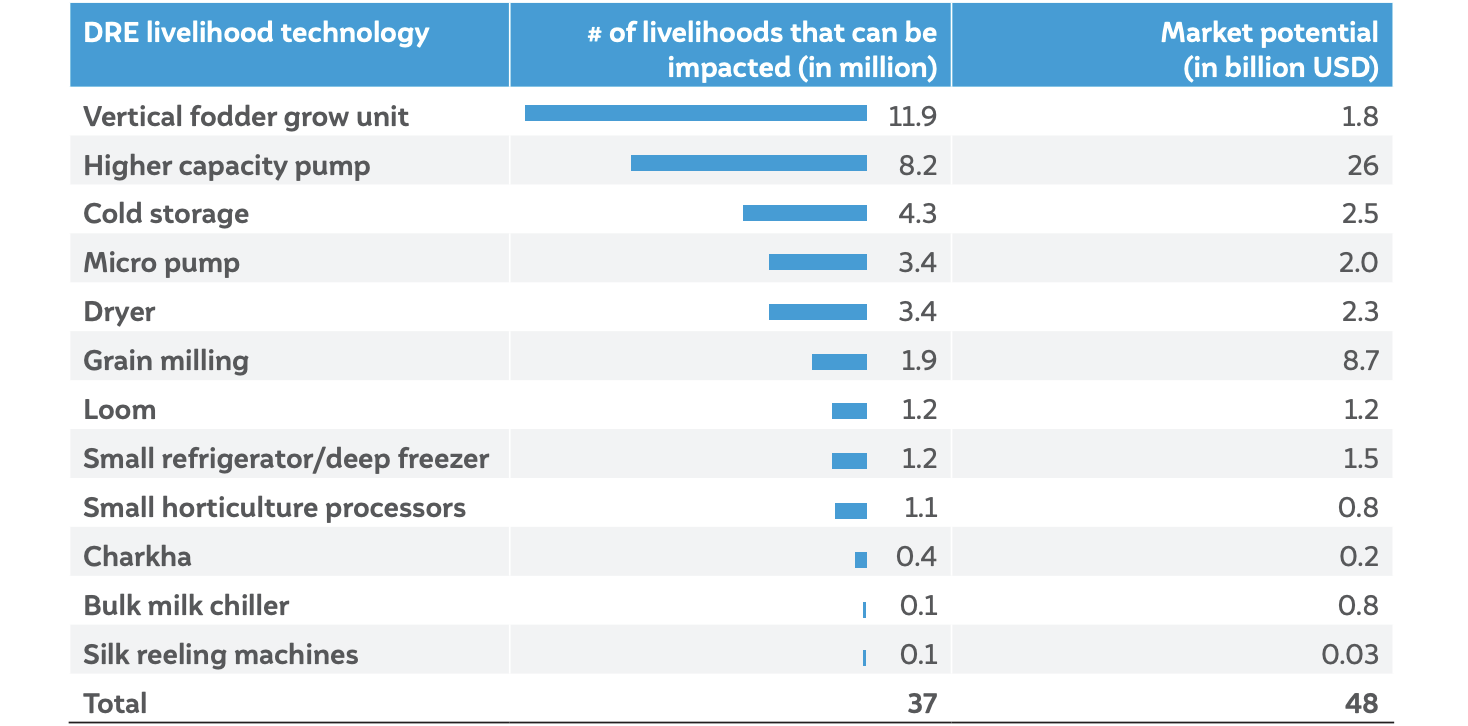
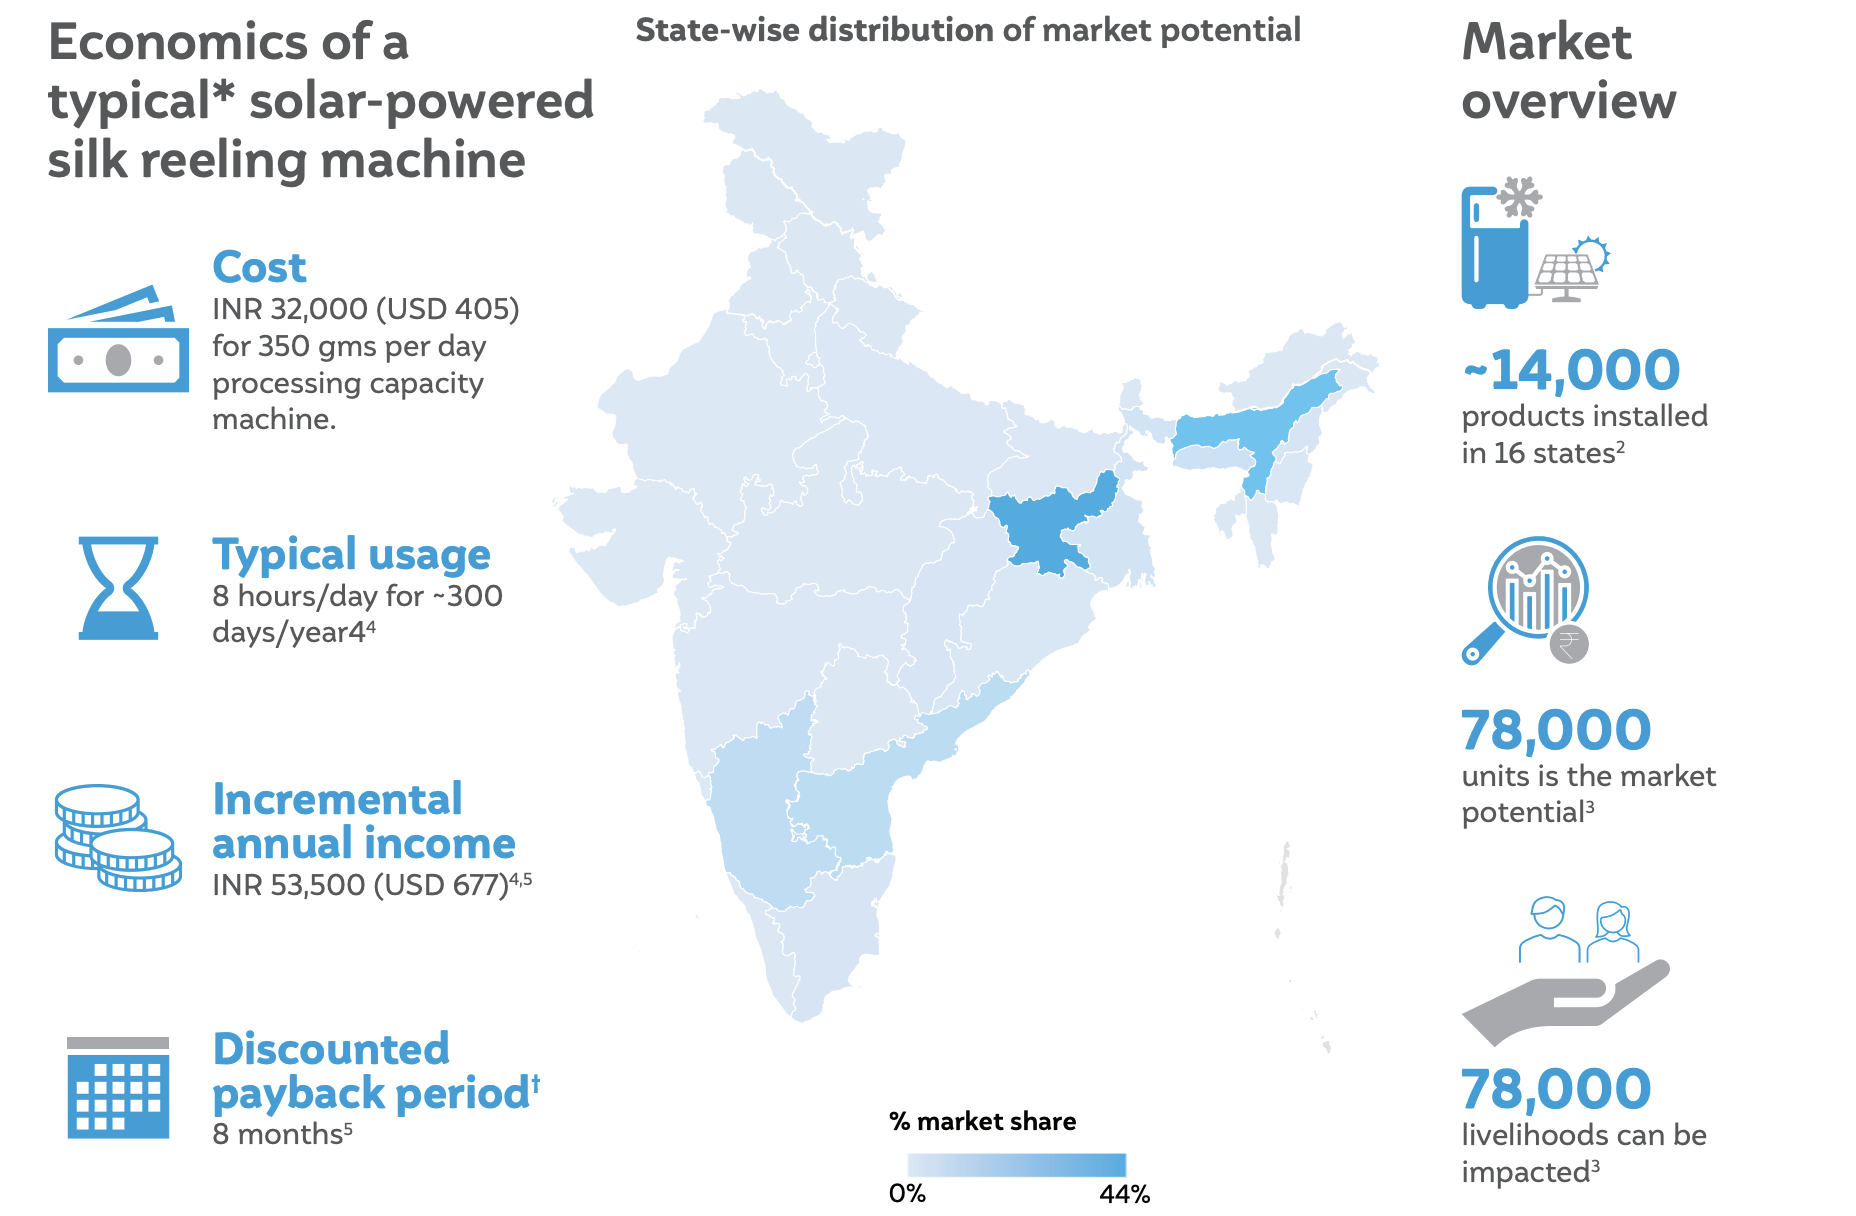
The twelve mature DRE livelihood technologies collectively have the potential to impact 37 million livelihoods This livelihood impact potential translates into a revenue opportunity worth USD 48 billion for enterprises deploying and commercialising such technologies. The number of current deployments of these technologies and associative livelihood impact are also summarised in the Table ES2.
Table ES2 The 12 mature DRE livelihood technologies have already impacted more than 566,000 livelihoods across India.
 Source: Authors’ compilation
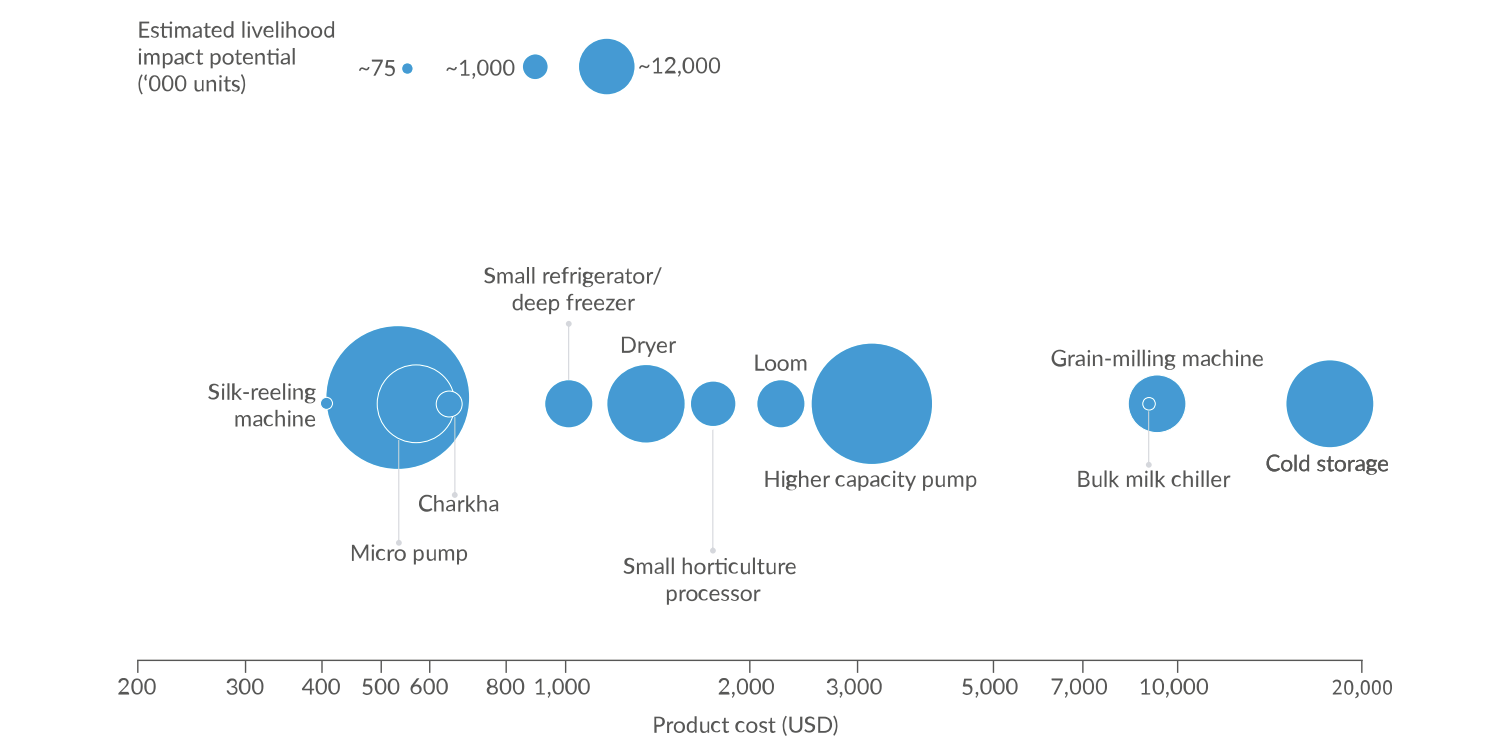
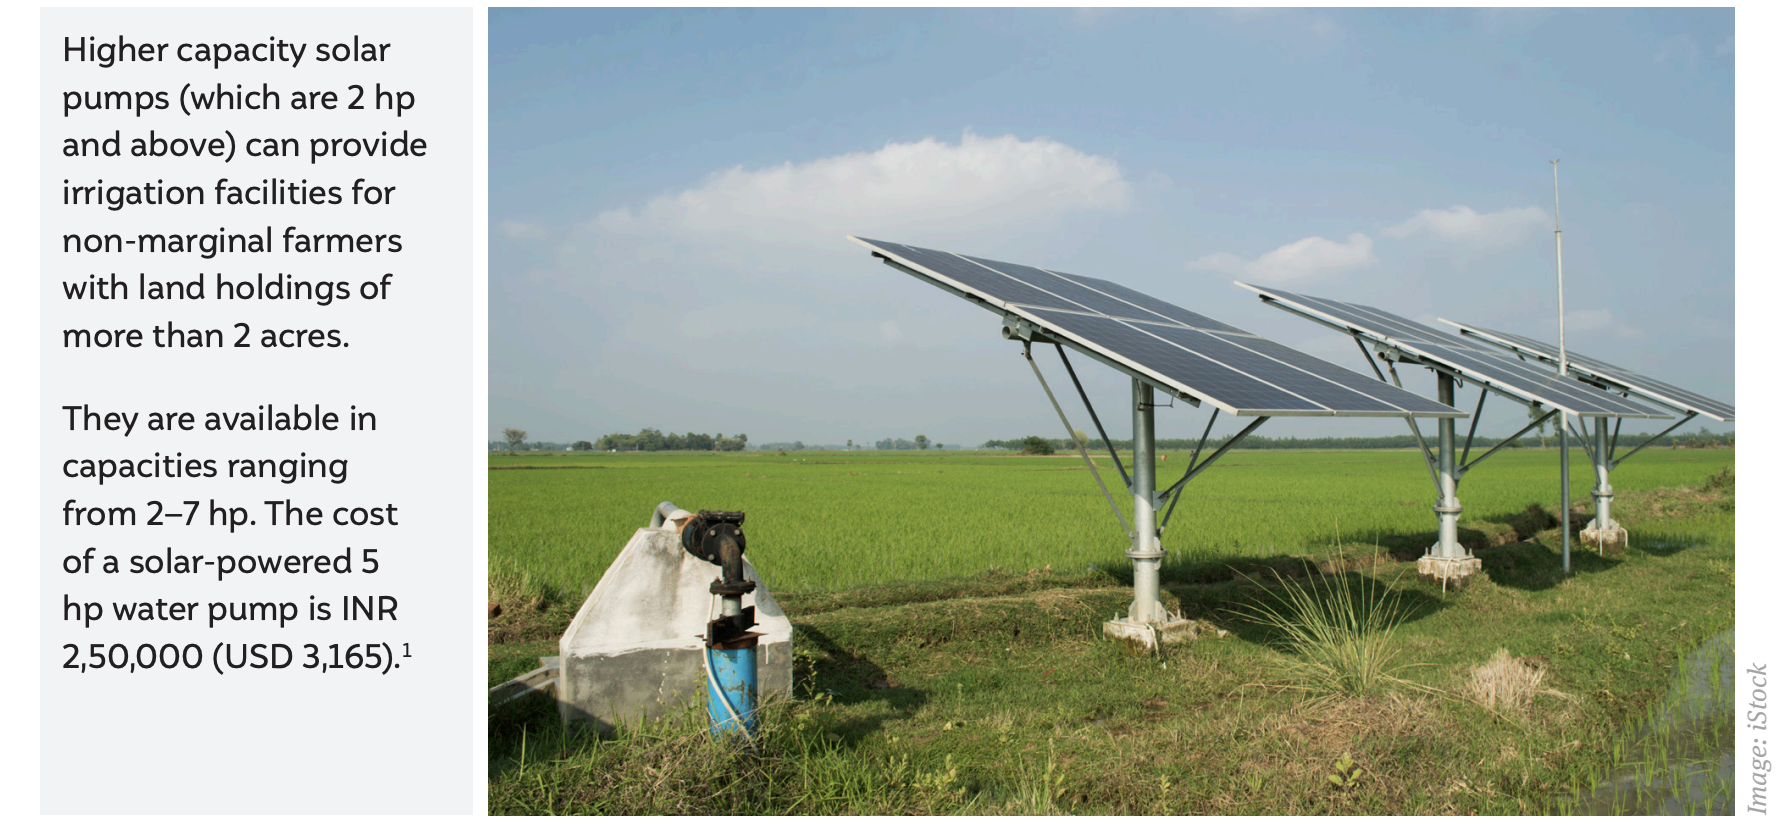
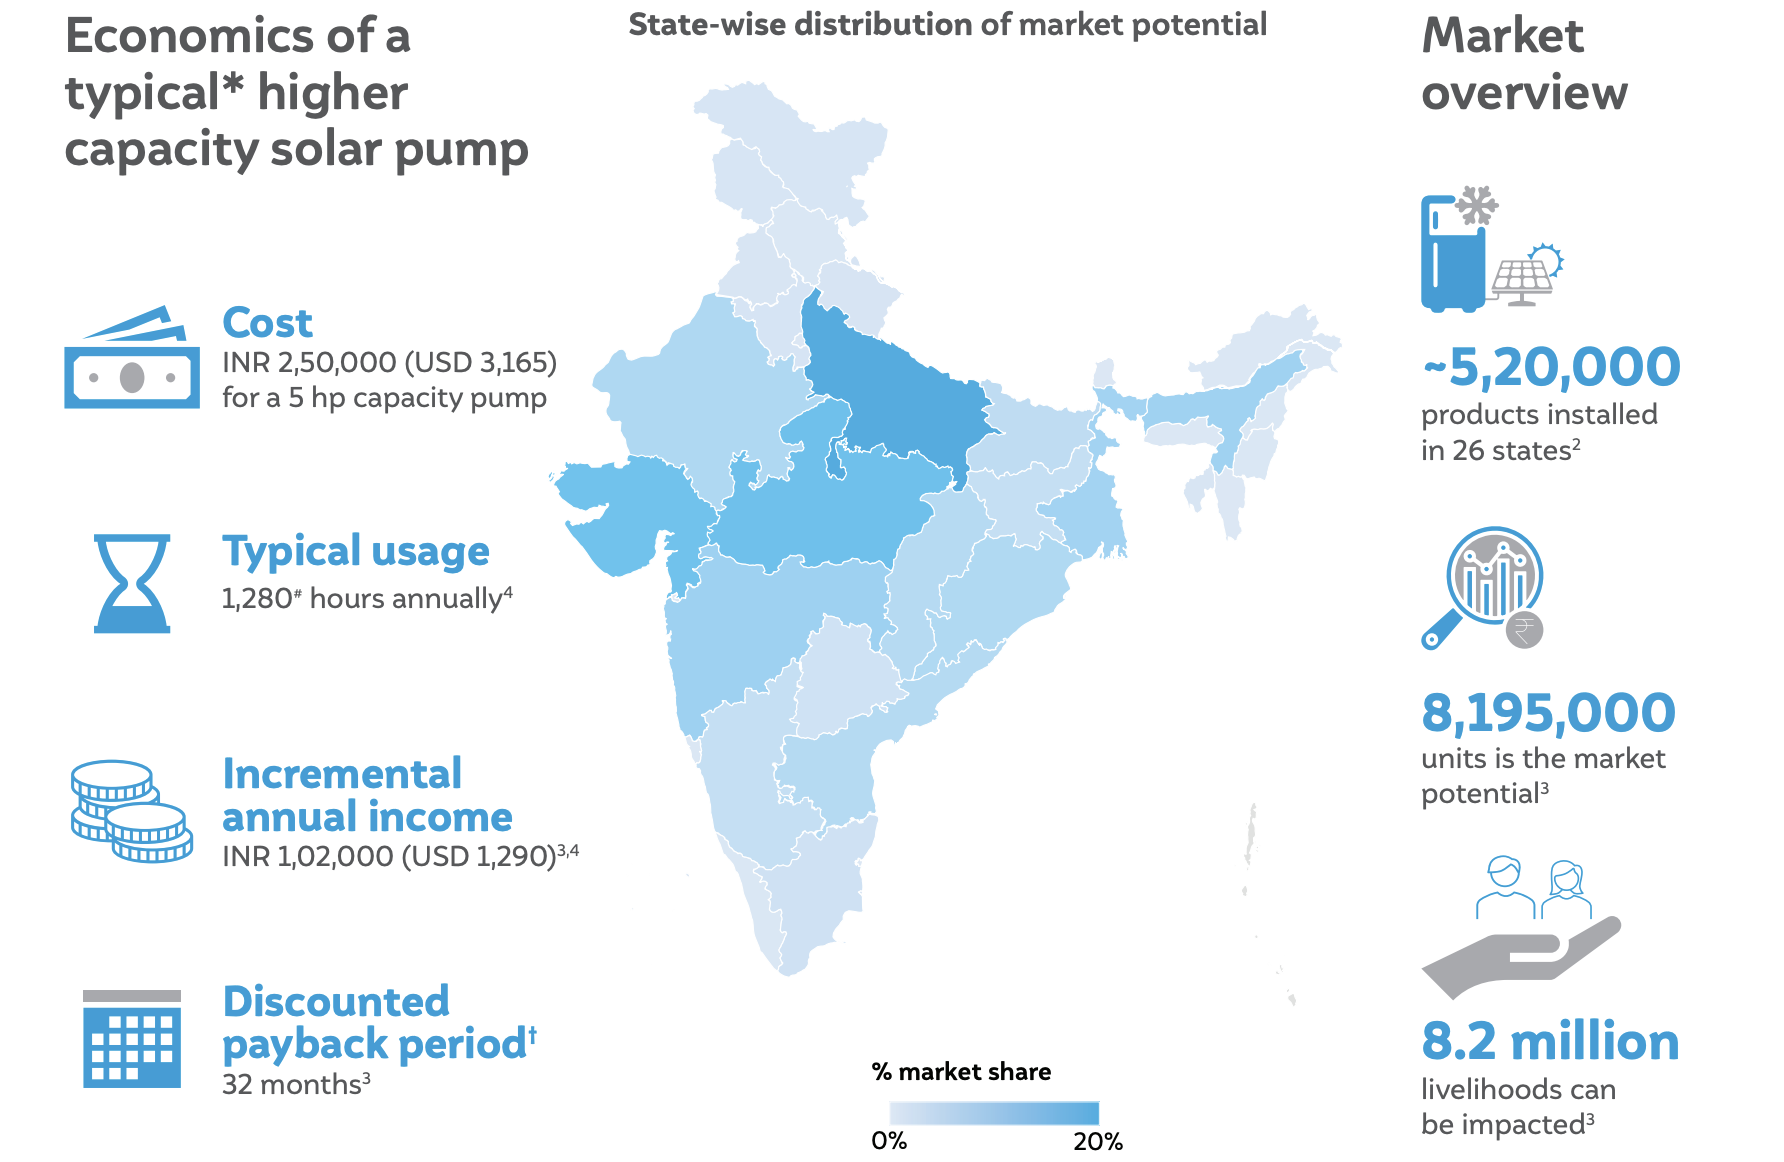
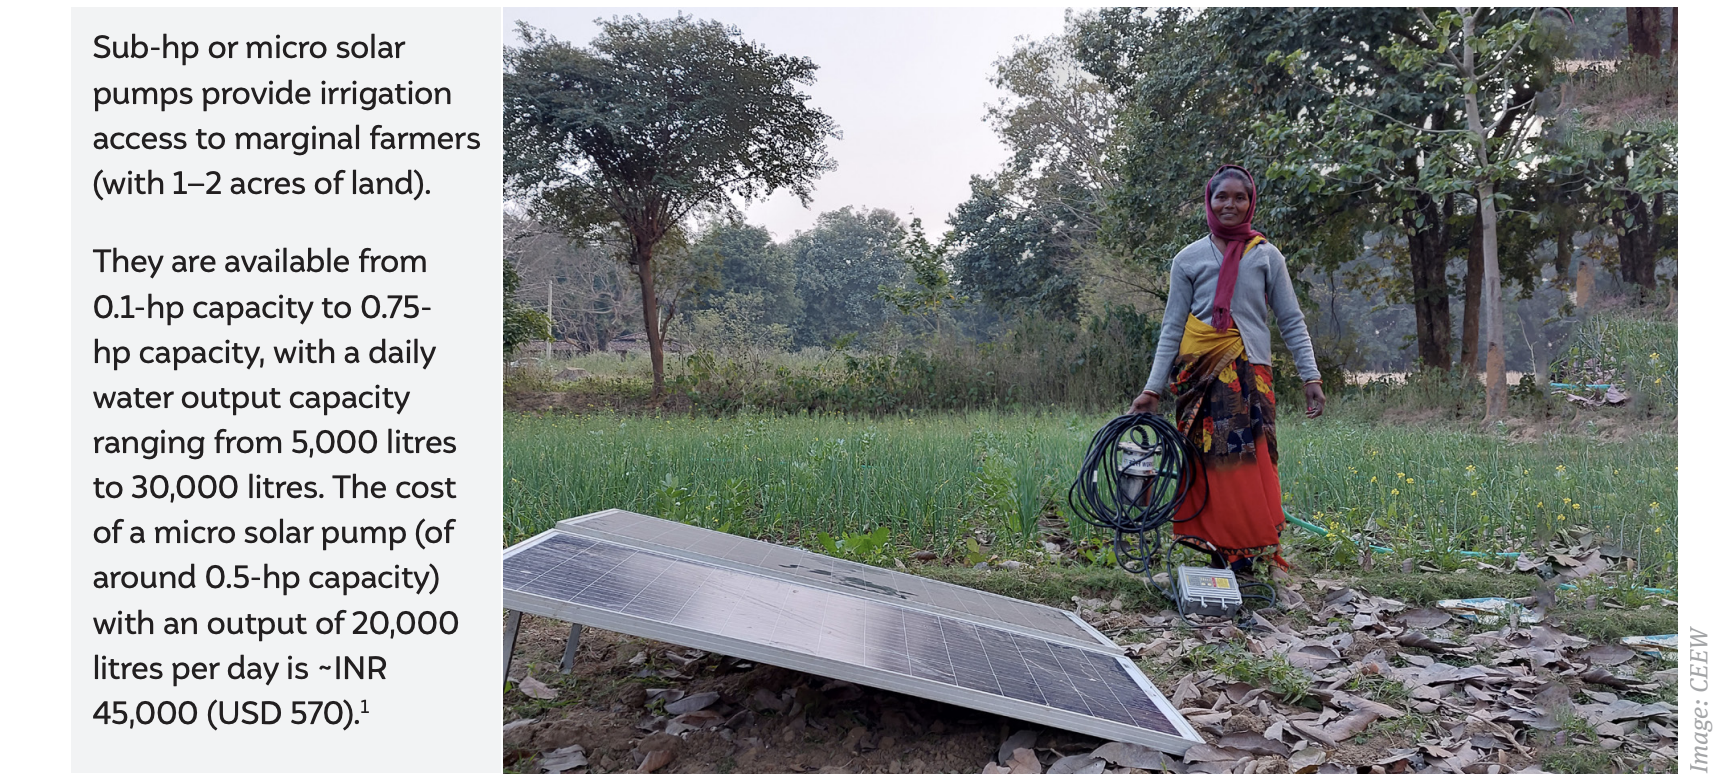
Solar-powered pumps—higher capacity and micro-pumps— have the maximum deployment potential, followed by solar-powered vertical fodder growing units and solar dryers. Collectively, these four technologies alone can impact around 27 million livelihoods. Unsurprisingly, solar pumps are the most mature among these technologies due to the government subsidy programmes supporting them since 2015. We summarise the estimated livelihood potential of each such technology in Table ES3.
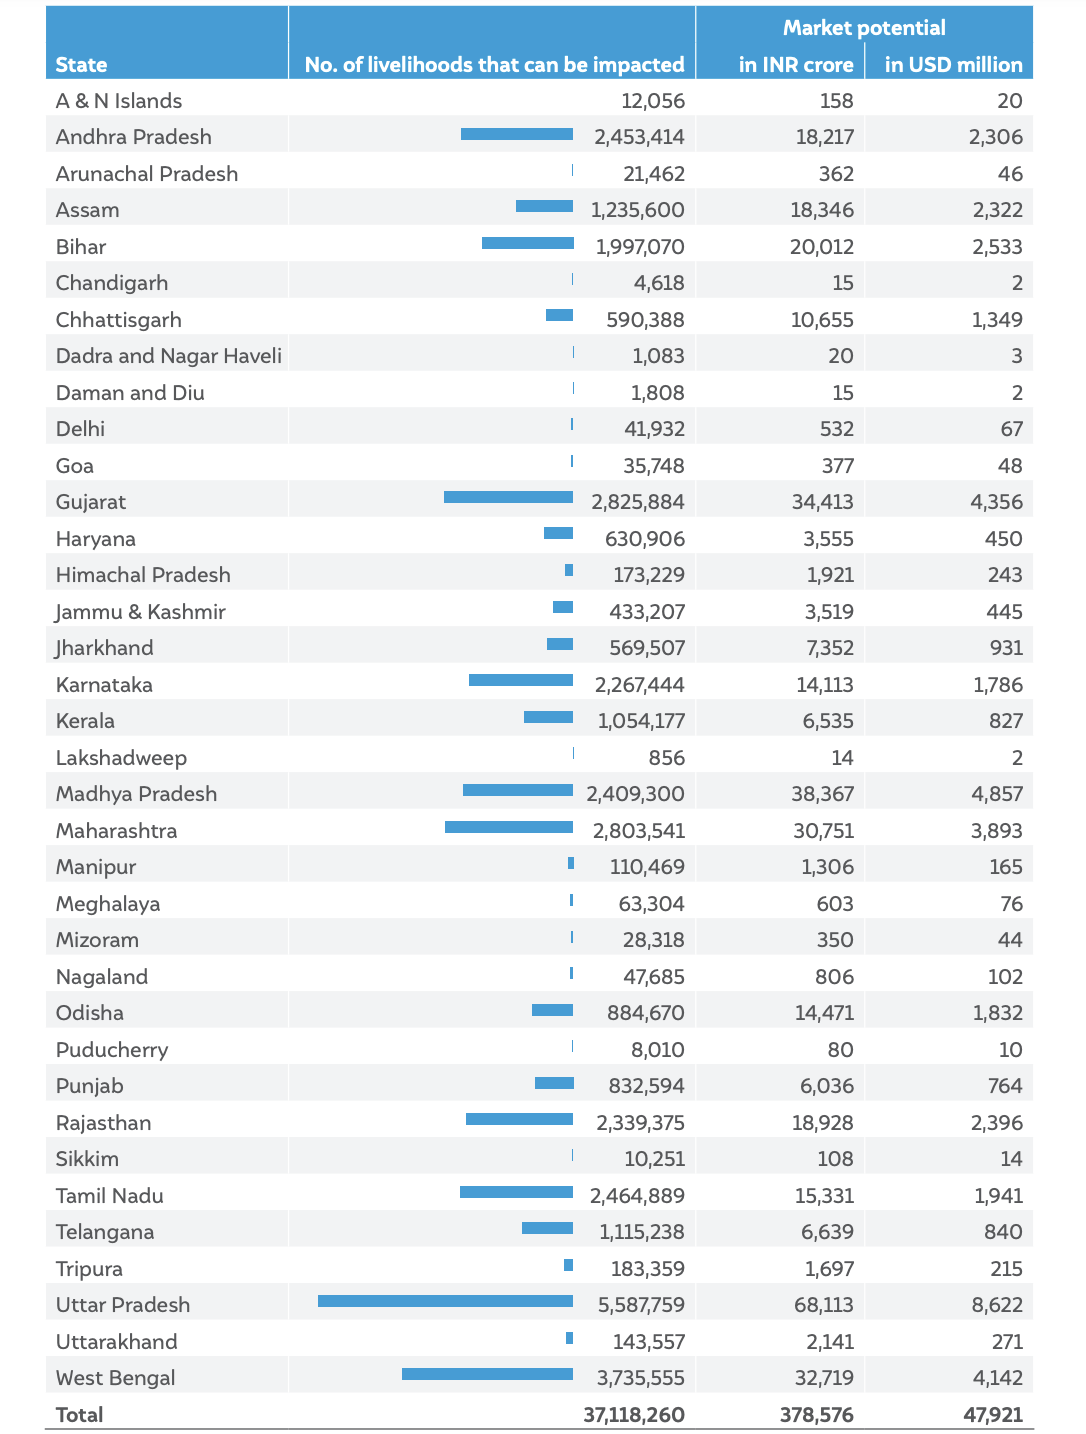
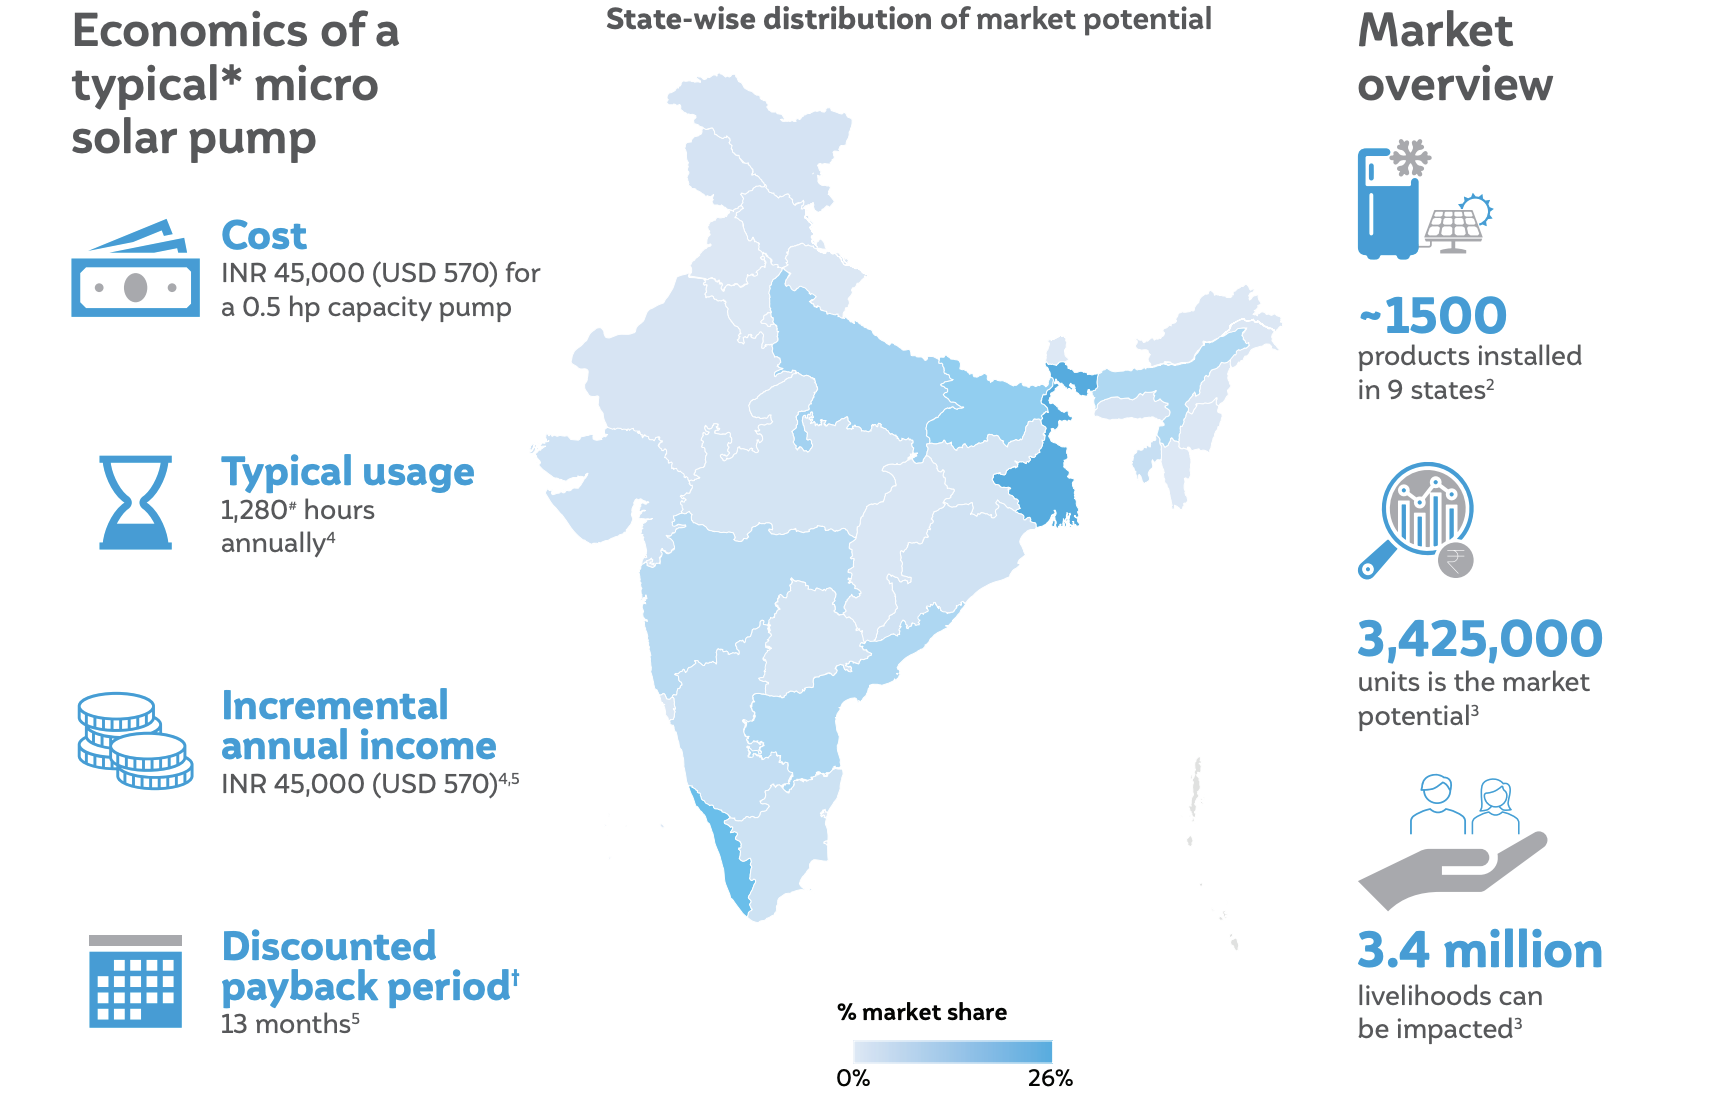
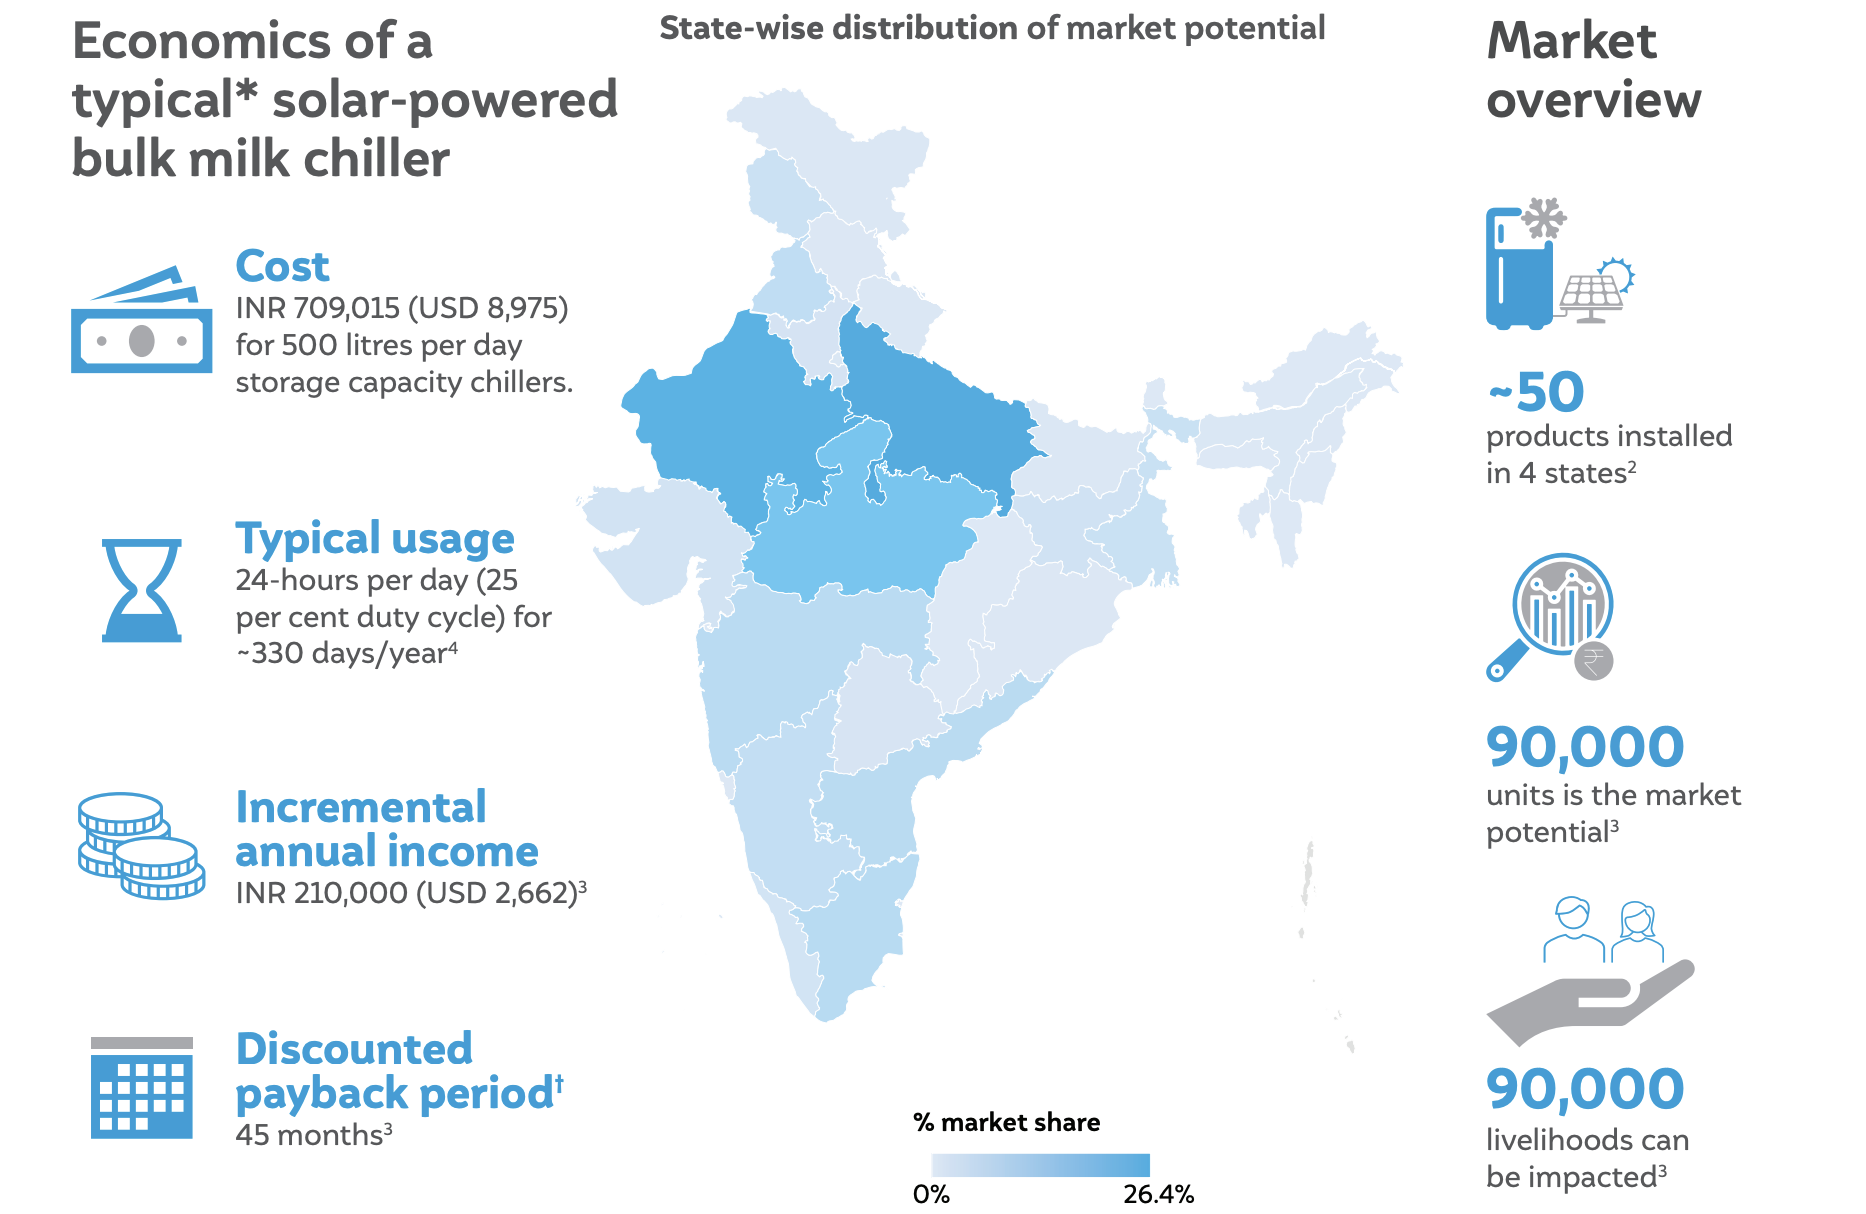
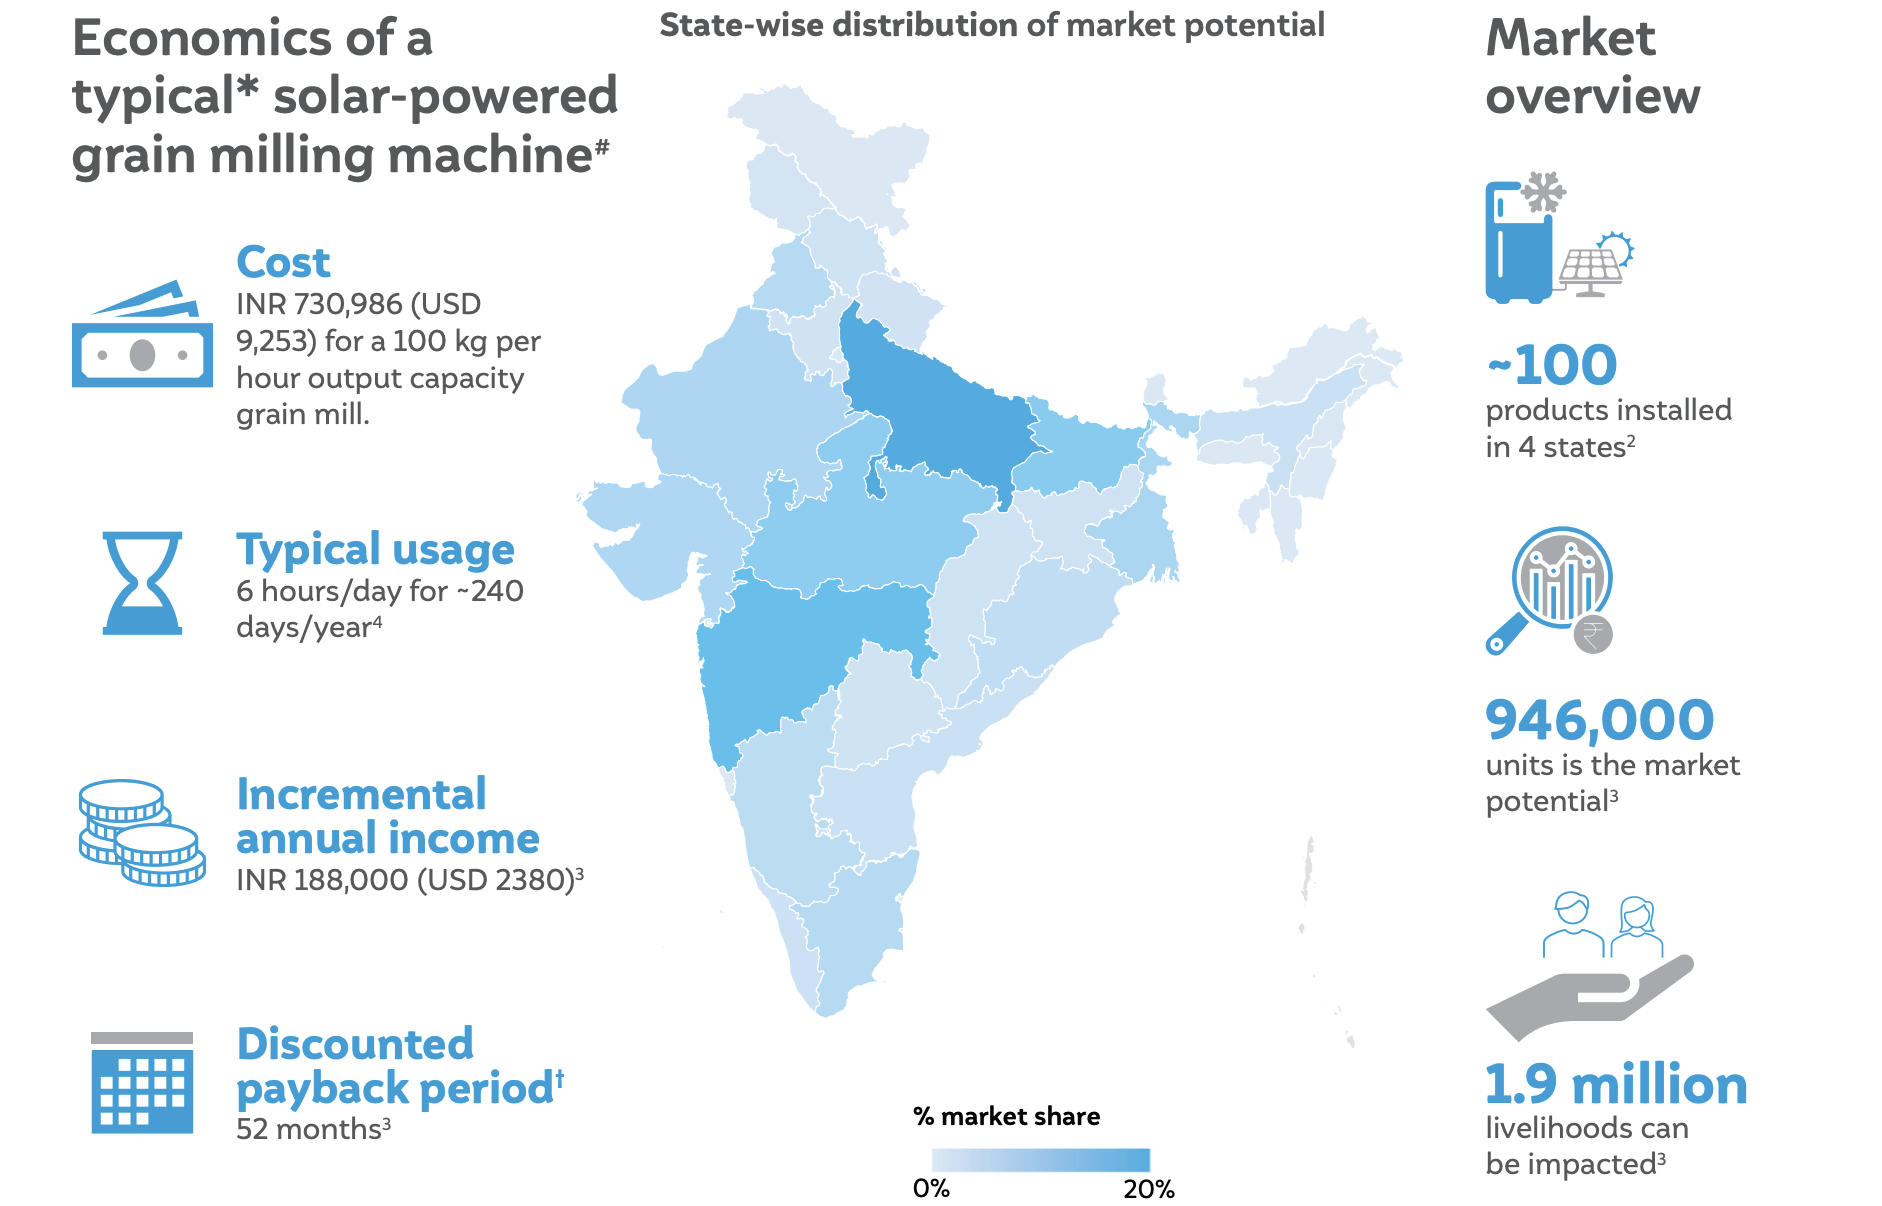
The DRE livelihood technologies have the greatest impact opportunity in Uttar Pradesh, the state with the highest population in the country. It is followed by West Bengal, Bihar, Gujarat, Maharashtra, Madhya Pradesh, and Karnataka. Table ES4 shows the distribution of market potential and livelihood impact potential among Indian states.
Table ES3 The 12 mature DRE livelihood technologies have the potential to impact 37 million livelihoods across India
 Source: Authors’ compilation
Table ES4 State-wise distribution of market and impact potential.
Source: Authors’ compilation
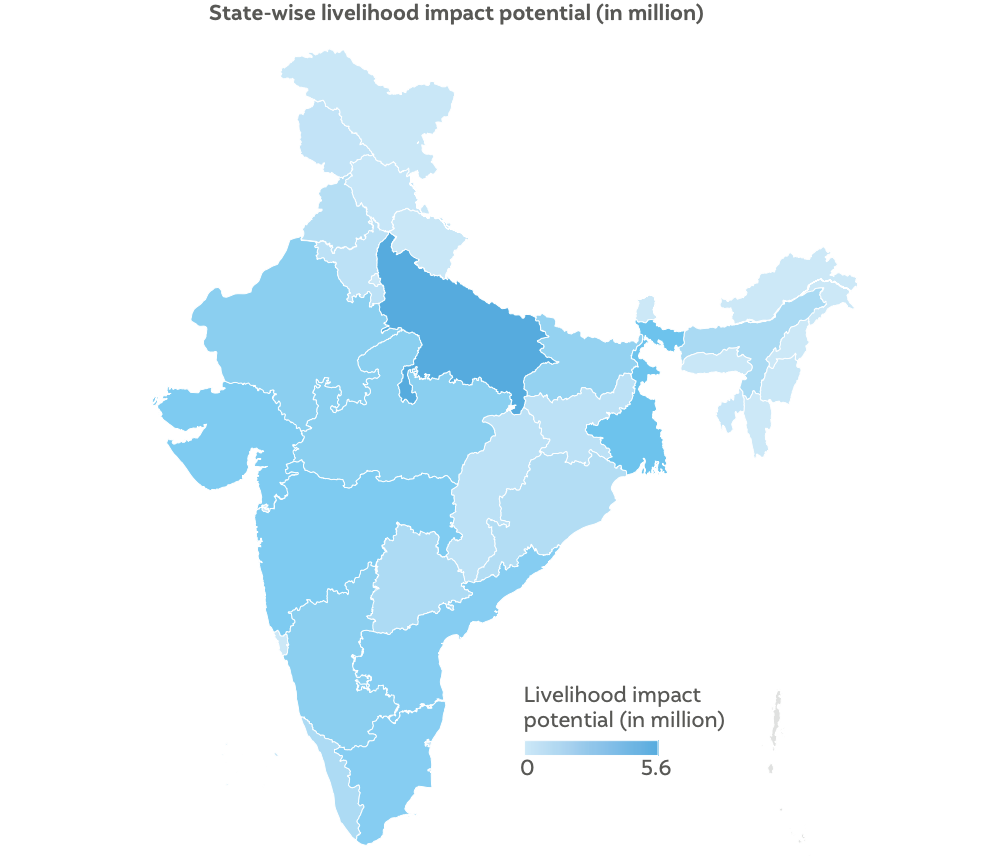
Additionally, the relative market for each DRE livelihood technology varies across states. For example, micro solar pumps have the highest market in West Bengal, whereas solar dryers have the highest market in Maharashtra. The relative impact potential of these DRE livelihood technologies across Indian states is shown in Figure ES2.
Figure ES2 Uttar Pradesh has the greatest impact opportunity for DRE livelihood technologies.
Source: Authors’ compilation
Feasibility of impact realisation
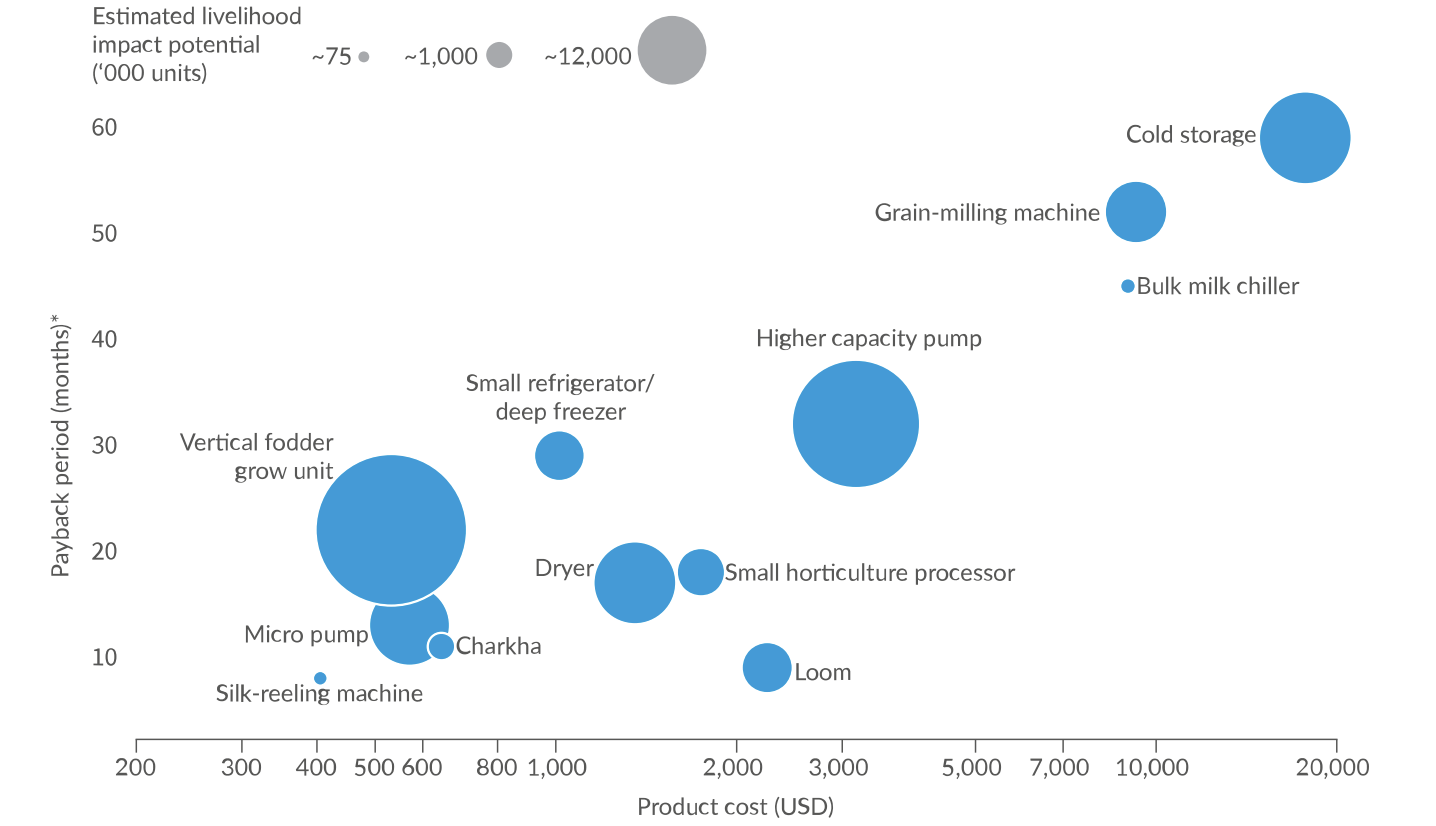
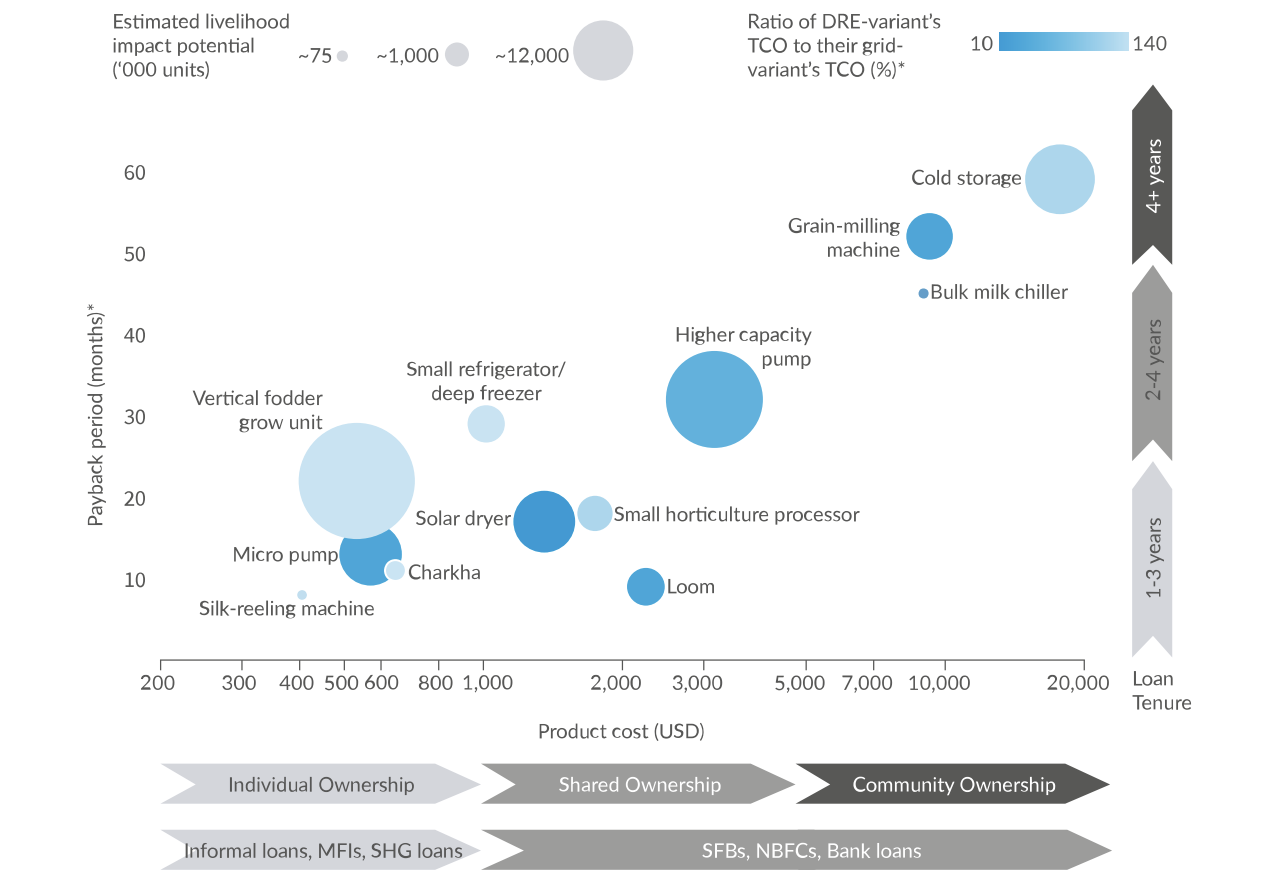
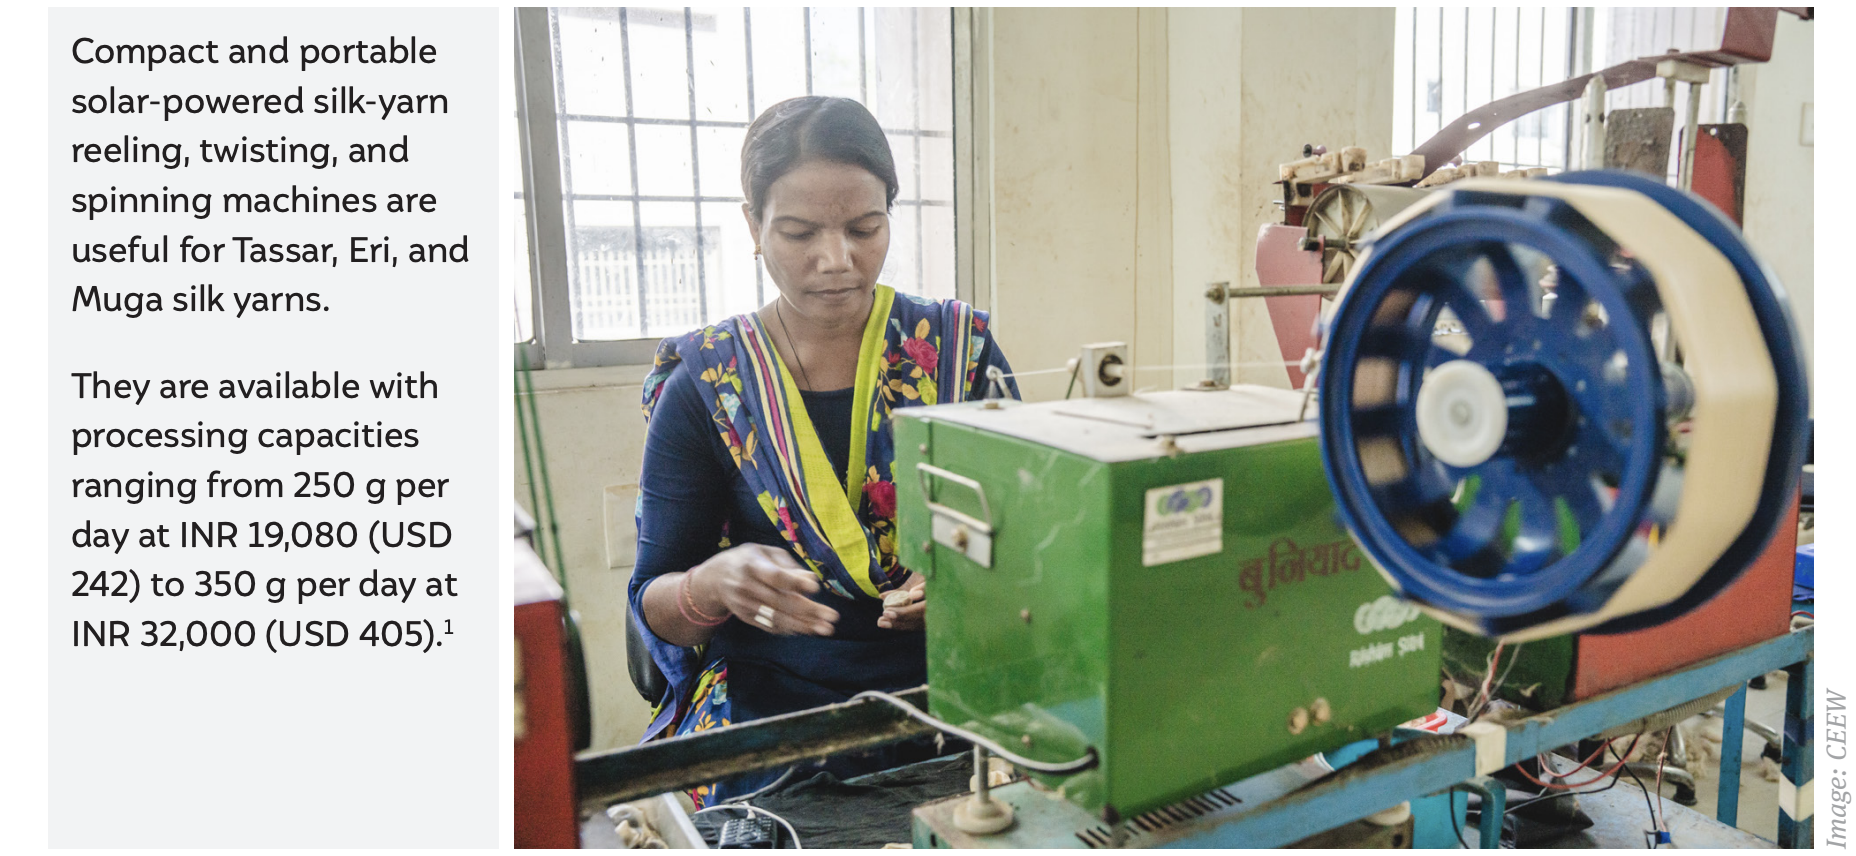
Next, we add our feasibility indicators to the impact potential to understand the relative ease of enabling the adoption of such technologies among potential customers. First, we plot the livelihood impact potential against the typical product cost1 (Figure ES3). Please note that the product-cost axis is in the log scale and that we are considering the product costs of the most popular variants of these technologies. Of course, the product costs vary across product capacities and different manufacturers, but the broader order of magnitude and the relative cost trends among technologies remain, as shown in Figure ES3. Products on the left end of the spectrum, such as solar-powered silk-reeling machines and micro solar pumps, would have a relatively higher likelihood of adoption than those on the other end, such as solar-powered bulk milk chillers and solar-powered cold storages. We understand this is a broad generalisation, and there could be several exceptions; we add nuances as we proceed further in the discussion.
Figure ES3 DRE livelihood technologies cost between INR 25,000 - INR 1,400,000
Source: Authors’ compilation
Next, on the same plot, we add another dimension to assess the feasibility aspect – the typical discounted payback periods of the respective DRE livelihood technologies. The relative location of each technology bubble along the Y-axis is now determined by its typical discounted payback period, as shown in Figure ES4. The products lower on the Y-axis, i.e., having shorter discounted payback periods, are more likely to find traction among the end-users and financiers. We also observe a broad positive association between the product’s unit cost and the discounted payback period. Costlier DRE livelihood technologies have longer payback periods. However, there are notable exceptions, such as solar-powered looms and solar-powered small horticulture processors. It is worth noting that the payback periods are estimated based on the typical (median) reported income increase by the end-users of these technologies through impact assessment surveys and customer interviews conducted by CEEW. The income increase itself has significant variation based on the context of use. For instance, solar-powered cold storage used to store potatoes would generate a very different income profile than one used to store high-value commodities such as lemons. So, the payback periods are indicative and used to broadly understand the relative trends across technologies.
Figure ES4 Technologies with shorter payback periods may find more traction among users and financiers
 Source: Authors’ compilation
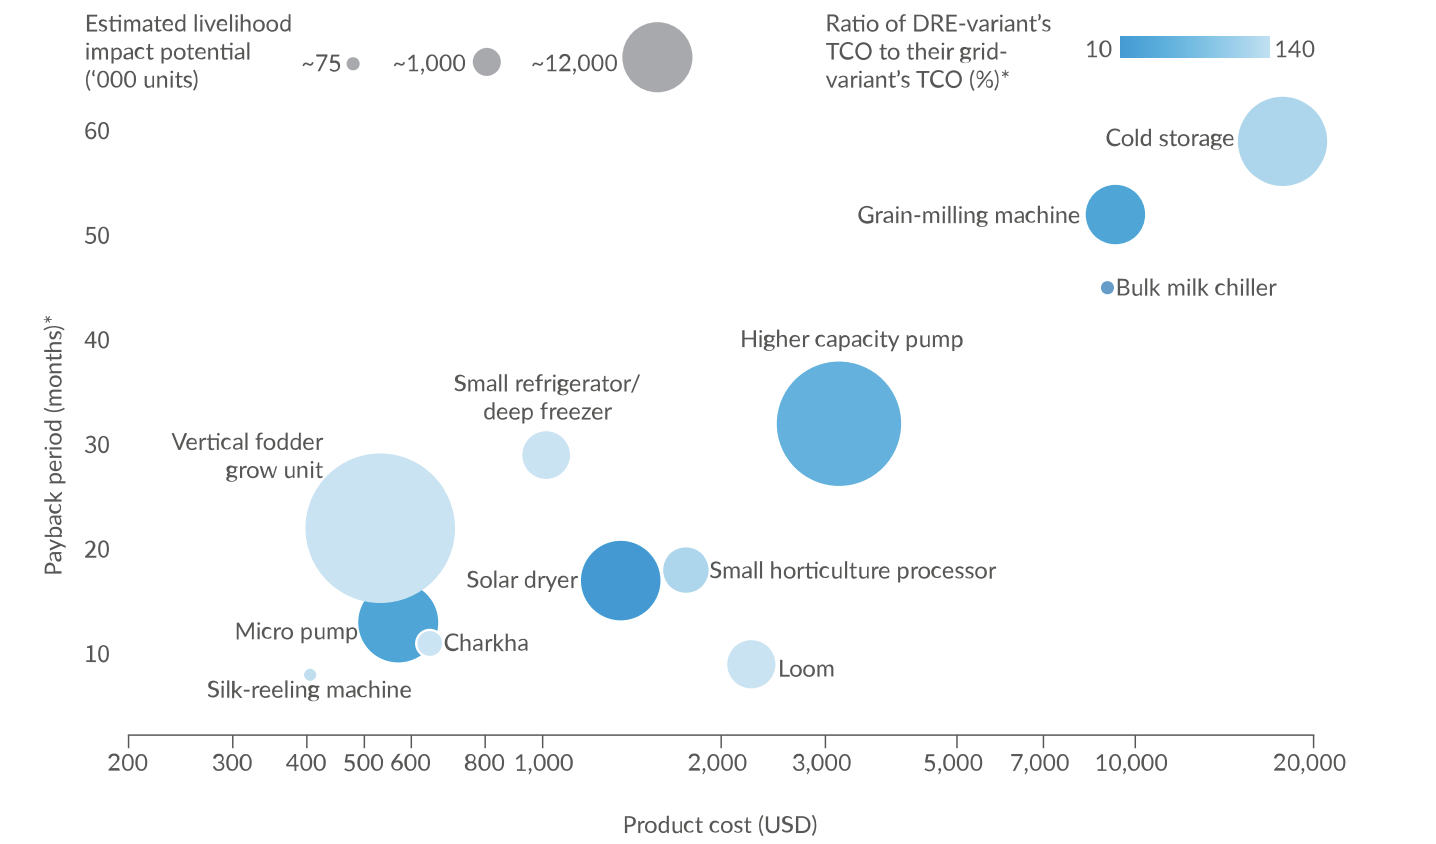
Next, we add another feasibility dimension to the same plot: the TCO for ten years of operations compared to grid alternative2 , represented by the colour of the bubbles in Figure ES5. The darker the bubble’s shade, the lower the long-term cost of the DRE variant compared to the grid alternative. It indicates that DRE livelihood technologies such as solar dryers, and solar-powered looms are highly attractive economically, even in areas with reliable grid supply. By contrast, for technologies such as small solar refrigerators, solar-powered horticulture processors, or solarpowered cold storages, their DRE variant saves costs only marginally over a 10-year period as compared to their grid alternative. However, over a 15-year investment horizon, the DRE variants of such technologies become much more attractive than their grid alternatives. So, if an end user is considering a business horizon of 10+ years, the DRE livelihood technologies could be economically more attractive, even if the grid is reliable.
Figure ES5 Solar dryers, fodder-growing units, and looms are highly economically attractive than their grid variants
 Source: Authors’ compilation
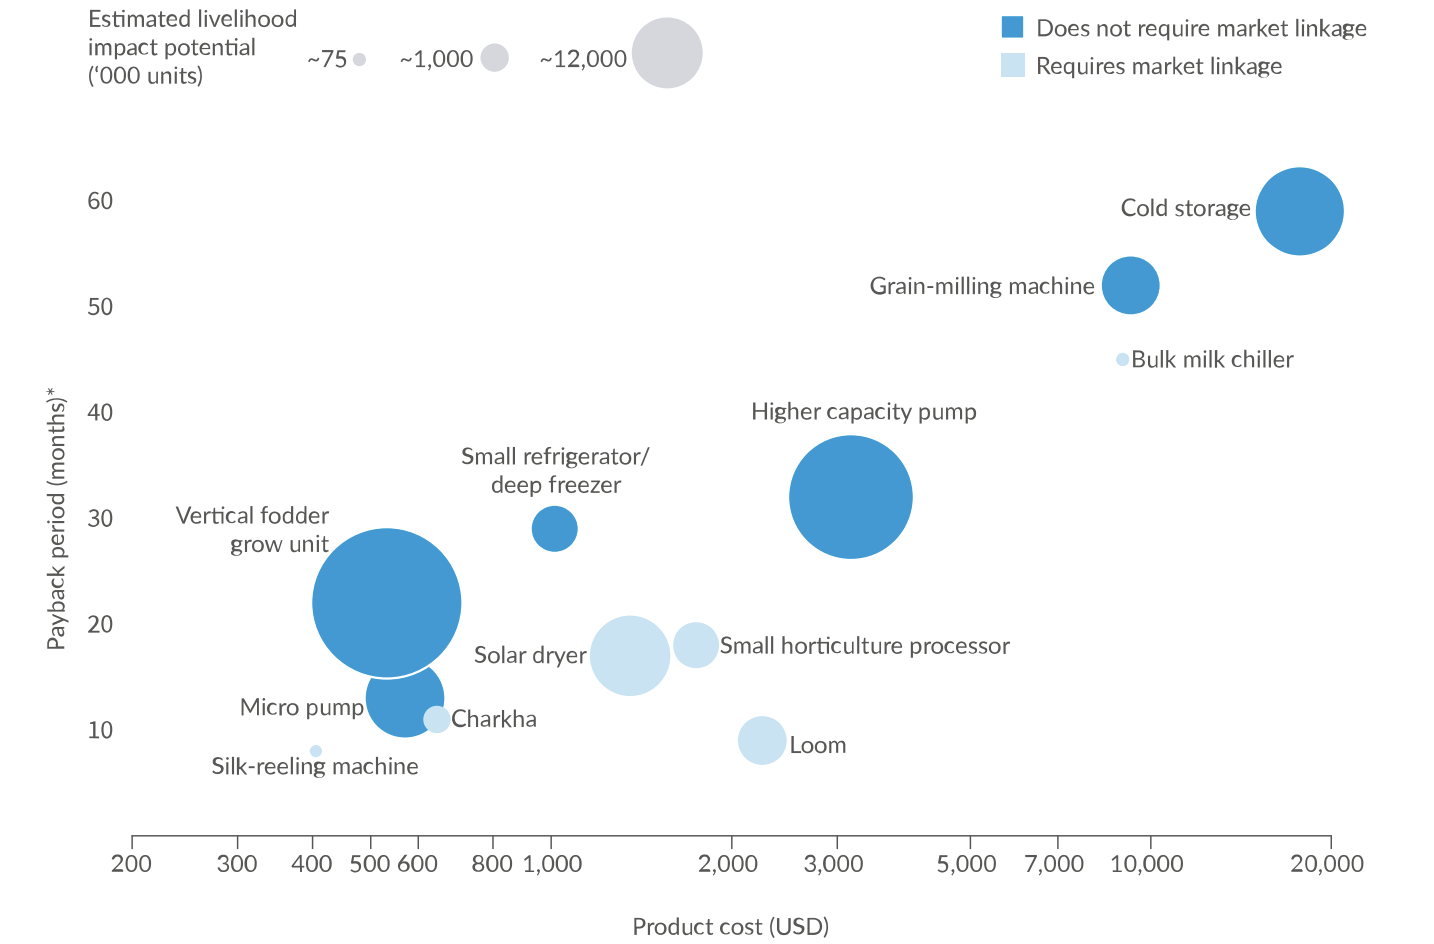
Finally, instead of colouring the bubbles with the comparative costs of the grid alternatives, we colour the bubbles based on whether the DRE livelihood technologies need an explicit market linkage to be viable. As shown in Figure ES6, the products with the darker shade (i.e., which do not need a market linkage) would have lower barriers to adoption, ceteris paribus.
Figure ES6 DRE livelihood technologies for local demands may experience better adoption
 Source: Authors’ compilation
Figure ES7 The product cost and payback period can help guide ownership models, source of financing, and loan tenures.
Source: Authors’ compilation
Guiding the business, financing and stakeholder engagement models
Apart from identifying technologies with high impact potential and feasibility, the impactfeasibility framework also helps to strategise the business, financing, and stakeholderengagement models for these DRE livelihood technologies. For instance, as shown in Figure ES7, as the value of the products increases, the ownership model for these technologies would likely shift from individual users to community/farmer groups. Similarly, the financiers for such technologies would change from Microfinance institutions (MFIs) and Small Finance Banks (SFBs) on the left end of the spectrum to larger Non-Banking Financial Companies (NBFCs) and banks on the right. Similarly, the location of these bubbles on the Y-axis (i.e., the typical discounted-payback periods) can help financiers devise relevant financial products with appropriate loan tenures to match the typical payback periods, as the technologies move up the Y-axis, longer tenure loans are needed to make the financing viable.
The analysis and key findings that emerge would generally help sector stakeholders make more informed decisions about which products to support in different contexts. They would also help the stakeholders appreciate the relative impact potential and the feasibility of the various DRE livelihood technologies. However, it is important to reiterate that this broad sector-wide analysis does not conclude the viability of each individual installation in its particular context. The factors that would play an important role in determining the contextspecific viability of these technologies are:
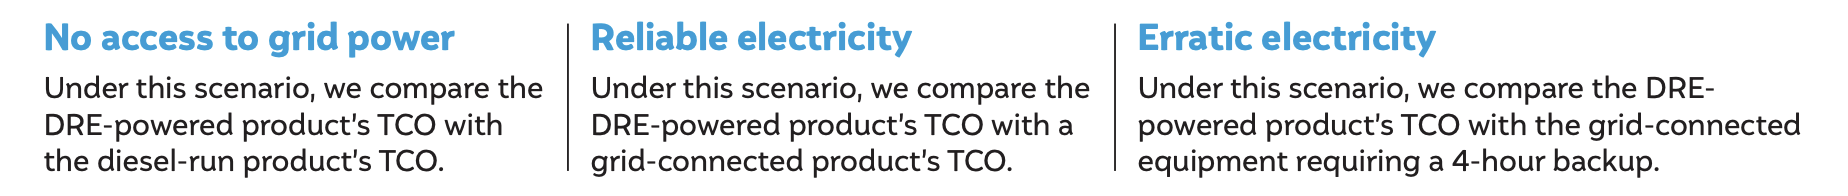
• The utilisation of the asset, i.e., the number of hours a year for which the DRE livelihood technologies are used. For example, a solar pump is generally much more economically attractive than a diesel pump, but if a pump would only be used for 20 days a year, then a diesel pump – despite its very-high running costs – would be economically more attractive than a solar pump.
• The value of the commodity being processed/stored in these technologies: What is being stored in a biomass-powered cold storage or what is being processed in a solarpowered horticulture processor will strongly influence the income the end user could generate from it. For instance, processing aloe vera and mangoes to create value-added products would generate higher income than processing tomatoes and carrots.
• The investment/business horizon of the end user/microenterprise: those with longer investment horizons would find DRE livelihood technologies to be more economically attractive compared to grid alternatives.
• For some technologies, the prevailing and future reliability of the grid. For certain technologies (as discussed prior), DRE variants may not be as economically attractive if the grid is highly reliable in an area.
The results of the scenario/sensitivity analysis around these factors for each of the twelve mature DRE livelihood technologies are discussed in the section below. It may help stakeholders make more informed choices based on the specific contexts in which they plan to support the deployment of DRE livelihood technologies.
 Source: Authors’ analysis
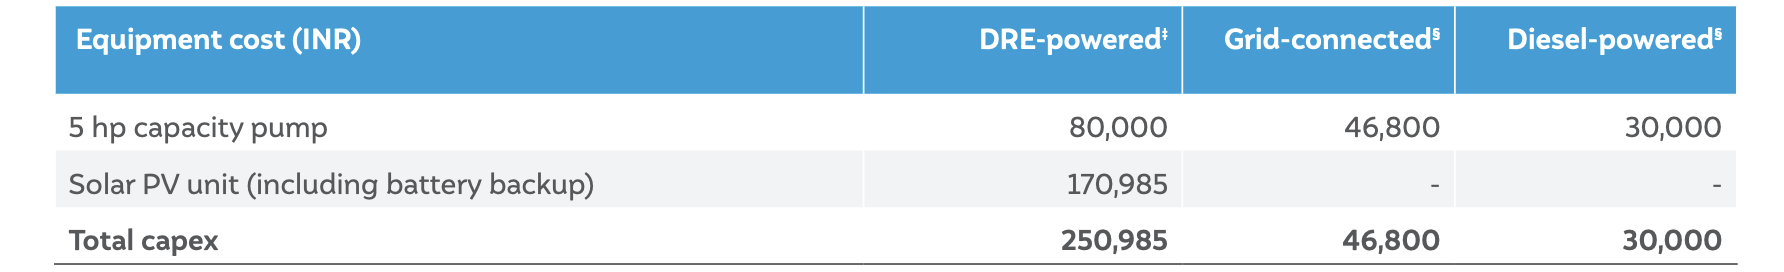
The incremental income and associated payback period are based on the average or median values. Incremental income through higher capacity solar pumps varies from INR 72,000 to INR 1,56,000, depending on savings in fuel costs and an increase in the number of cropping cycles and cropped area. Many users with incomes lower than average or median income would have much longer payback periods. Accordingly, such users may need support through product subsidies or longer-tenure loans.
 Source: Authors’ analysis
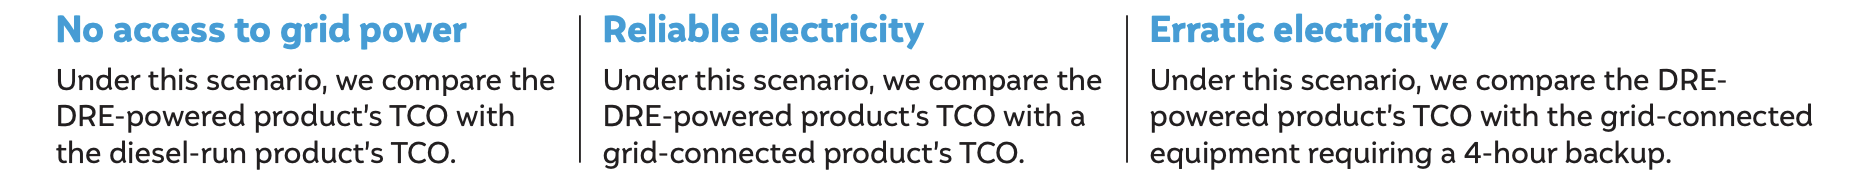
We compare the TCO†† of DRE-powered products with that of other variants under different scenarios of power availability and daily usage durations for various investment horizons.

 Source: Authors’ analysis
The comparative analysis of TCO shows that the DRE variant is financially more attractive than the other product variant in regions with no or erratic electricity. Grid-connected variant is financially preferable in regions with reliable electricity.
 Source: Authors’ analysis
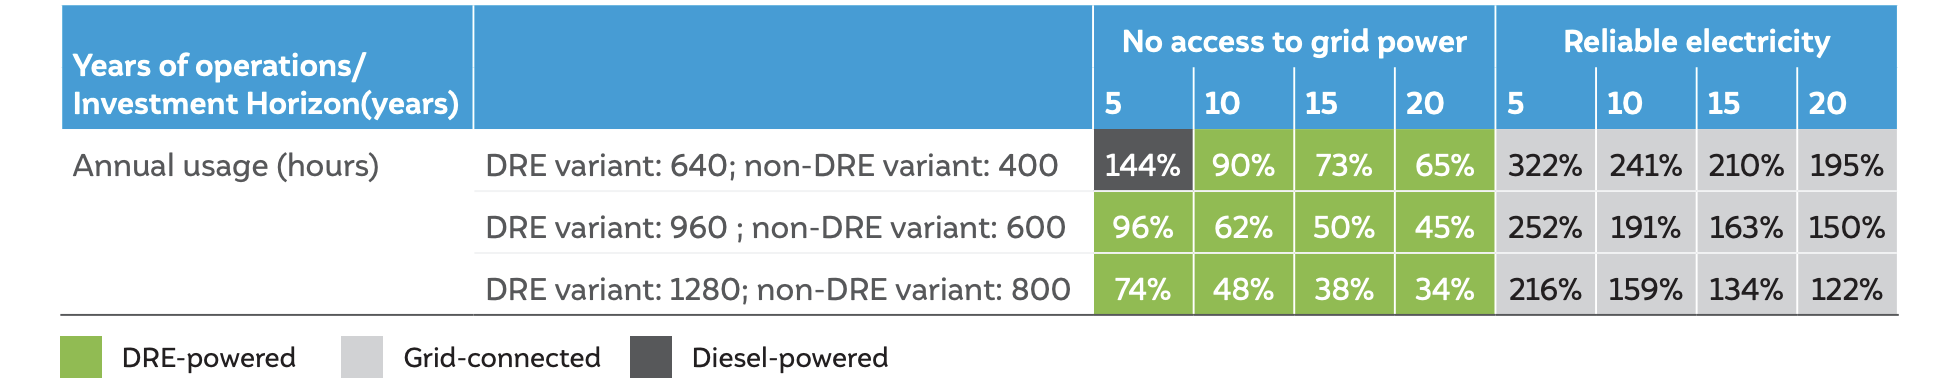
The incremental income and associated payback period are based on the average or median values. Incremental income through micro solar pumps varies from INR 30,000 to INR 55,000, depending on savings in fuel costs and an increase in the number of cropping cycles and cropped area. Many users with incomes lower than average or median income would have much longer payback periods. Accordingly, such users may need support through product subsidies or longer-tenure loans.
 Source: Authors’ analysis
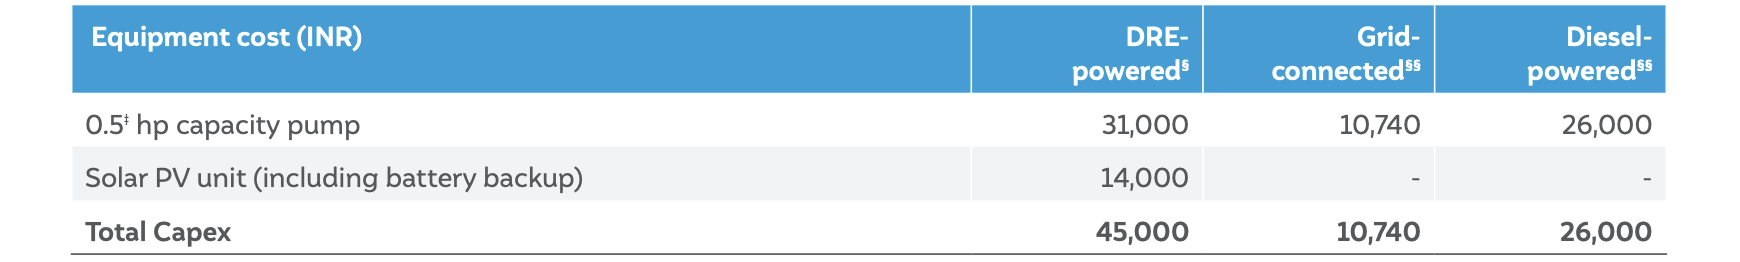
‡ A 2 hp diesel pump has been considered for comparison with the 0.5 hp DRE-powered and electric pumps.
§ The power rating of the 0.5 hp DRE-powered and grid-connected product is 0.375 kW. Details considered are sourced from the manufacturers for the DREpowered product, and from IndiaMART for grid-connected product.
§§ A 2 hp diesel pump has a typical power rating of 1.4 kW. Details listed are as indicated on IndiaMART (last accessed in August 2022).
 Source: Authors’ analysis
We compare the TCO†† of DRE-powered products with that of other variants under different scenarios of power availability and daily usage durations for various investment horizons.

In the table below, the cell’s colour represents the financially-preferable product variant. Whereas, the cell values denote the ratio of DRE-powered product’s TCO compared to the other product variant’s TCO in percentage terms.
 Source: Authors’ analysis
The comparative analysis of TCO shows that the DRE variant is financially more attractive than the other product variant in regions with no or erratic electricity. Grid-connected variant is financially preferable in regions with reliable electricity.
 Source: Authors’ analysis
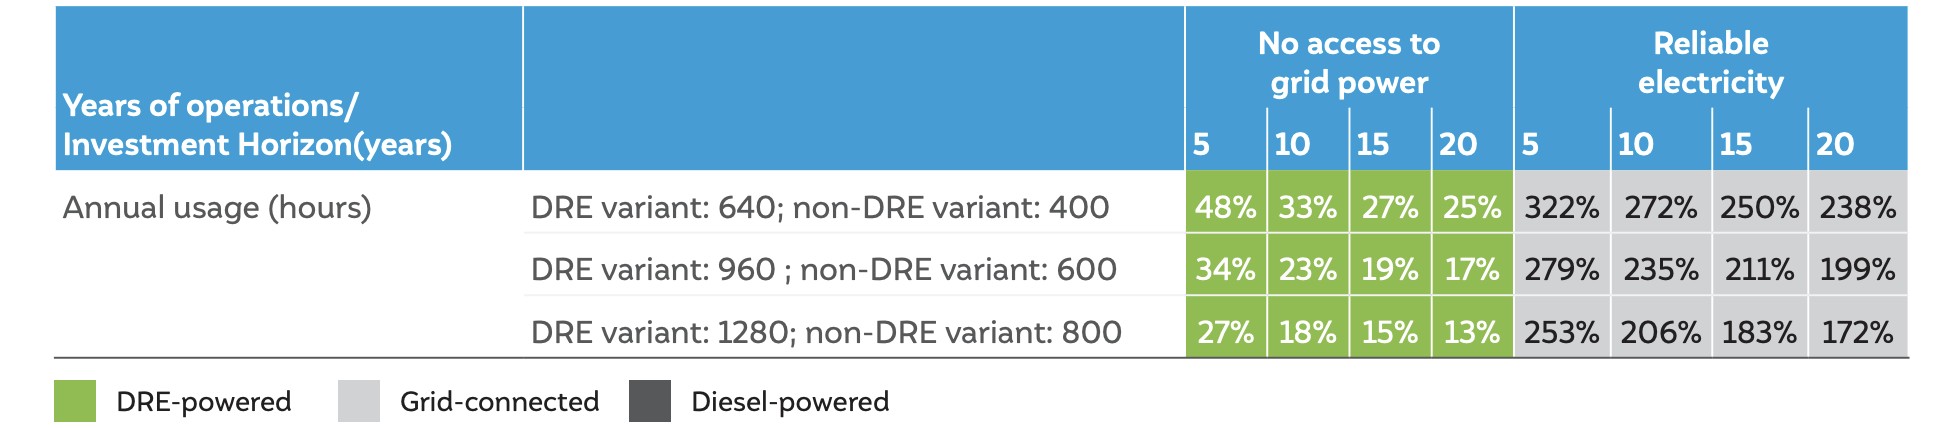
The incremental income and associated payback period are based on the average or median values. A user can annually earn anywhere between INR 27,500 for bakery or retail to INR 71,500 for fishery. Many users with incomes lower than average or median income would have much longer payback periods. Accordingly, such users may need support through product subsidies or longer-tenure loans.
 Source: Authors’ analysis
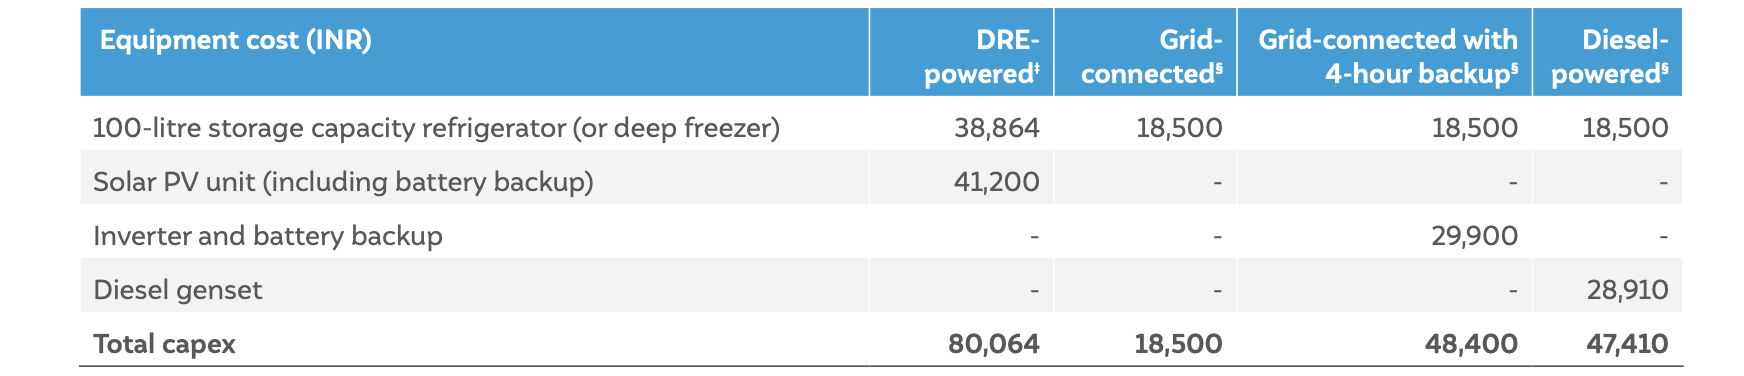
‡ The power rating of the DRE-powered small deep freezer is 0.085 kW. Details considered are sourced from the manufacturers.
§ A 100-litre storage capacity electric deep freezer has a typical power rating of 0.132 kW. Details listed are as indicated on IndiaMART (last accessed in August 2022).
 Source: Authors’ analysis
We compare the TCO†† of DRE-powered products with that of other variants under different scenarios of power availability and daily usage durations for various investment horizons.

In the table below, the cell’s colour represents the financially-preferable product variant. Whereas, the cell values denote the ratio of DRE-powered product’s TCO compared to the other product variant’s TCO in percentage terms.
 Source: Authors’ analysis
The comparative analysis of Total Cost of Ownership (TCO) shows that the DRE variant is financially more attractive than the other product variant in regions with no access to electricity. In regions of erratic electricity, the DRE variant is financially more attractive than the other product variant for an investment horizon of ten years and more. Grid-connected variant is financially preferable in regions with reliable electricity.
 Source: Authors’ analysis
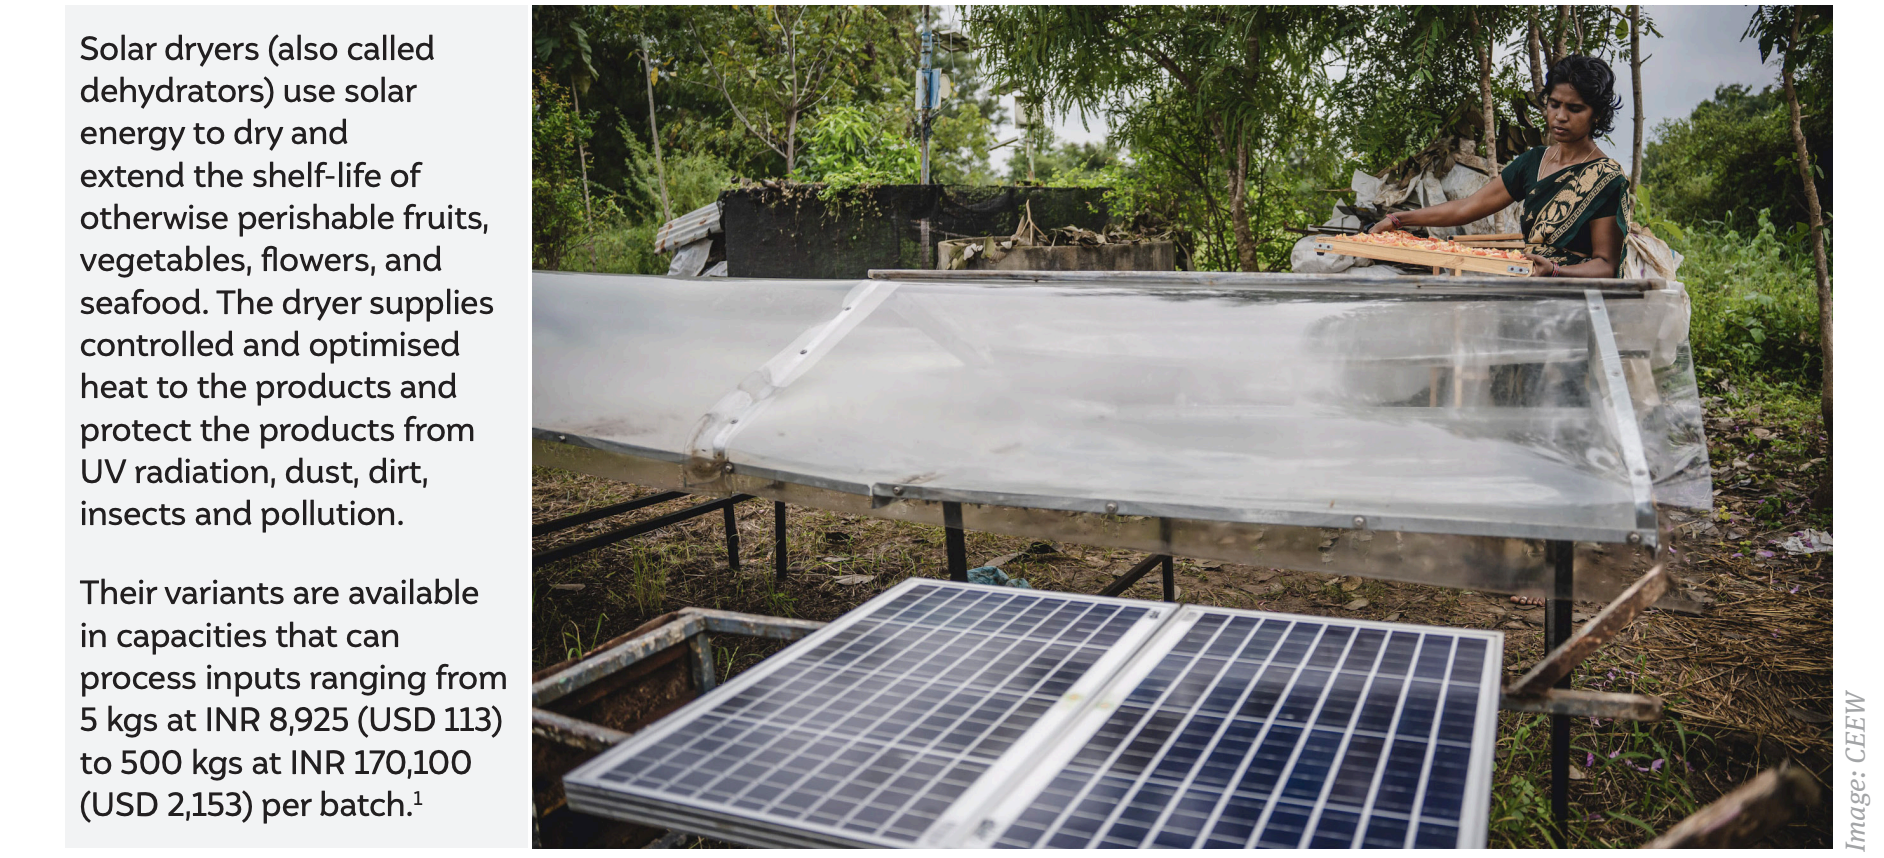
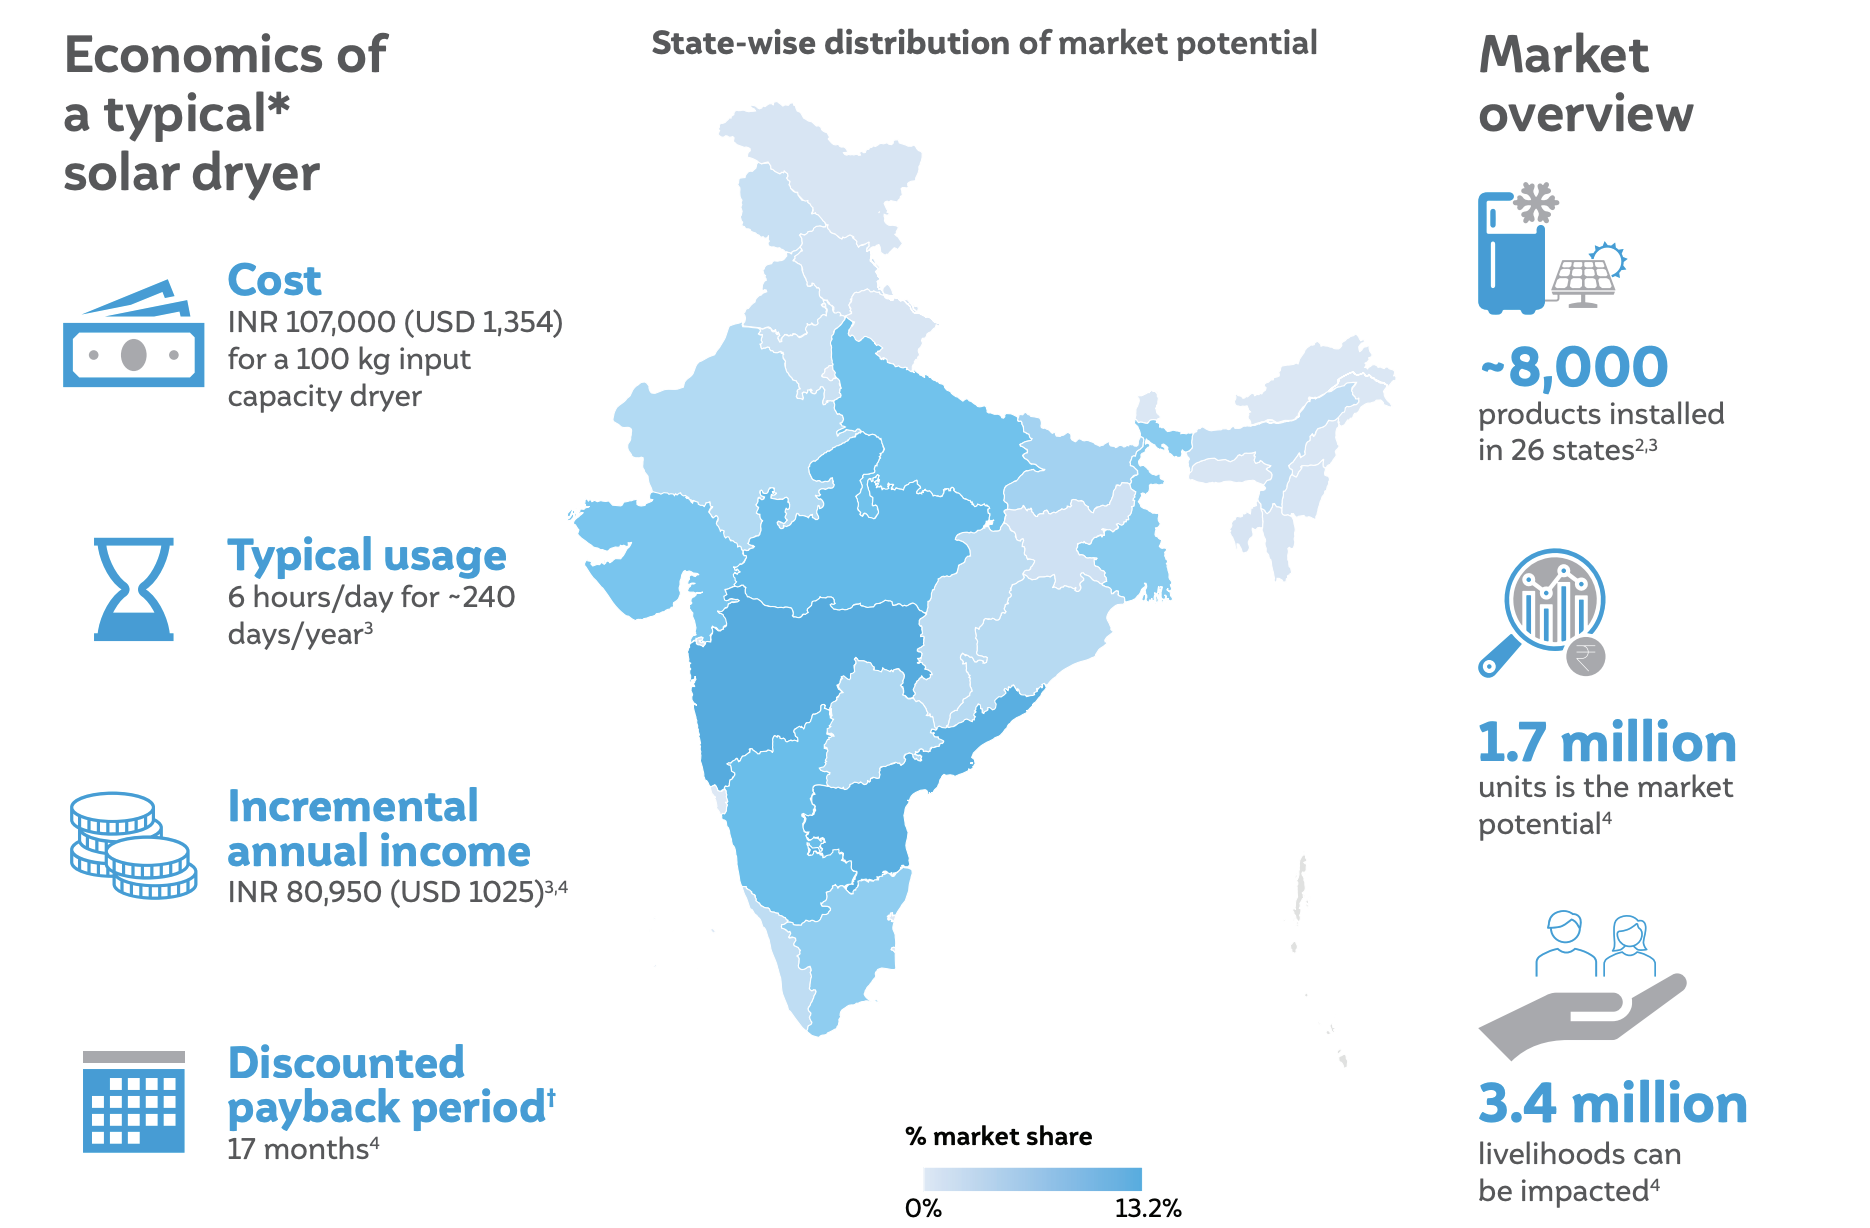
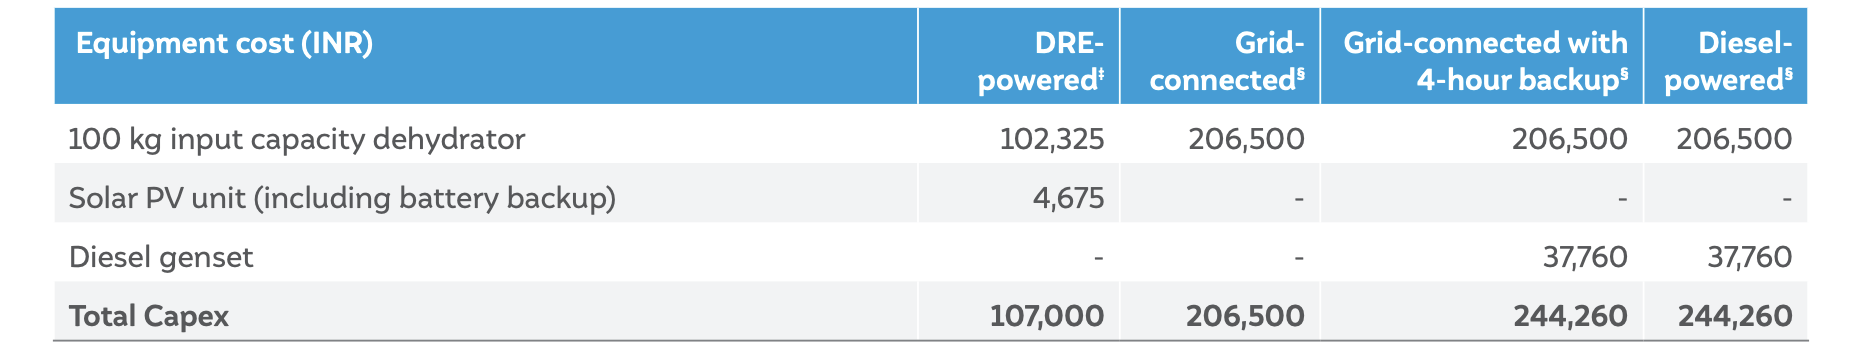
The incremental income and associated payback period are based on the average or median values. The incremental annual income from the dried commodity varies from INR 48,000 for low-value commodities such as spinach to INR 105,000 for high-value commodities such as black grapes and mangoes. Many users with incomes lower than average or median income would have much longer payback periods. Accordingly, such users may need support through product subsidies or longer-tenure loans.
 Source: Authors’ analysis
‡ The power rating of the DRE-powered product is 0.04 kW, only to run small DC fans. Details considered are sourced from the manufacturers.
§ A 100 kg electric dehydrator has a typical power rating of 6 kW. Details listed are as indicated on IndiaMART (last accessed in August 2022).
 Source: Authors’ analysis
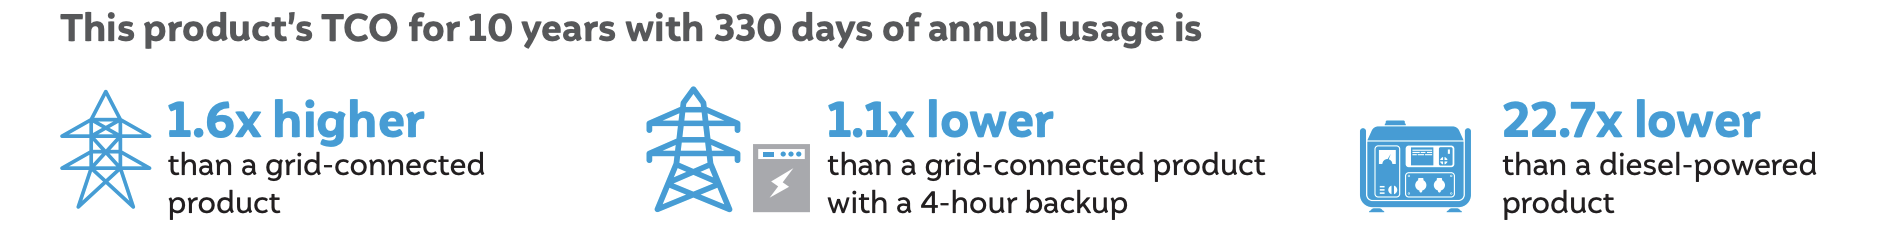
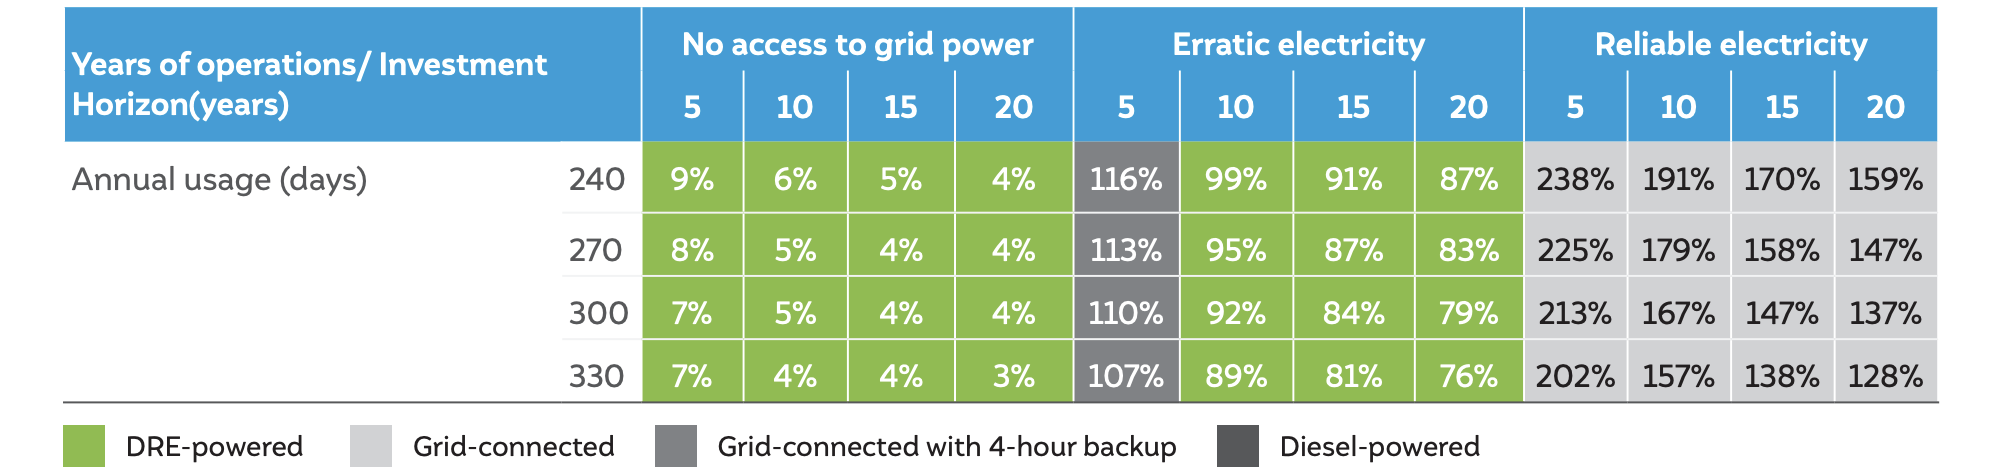
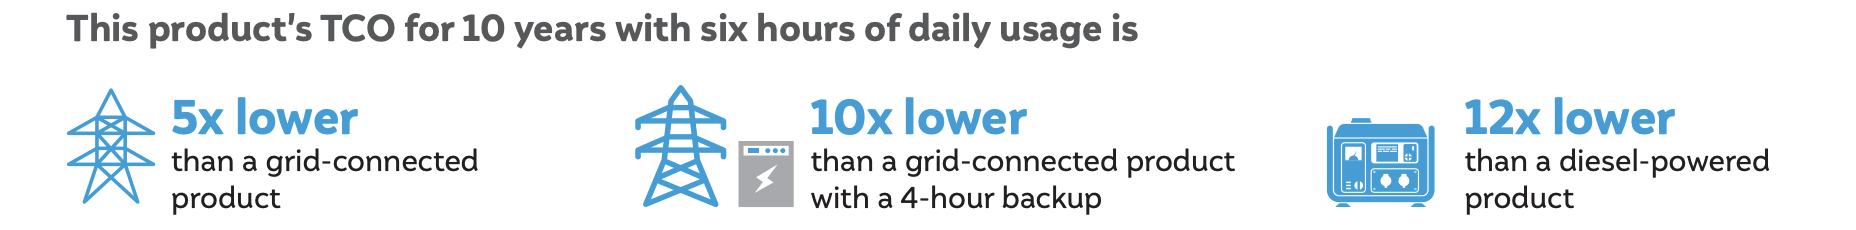
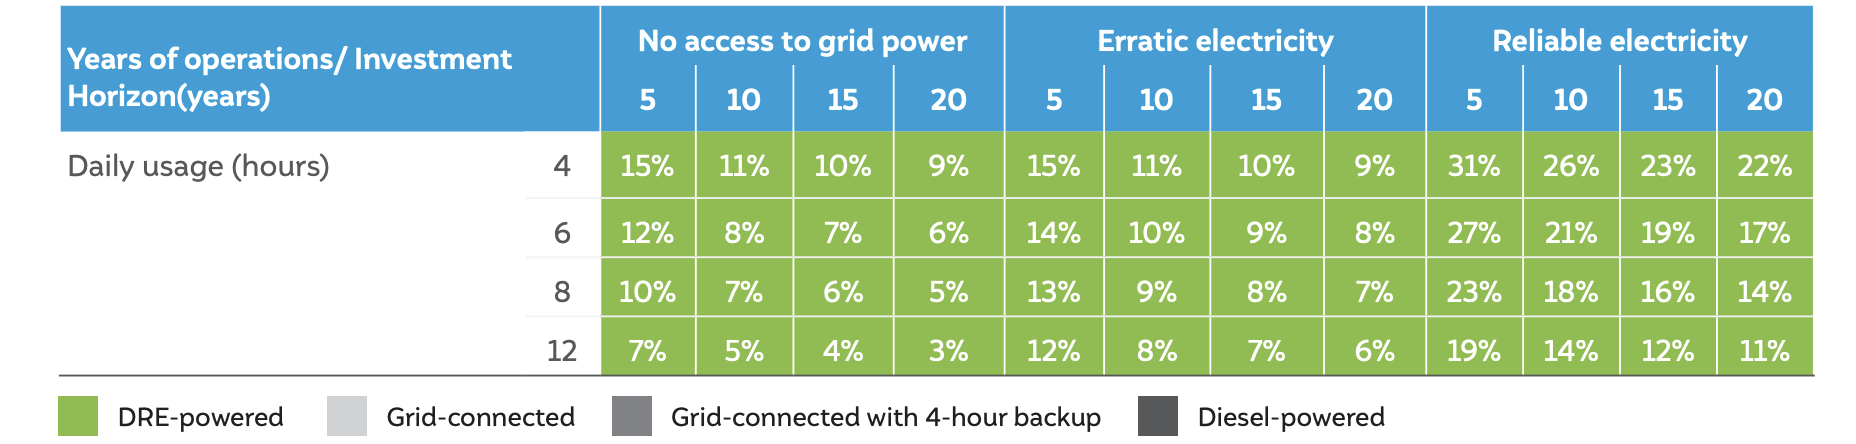
We compare the TCO†† of DRE-powered products with that of other variants under different scenarios of power availability and daily usage durations for various investment horizons.

In the table below, the cell’s color represents the financially-preferable product variant. Whereas, the cell values denote the ratio of DRE-powered product’s TCO compared to the other product variant’s TCO in percentage terms.
Source: Authors’ analysis
The comparative analysis of TCO shows that the solar dryer/dehydrator is financially more attractive than the other product variant across all power availability and usage scenarios.
 Source: Authors’ analysis
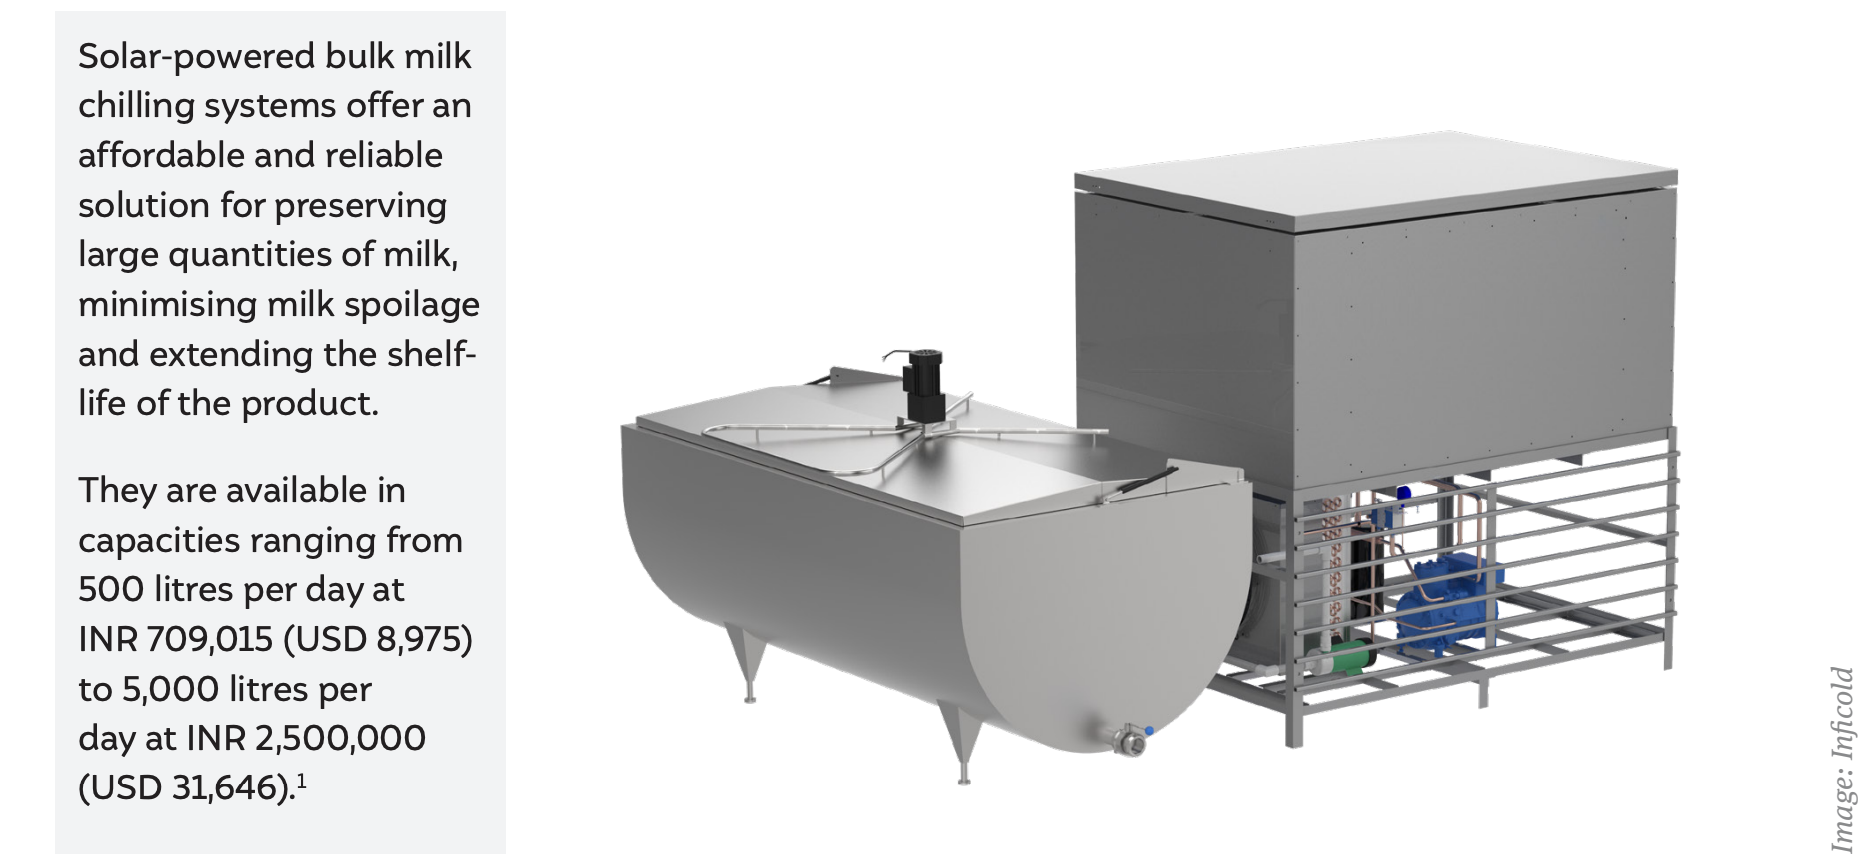
The incremental income and associated payback period are based on the average or median values. An entrepreneur with a bulk milk chiller has an annual income potential of INR 173,000–247,500 depending on the utilisation of the milk chiller throughout the year (varying from 70–100 per cent). Many users with incomes lower than average or median income would have much longer payback periods. Accordingly, such users may need support through product subsidies or longer-tenure loans.
 Source: Authors’ analysis
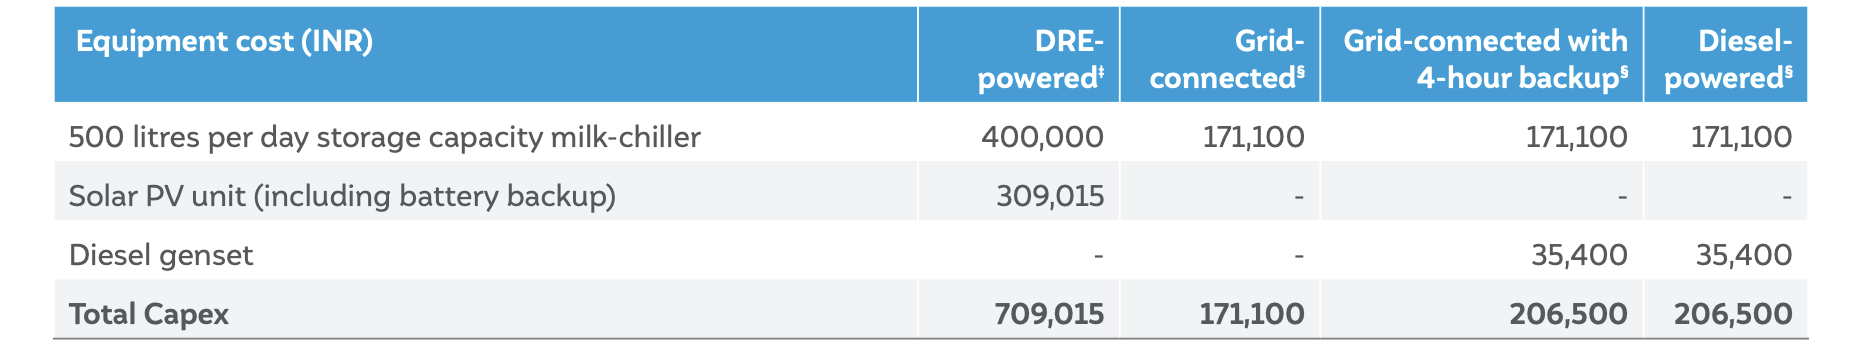
‡ The power rating of the DRE-powered milk chiller is 2.66 kW. Details considered are sourced from the manufacturers.
§ A 500 litre storage capacity electric milk-chiller has a typical power rating of 1.68 kW. Details listed are as indicated on IndiaMART (last accessed in August 2022).
 Source: Authors’ analysis
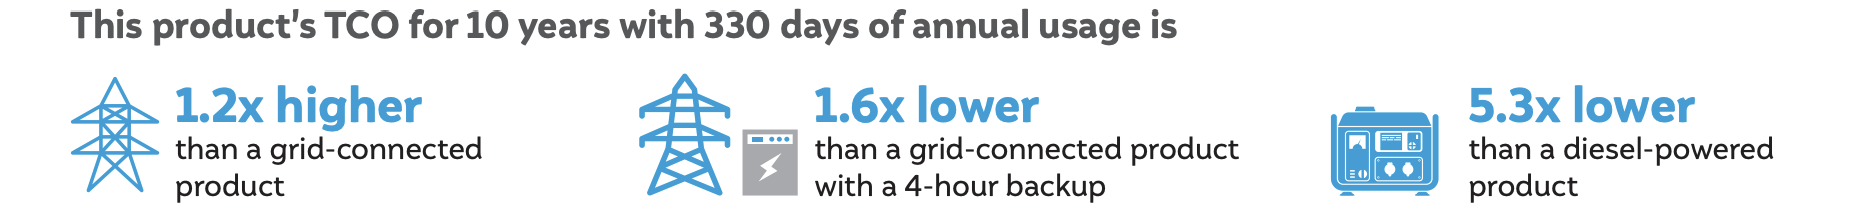
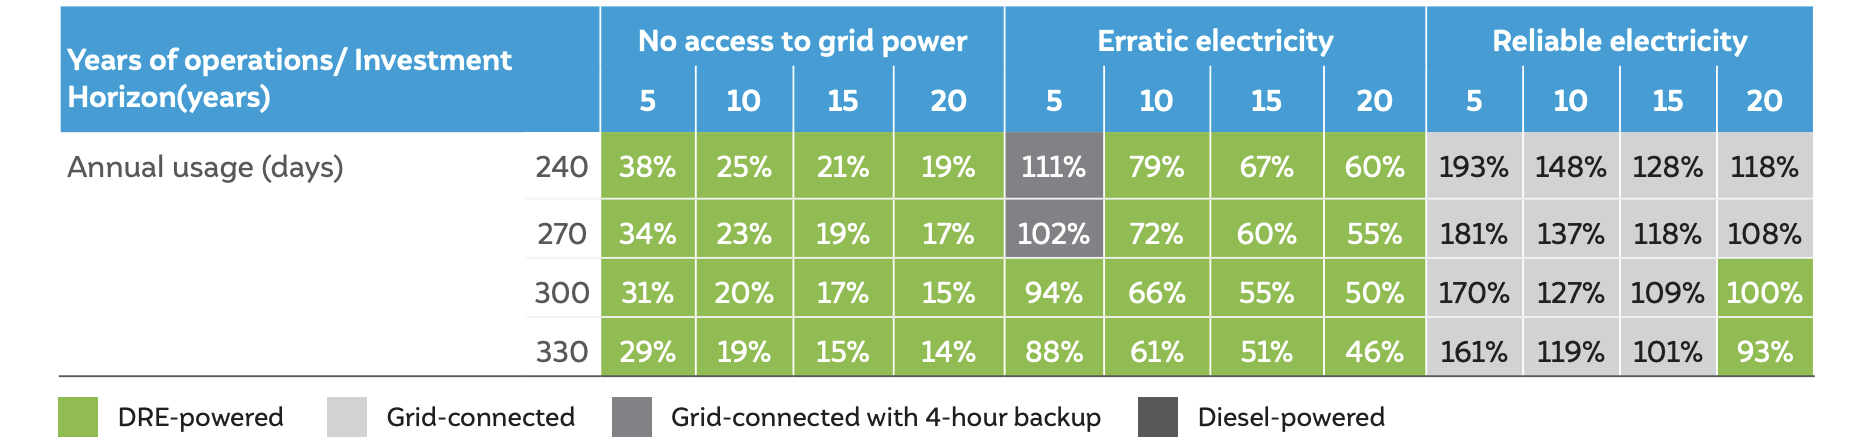
We compare the TCO†† of DRE-powered products with that of other variants under different scenarios of power availability and daily usage durations for various investment horizons.

In the table below, the cell’s color represents the financially-preferable product variant. Whereas, the cell values denote the ratio of DRE-powered product’s TCO compared to the other product variant’s TCO in percentage terms.
 Source: Authors’ analysis
The comparative analysis of TCO shows that the DRE variant is financially more attractive than the other product variant in regions with no or erratic electricity. Grid-connected variant is financially preferable in regions with reliable electricity.
 Source: Authors’ analysis
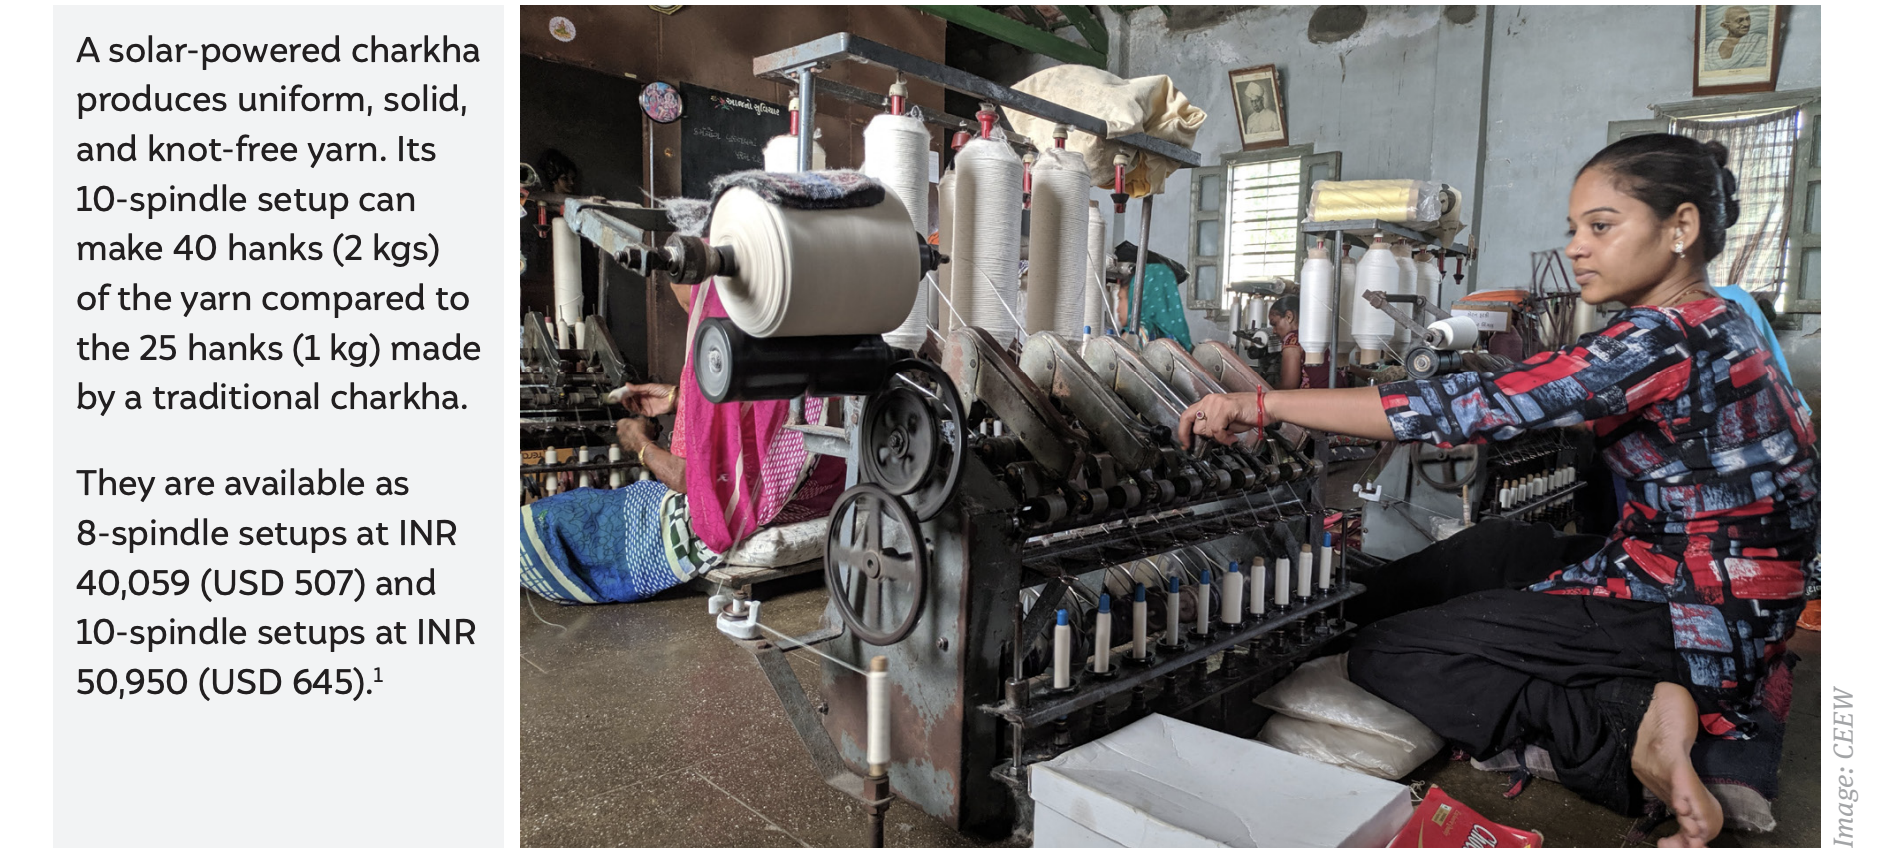
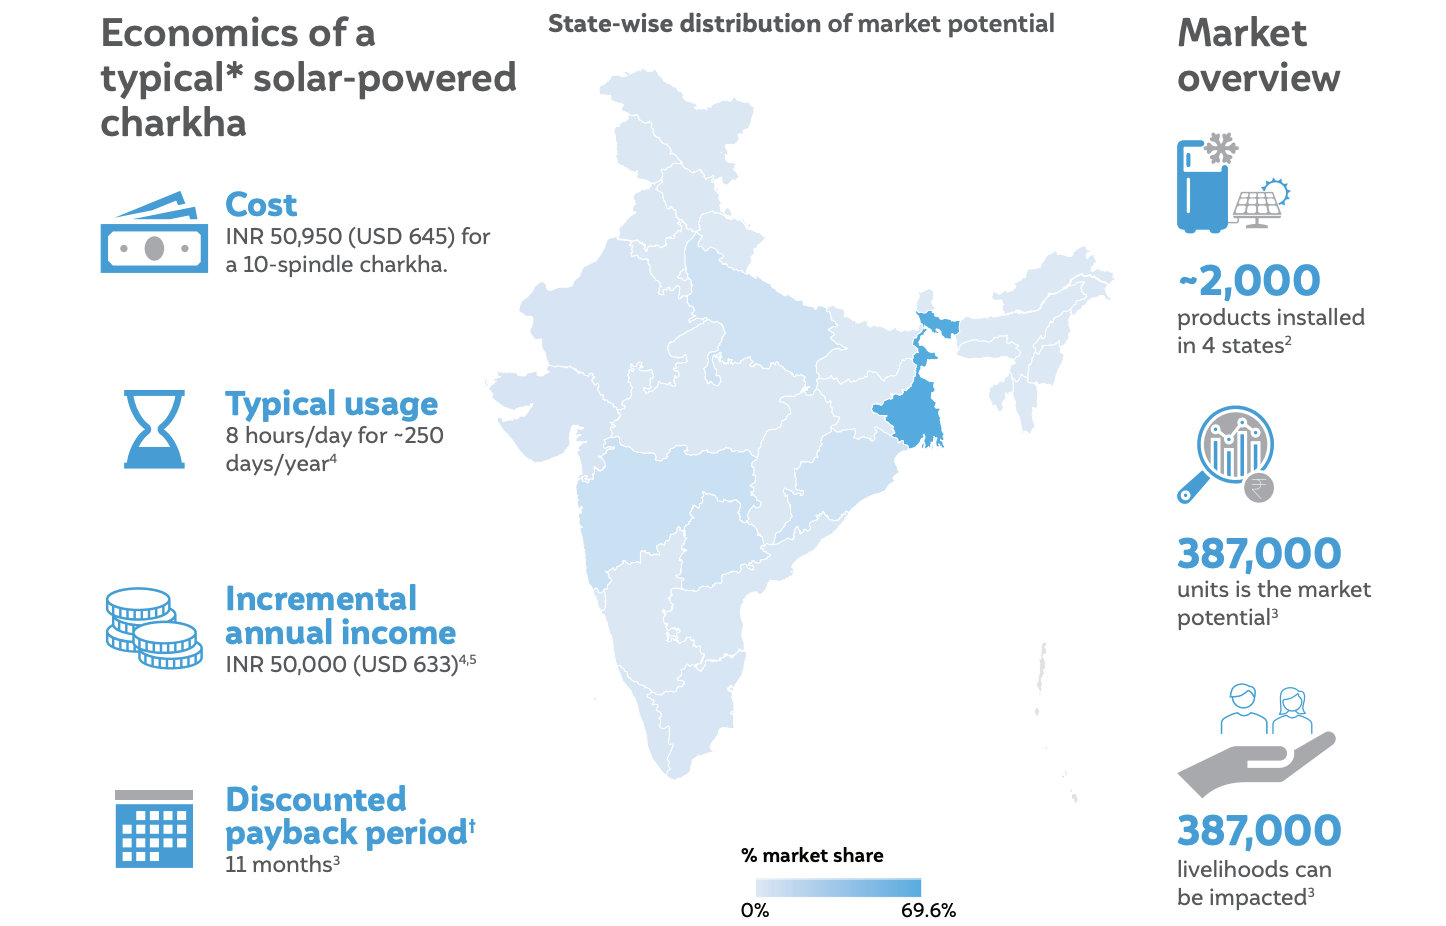
The incremental income and associated payback period are based on the average or median values. The income potential for charkha users varies from INR 25,000 to INR 75,000, depending upon the raw material’s cost and quality. Many users with incomes lower than average or median income would have much longer payback periods. Accordingly, such users may need support through product subsidies or longer-tenure loans.
 Source: Authors’ analysis
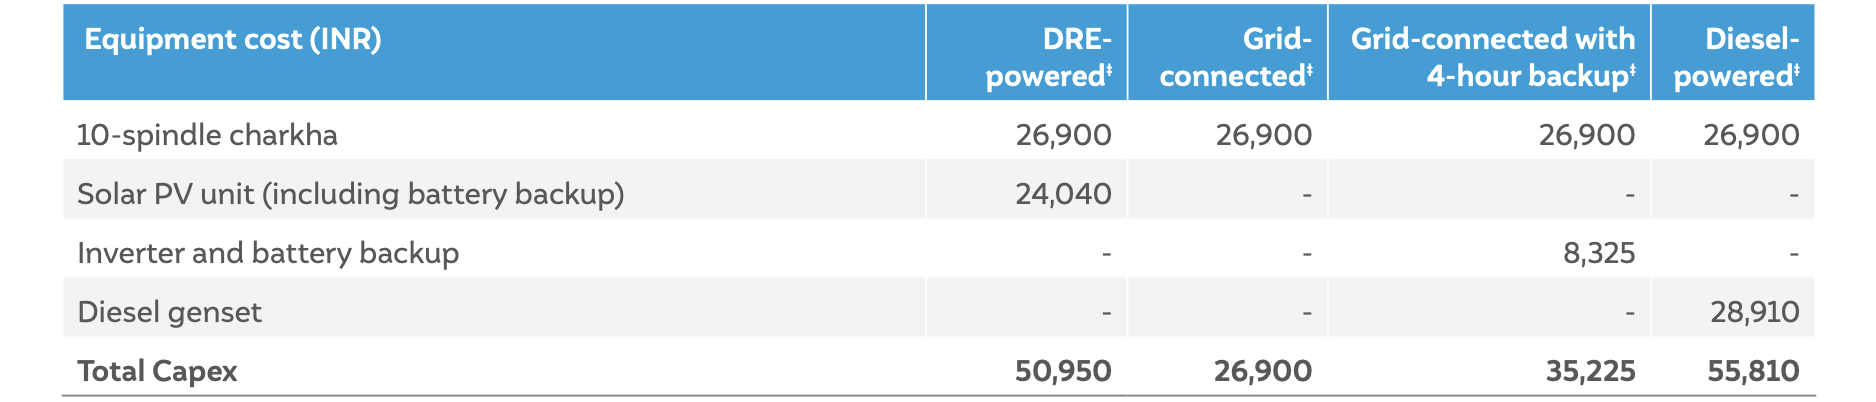
‡ The power rating of both DRE-powered and electric charkha is 0.07 kW. Details considered are sourced from the manufacturers.
 Source: Authors’ analysis
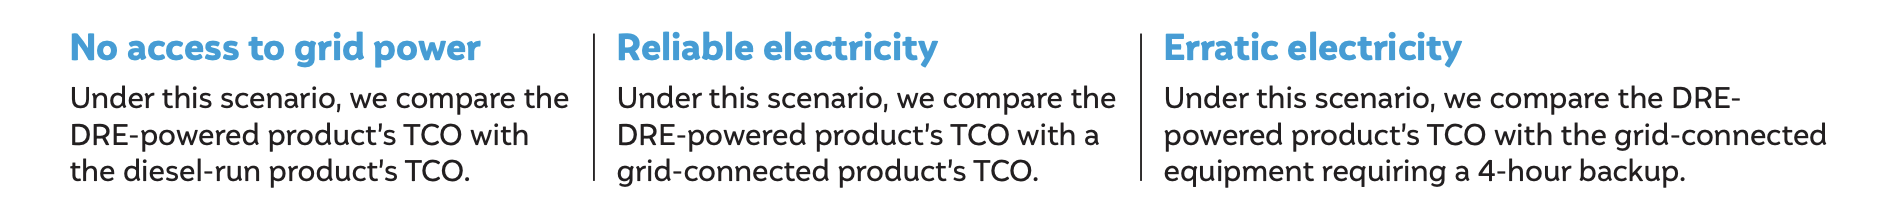
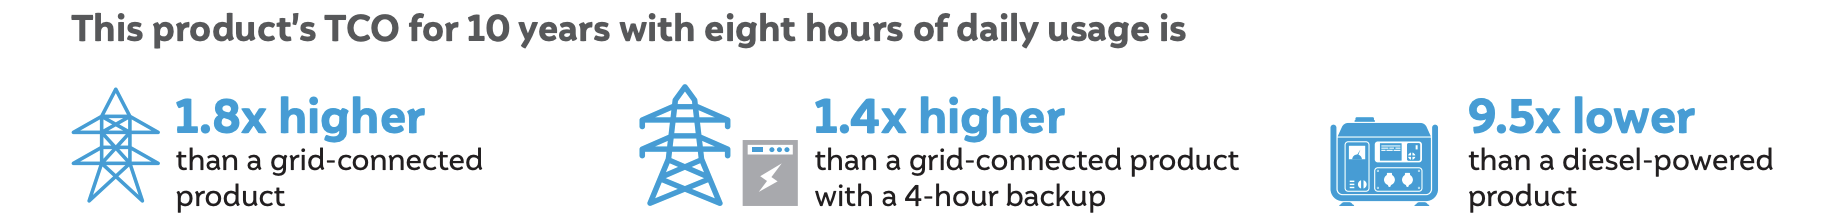
In the table below, the cell’s colour represents the financially-preferable product variant. Whereas, the cell values denote the ratio of DRE-powered product’s TCO compared to the other product variant’s TCO in percentage terms.
Source: Authors’ analysis
The comparative analysis of TCO shows that the DRE variant is financially more attractive than the other product variant in regions with no access to electricity. Grid-connected variant is financially preferable in regions with reliable or erratic electricity.
 Source: Authors’ analysis
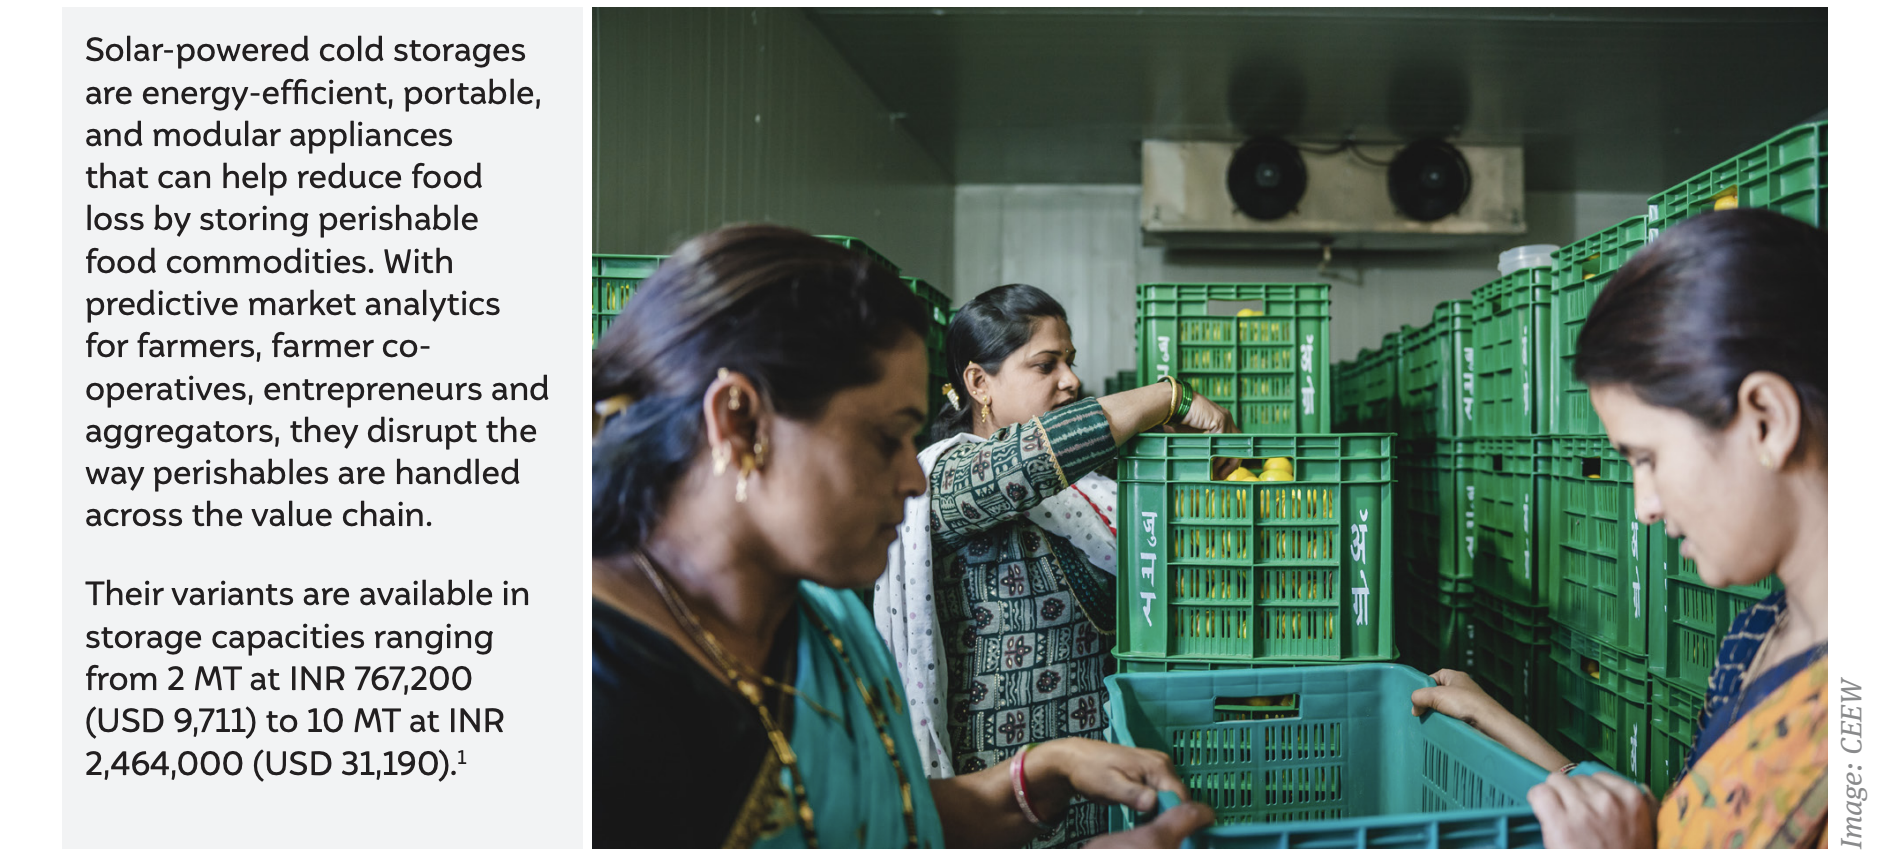
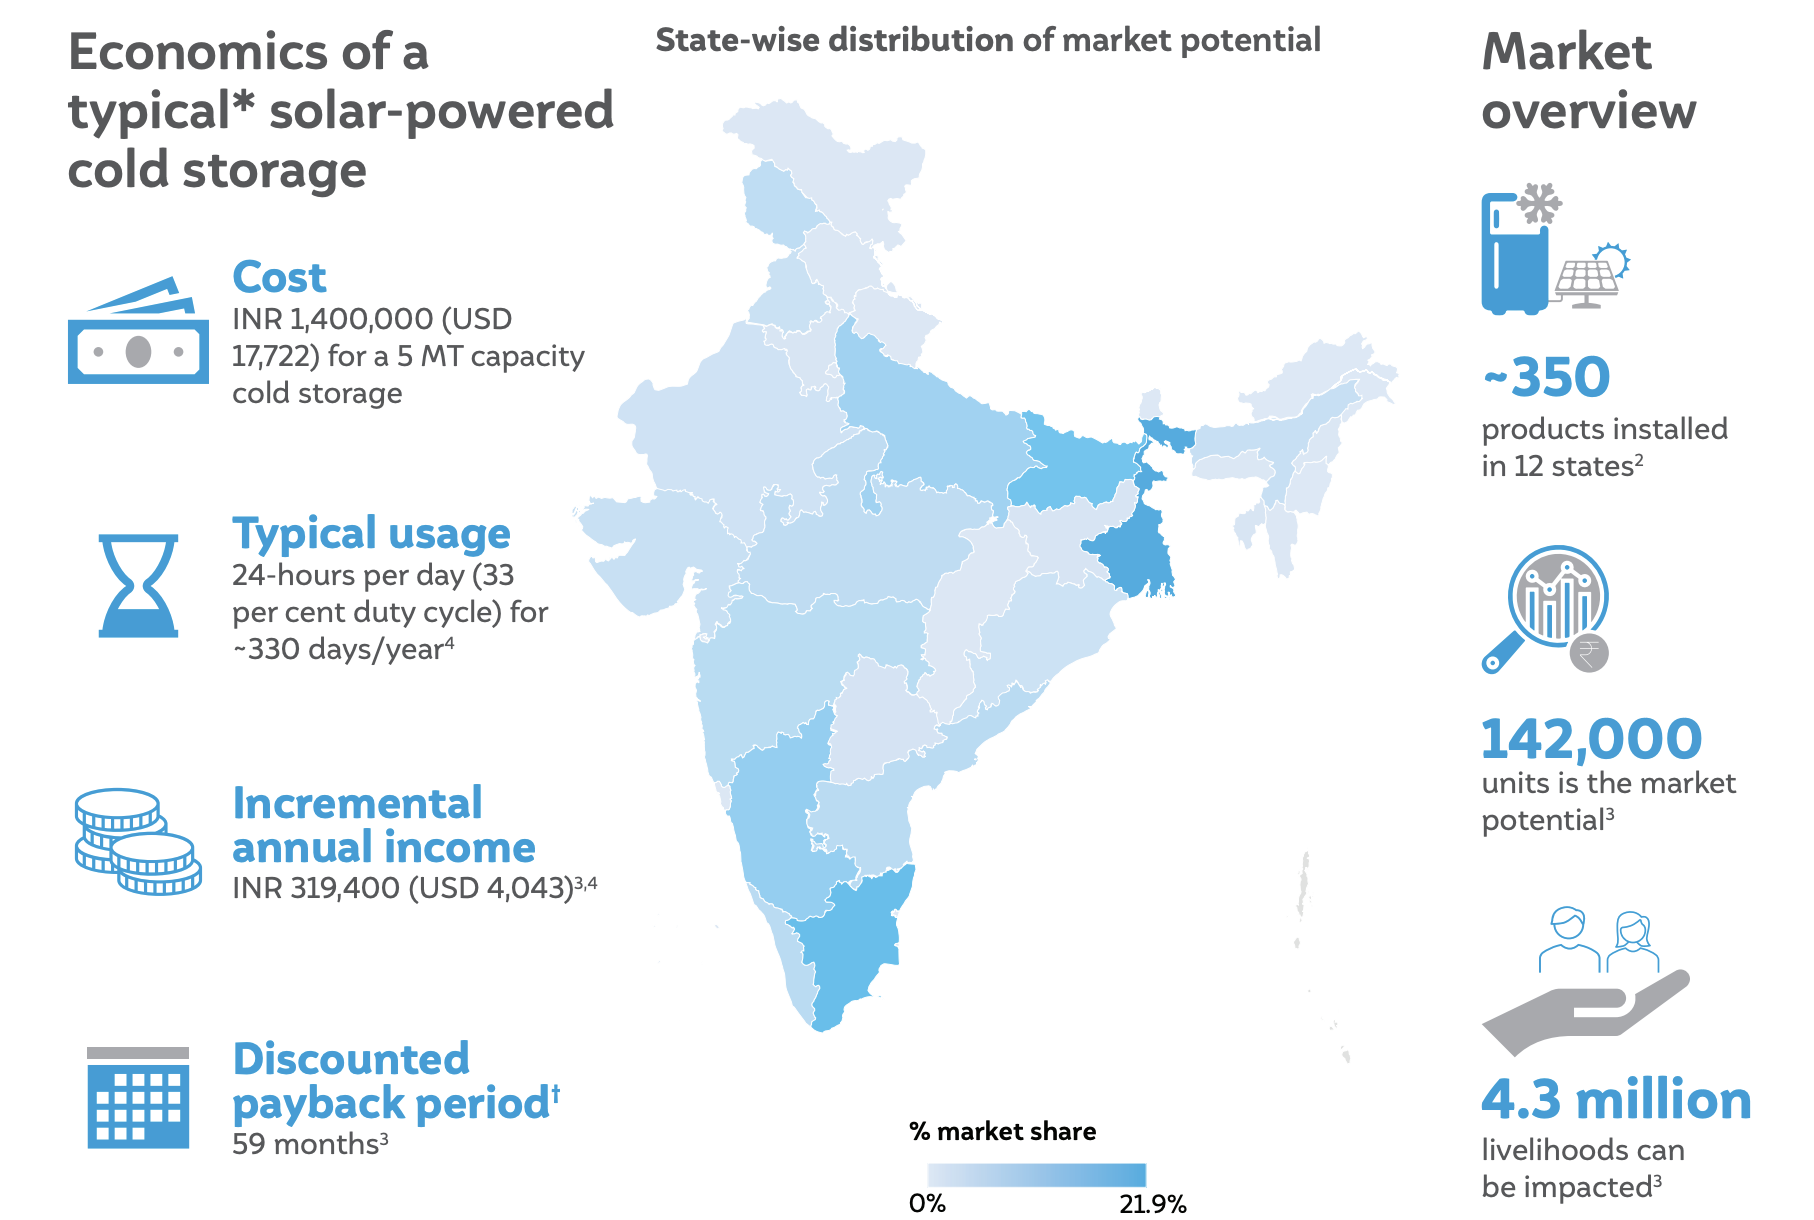
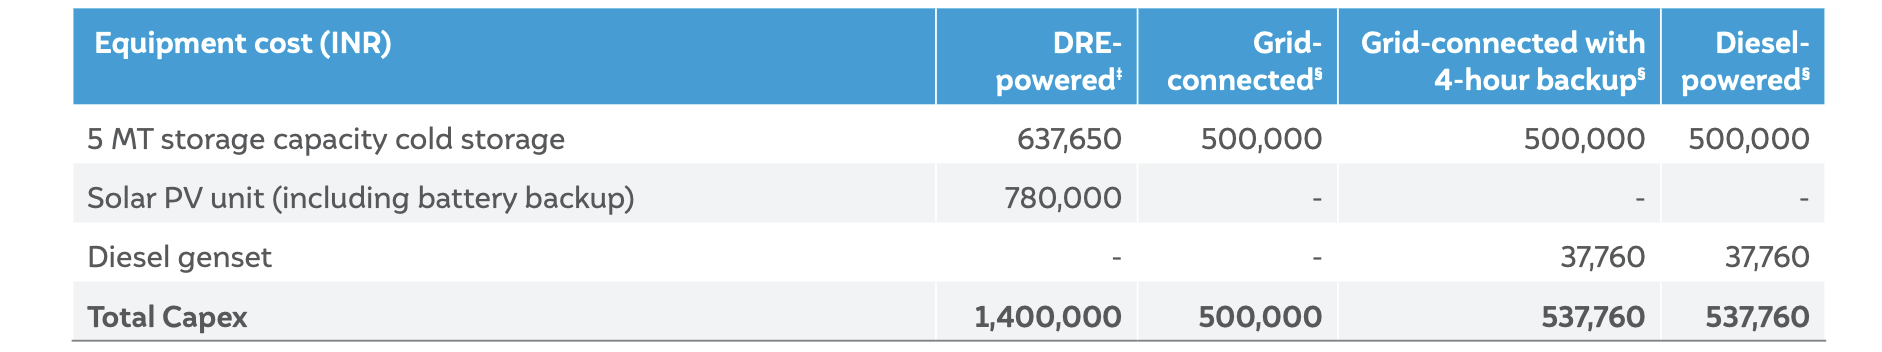
The incremental income and associated payback period are based on the average or median values. Cold storage operators can potentially earn an annual income of INR 273,750–365,500 depending on the utilisation of the cold storage throughout the year (varying from 60–80 per cent). Many users with incomes lower than average or median income would have much longer payback periods. Accordingly, such users may need support through product subsidies or longer-tenure loans.
 Source: Authors’ analysis
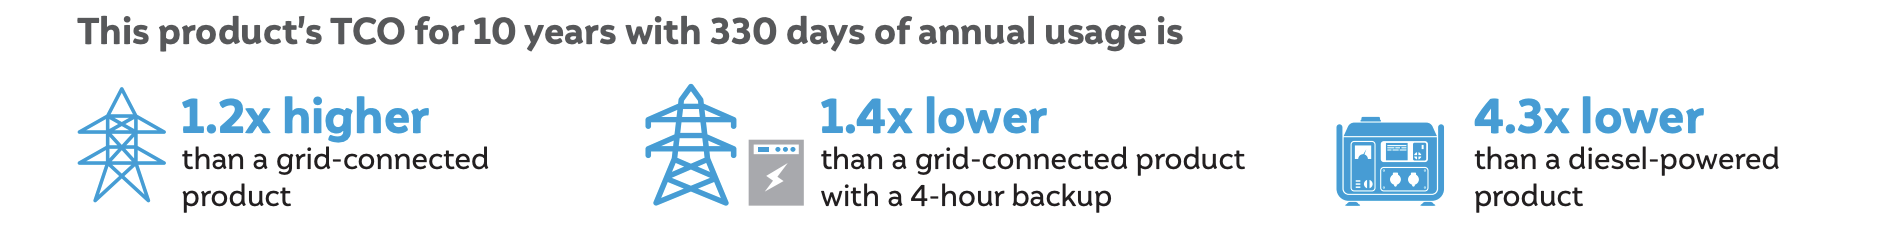 Source: Authors’ analysis
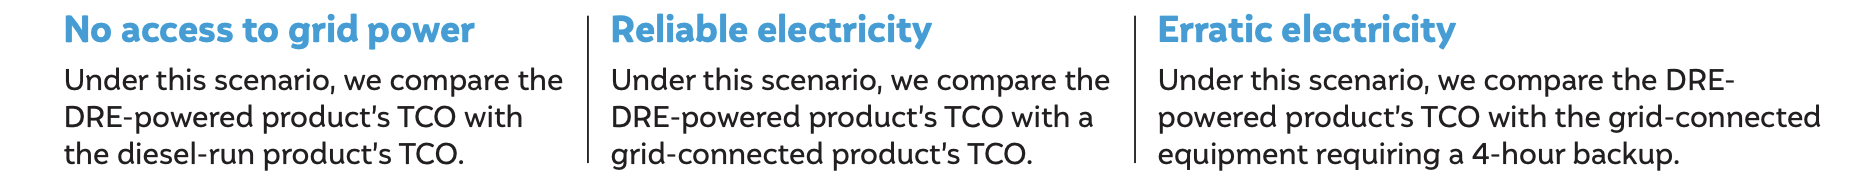
When is this DRE-powered product financially preferable?
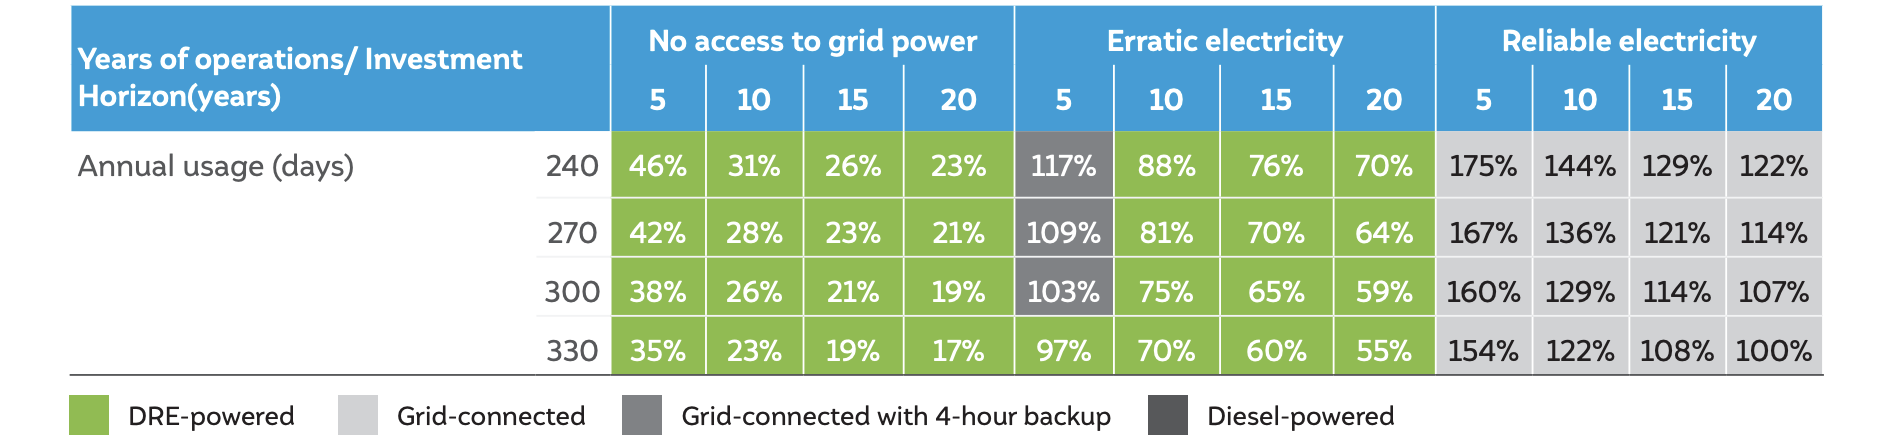
We compare the TCO†† of DRE-powered products with that of other variants under different scenarios of power availability and daily usage durations for various investment horizons.

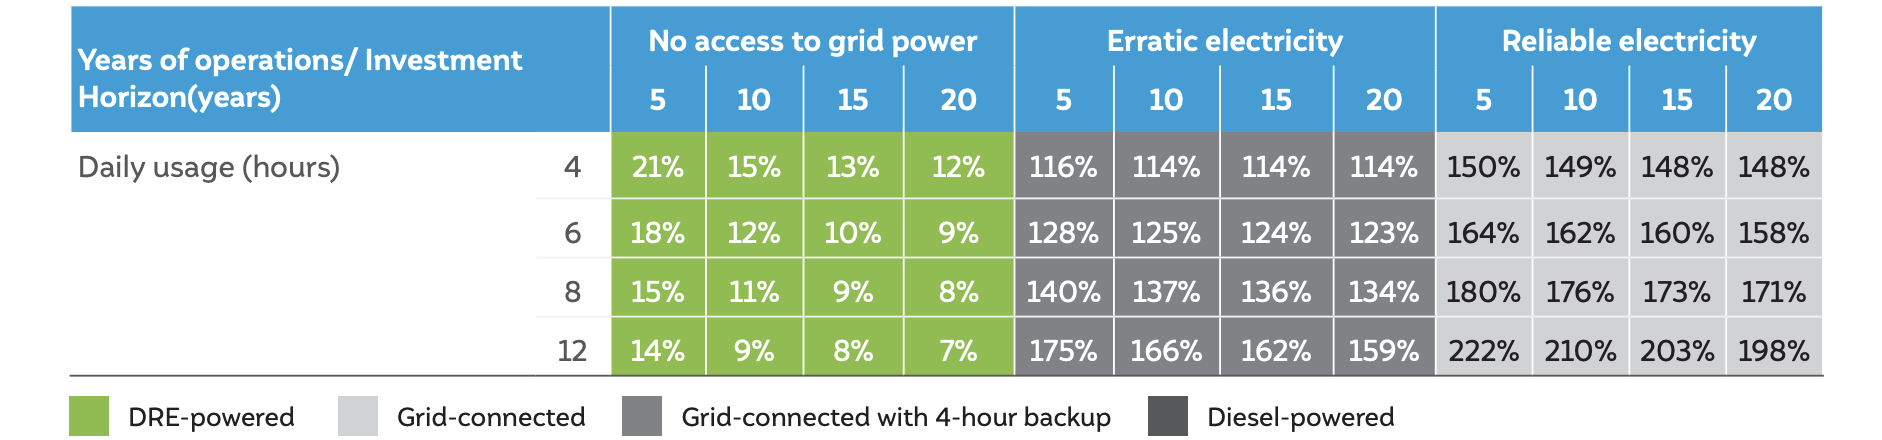
In the table below, the cell’s colour represents the financially-preferable product variant. Whereas, the cell values denote the ratio of DRE-powered product’s TCO compared to the other product variant’s TCO in percentage terms.
 Source: Authors’ analysis
The comparative analysis of TCO shows that the DRE variant is financially more attractive than the other product variant in regions with no access to electricity. In regions of erratic electricity, the DRE variant is financially more attractive than the other product variant for an investment horizon of ten years and more. Grid-connected variant is financially preferable in regions with reliable electricity.
 Source: Authors’ analysis
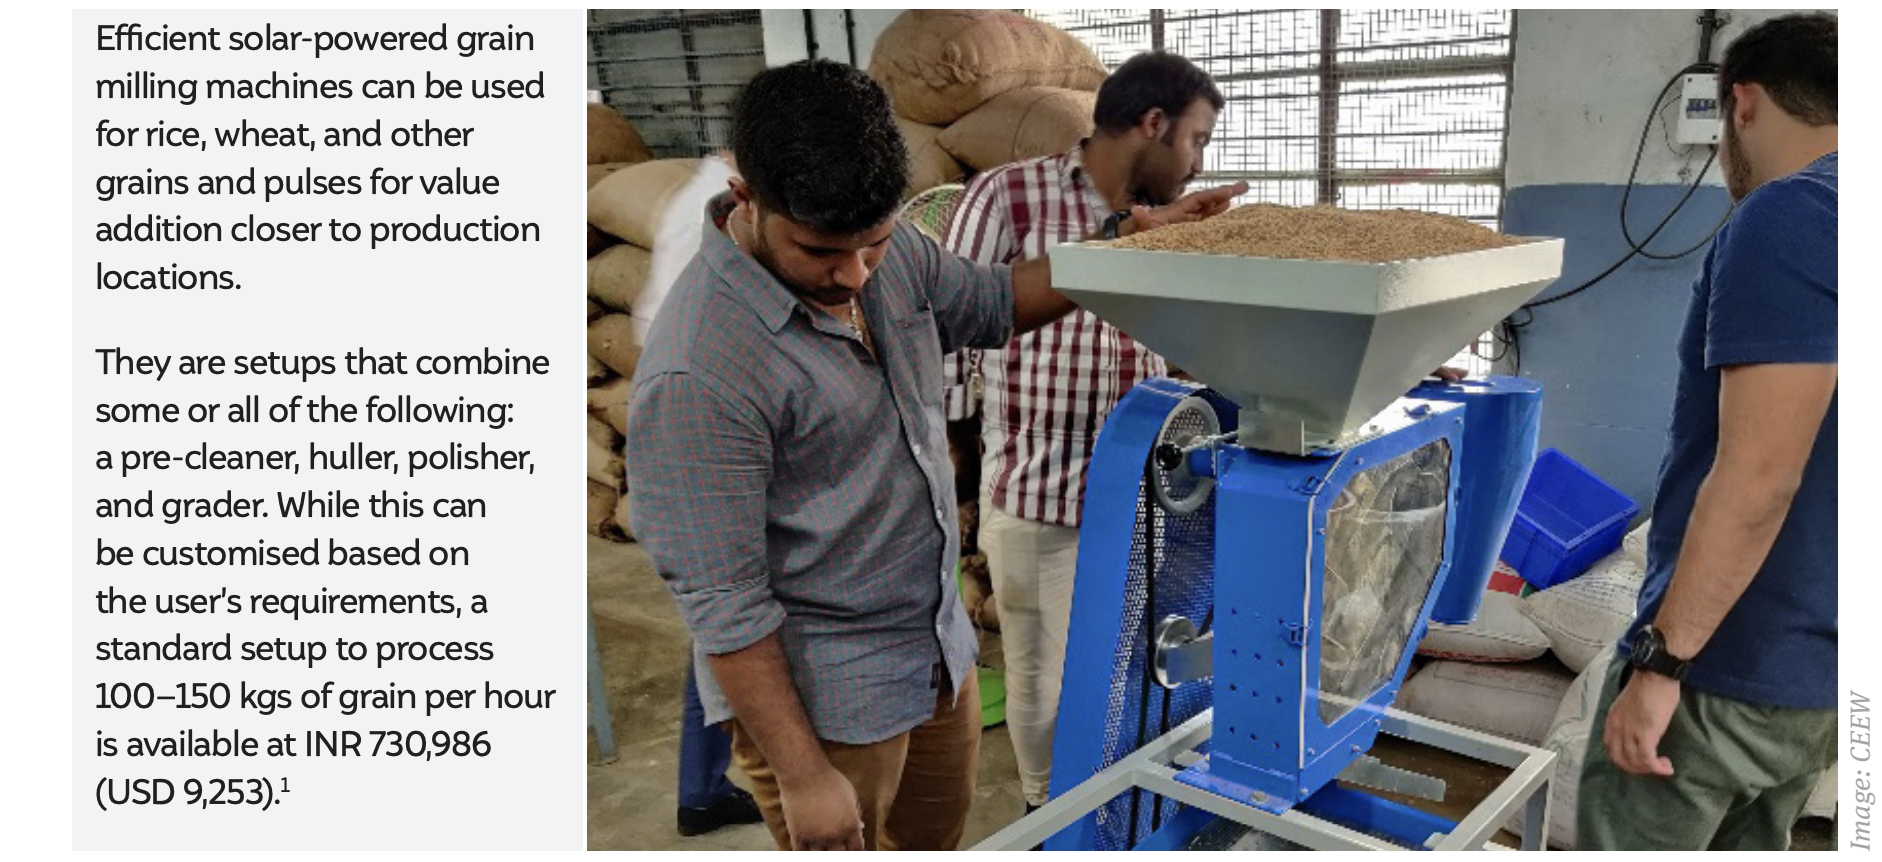
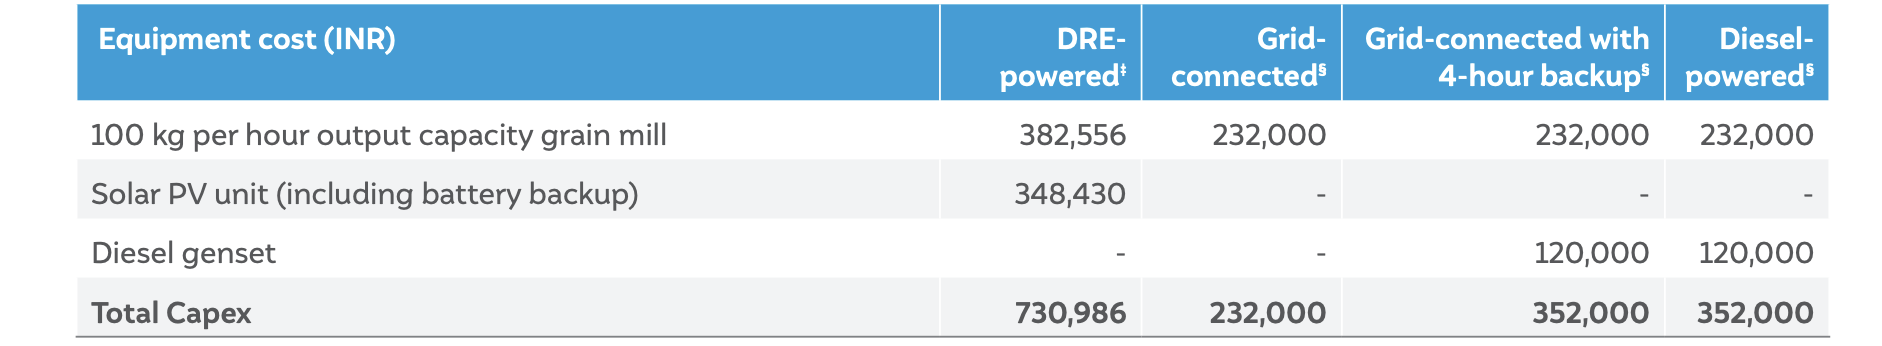
The incremental income and associated payback period are based on the average or median values. Income potential from a grain mill varies from INR 38,400 in a 100-household village to INR 480,000 in a 1,250-household village. Many users with incomes lower than average or median income would have much longer payback periods. Accordingly, such users may need support through product subsidies or longer-tenure loans.
 Source: Authors’ analysis
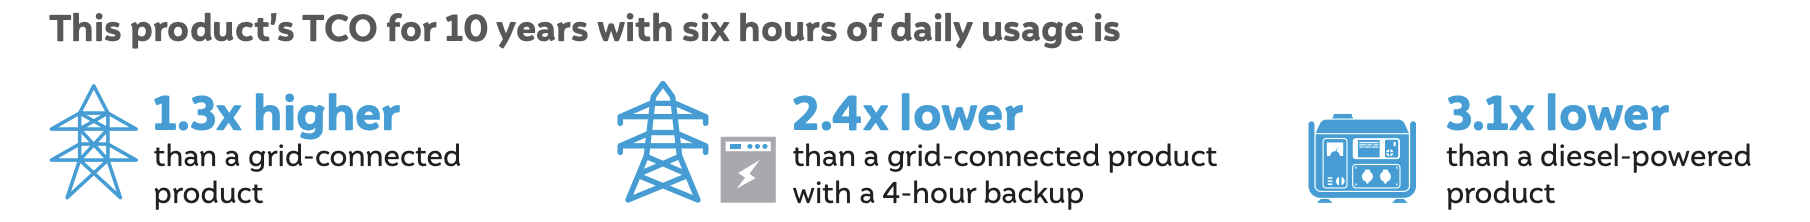 Source: Authors’ analysis
We compare the TCO†† of DRE-powered products with that of other variants under different scenarios of power availability and daily usage durations for various investment horizons.
In the table below, the cell’s color represents the financially-preferable product variant. Whereas, the cell values denote the ratio of DRE-powered product’s TCO compared to the other product variant’s TCO in percentage terms.
 Source: Authors’ analysis
The comparative analysis of TCO shows that the DRE variant is financially more attractive than the other product variant in regions with no or erratic electricity. Grid-connected variant is financially preferable in regions with reliable electricity.
 Source: Authors’ analysis
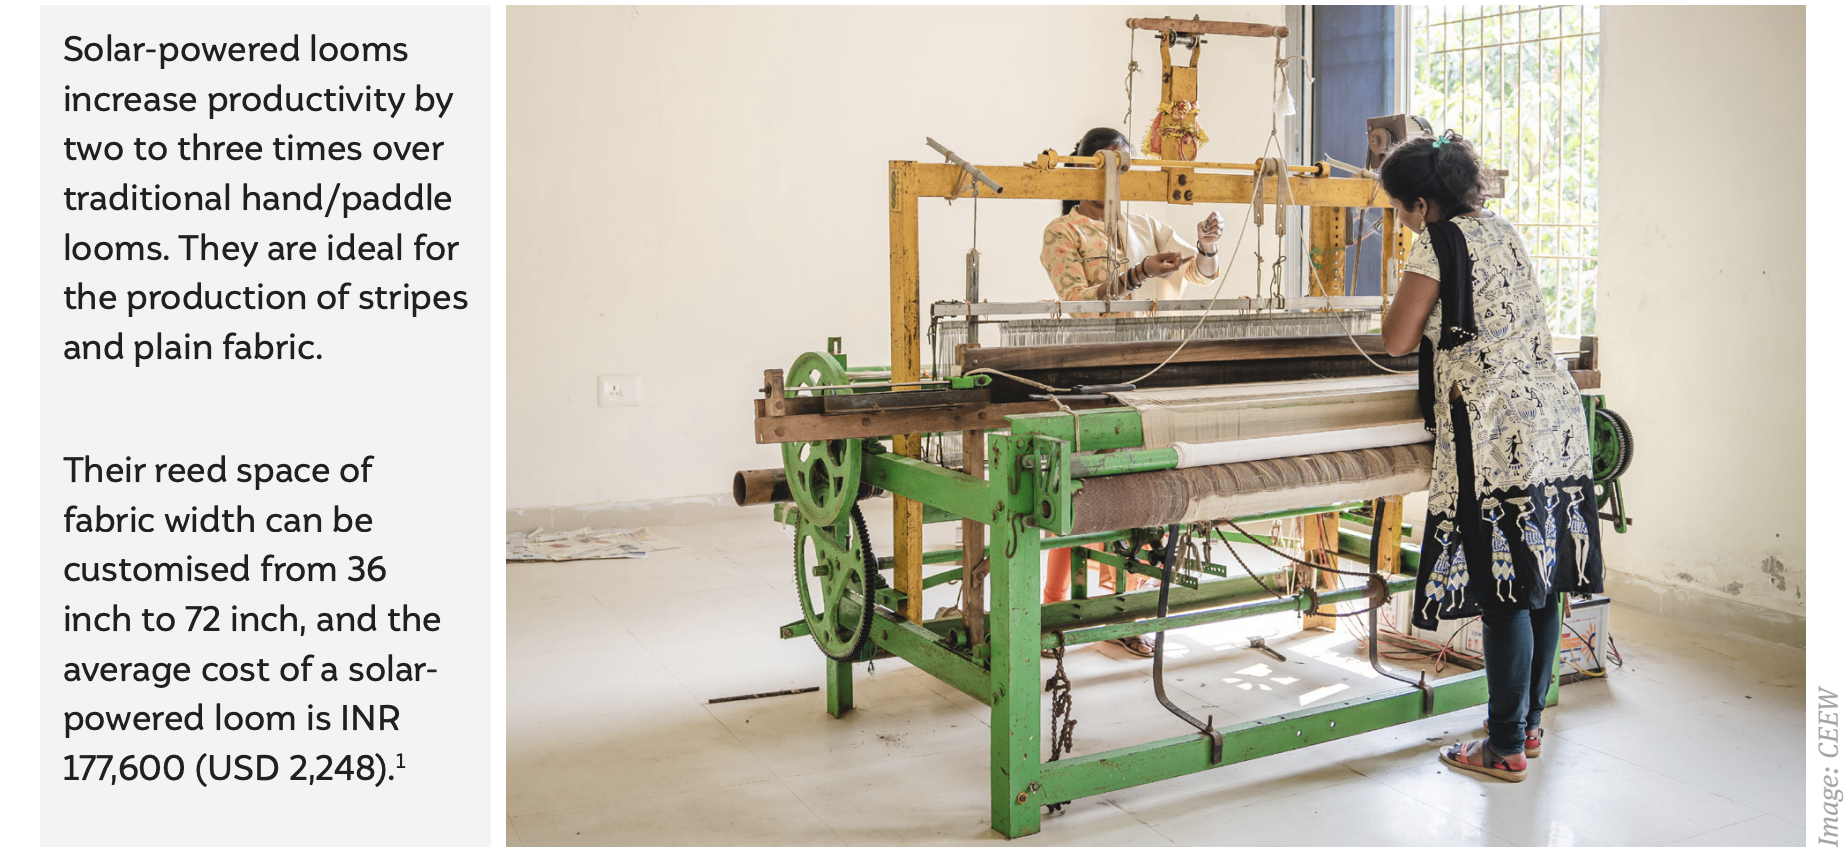
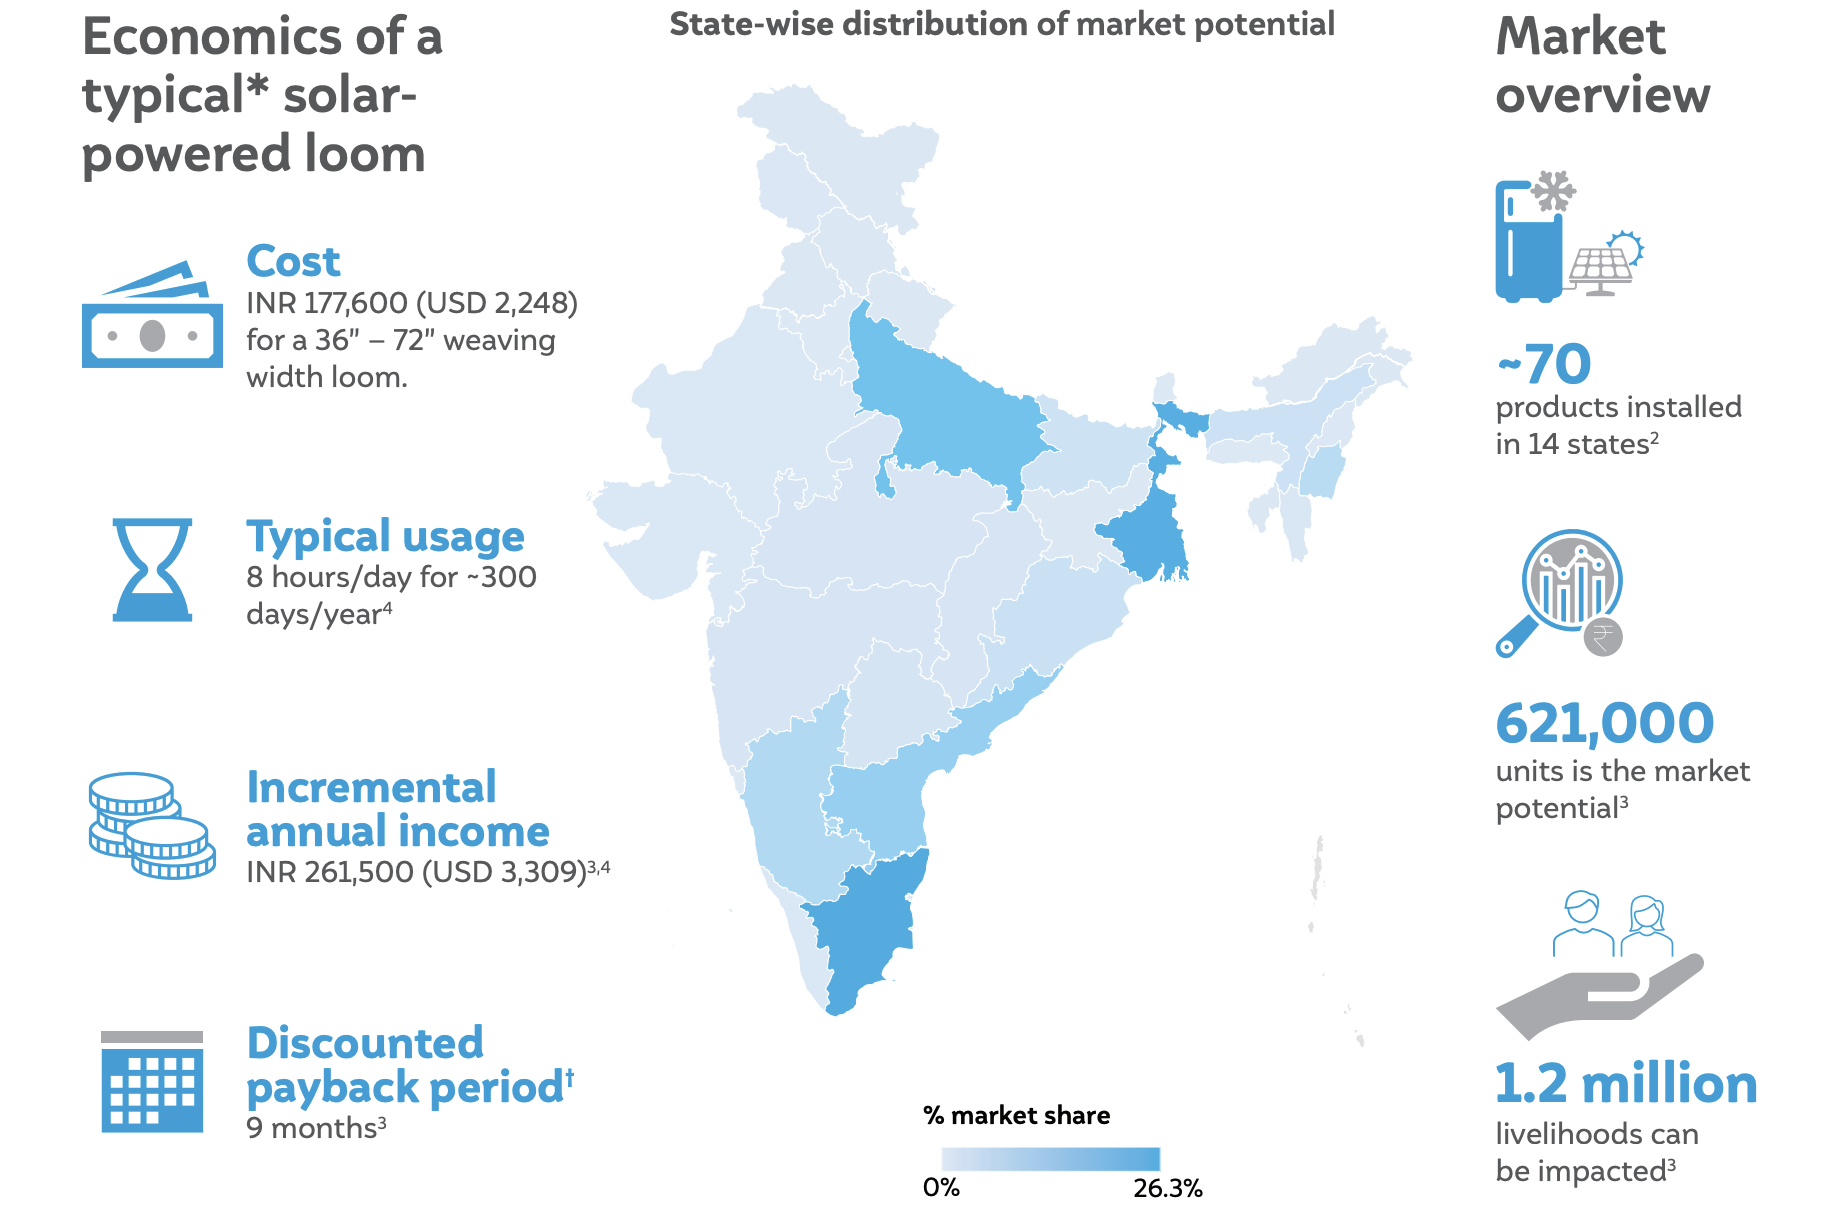
The incremental income and associated payback period are based on the average or median values. The income potential for the solar-powered loom users varies from INR 193,000 to INR 334,000 depending upon the raw material’s cost and quality. Many users with incomes lower than average or median income would have much longer payback periods. Accordingly, such users may need support through product subsidies or longer-tenure loans.
 Source: Authors’ analysis
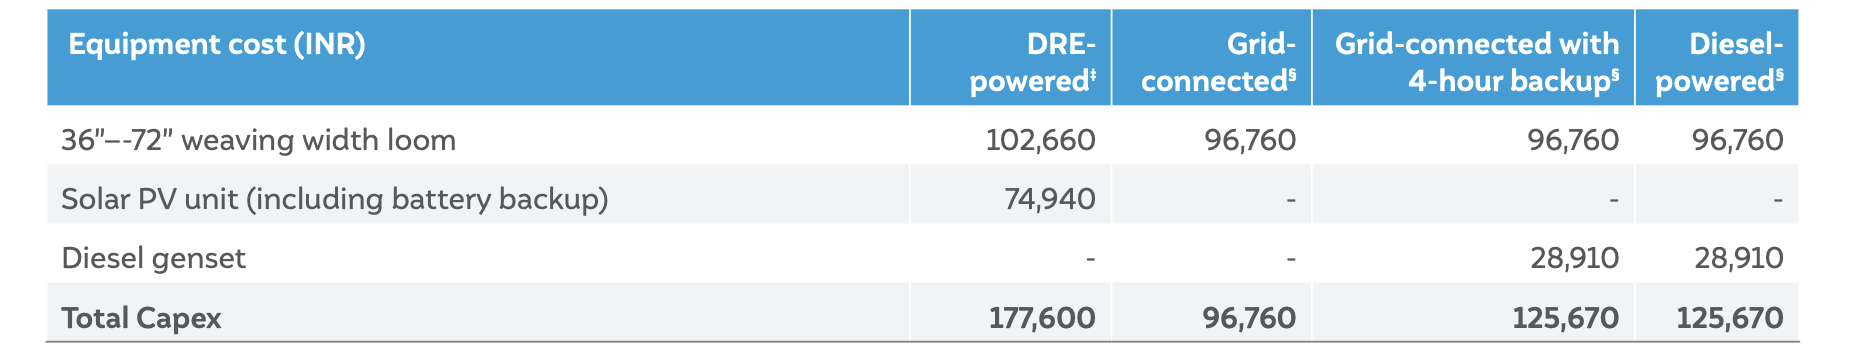
‡ The power rating of the DRE-powered loom is 0.2 kW. Details considered are sourced from the manufacturers.
§ A 36”–-72” weaving width power loom has a typical power rating of 1.5 kW. Details listed are as indicated on IndiaMART (last accessed in August 2022).
 Source: Authors’ analysis
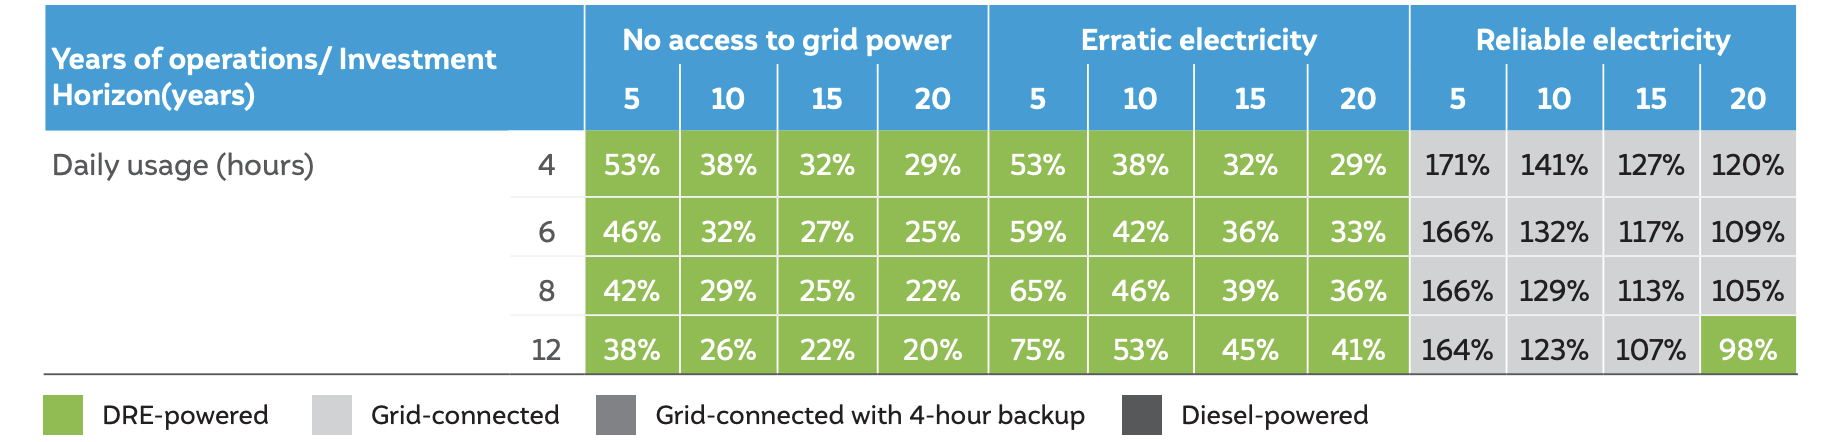
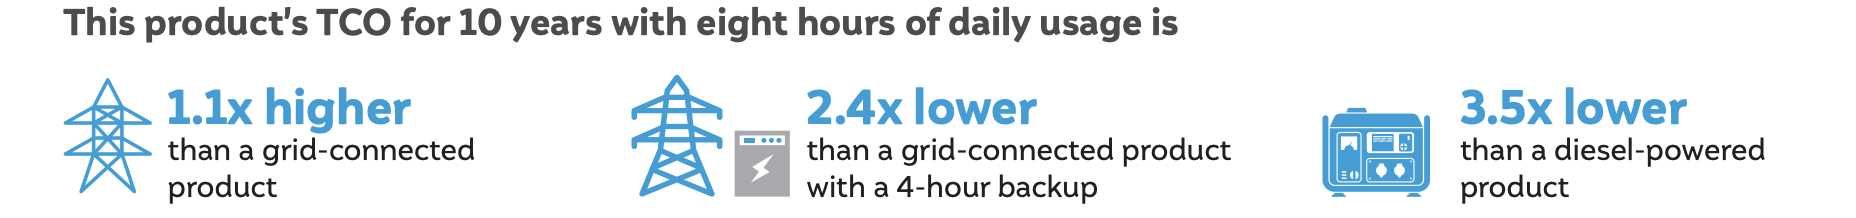
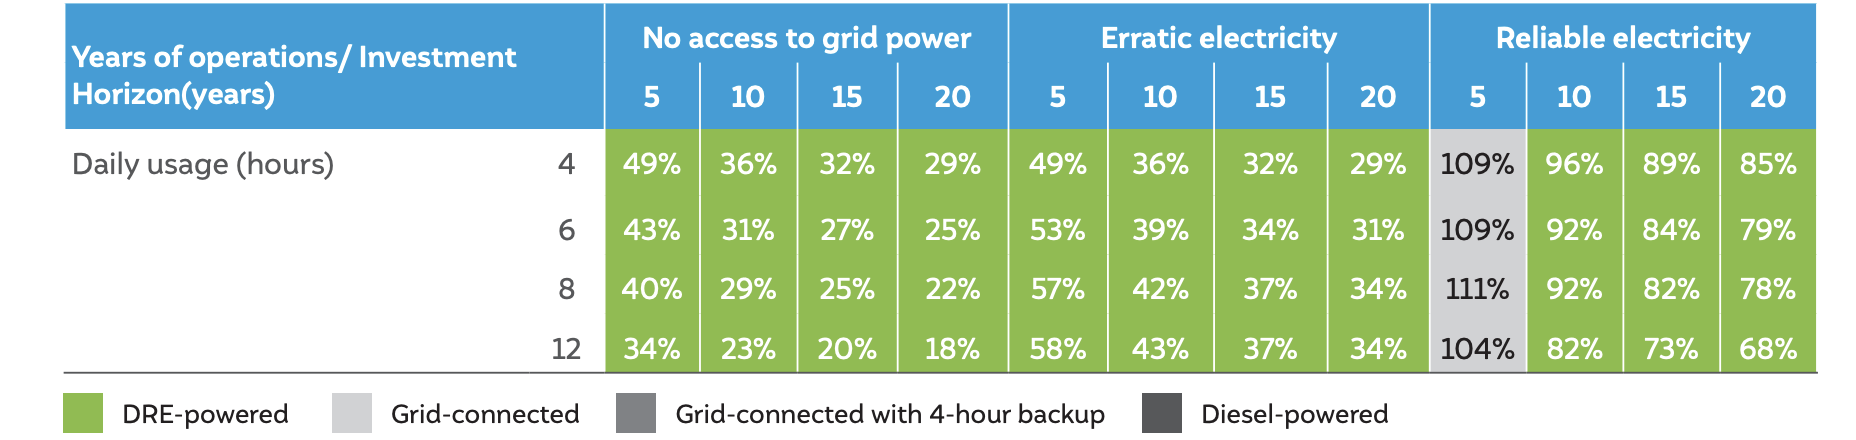
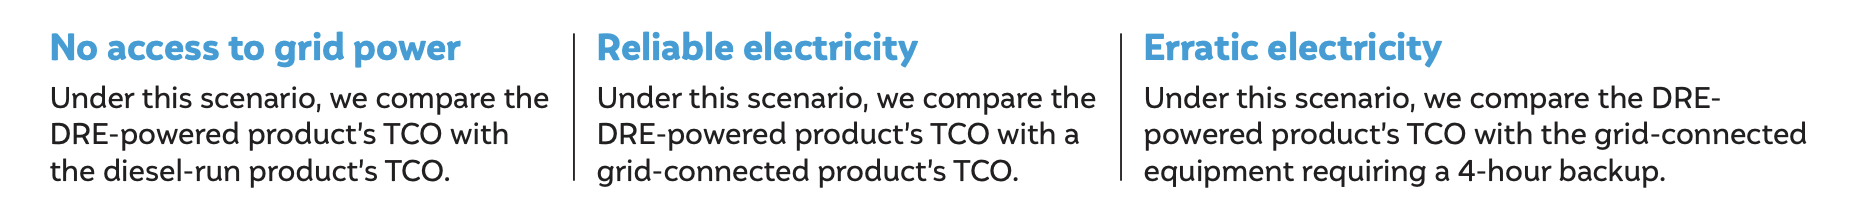
We compare the TCO†† of DRE-powered products with that of other variants under different scenarios of power availability and daily usage durations for various investment horizons.
In the table below, the cell’s colour represents the financially-preferable product variant. Whereas, the cell values denote the ratio of DRE-powered product’s TCO compared to the other product variant’s TCO in percentage terms.
 Source: Authors’ analysis
The comparative analysis of TCO shows that the DRE variant is financially more attractive than the other product variant in regions with no or erratic electricity. In regions of reliable electricity, the DRE variant is financially more attractive than the other product variant for an investment horizon of ten years and more.
 Source: Authors’ analysis
The incremental income and associated payback period are based on the average or median values. The income potential for silk reelers varies from INR 30,000 to INR 90,000 depending upon the raw material’s cost and quality. Many users with incomes lower than average or median income would have much longer payback periods. Accordingly, such users may need support through product subsidies or longer-tenure loans.
 Source: Authors’ analysis
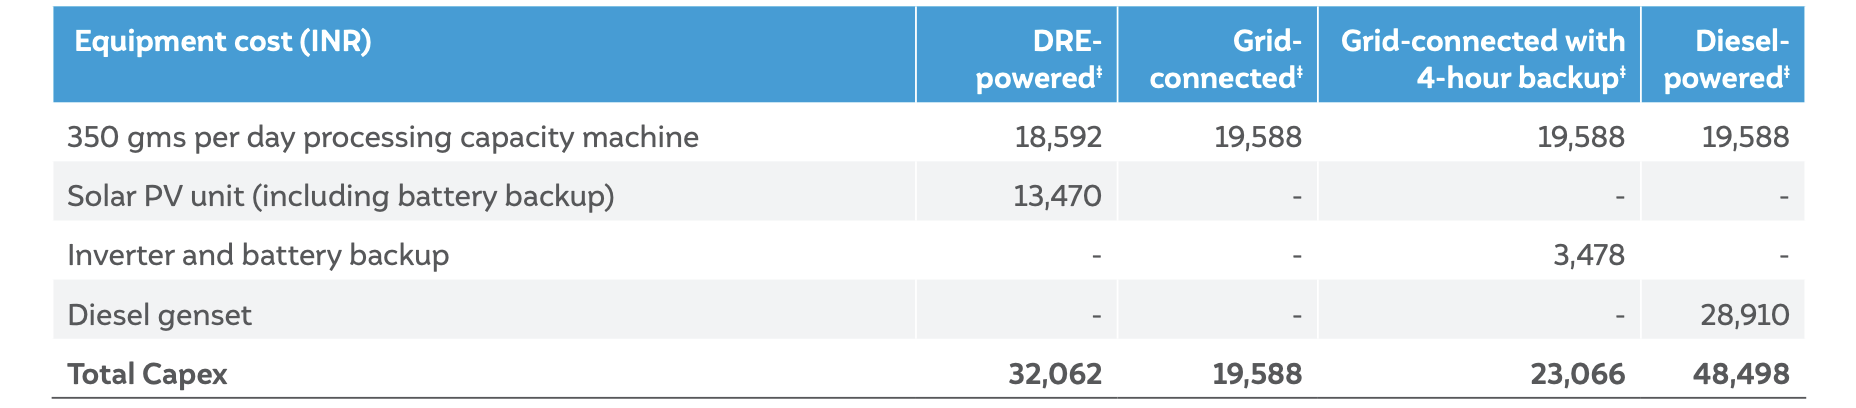
‡ The power rating of both DRE-powered and electric silk-reeling machine is 0.02 kW. Details considered are sourced from the manufacturers.
 Source: Authors’ analysis
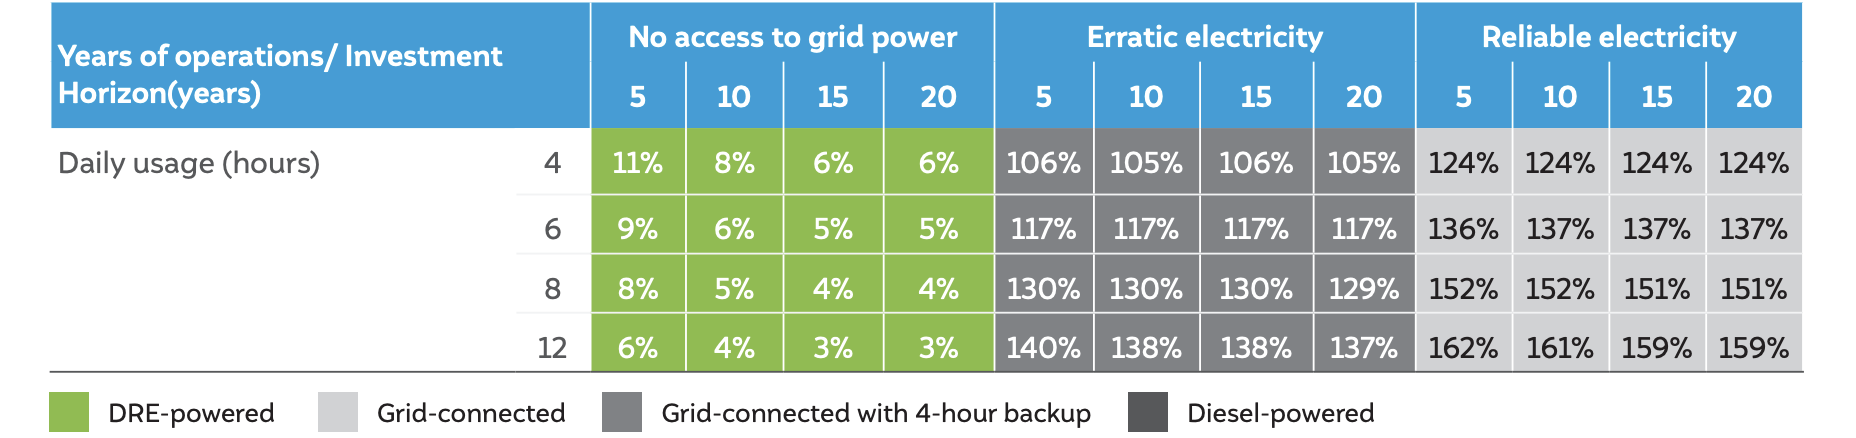
We compare the TCO†† of DRE-powered products with that of other variants under different scenarios of power availability and daily usage durations for various investment horizons.
In the table below, the cell’s colour represents the financially-preferable product variant. Whereas, the cell values denote the ratio of DRE-powered product’s TCO compared to the other product variant’s TCO in percentage terms.
 Source: Authors’ analysis
The comparative analysis of TCO shows that the DRE variant is financially more attractive than the other product variant in regions with no access to electricity. Grid-connected variant is financially preferable in regions with reliable or erratic electricity.
 Source: Authors’ analysis
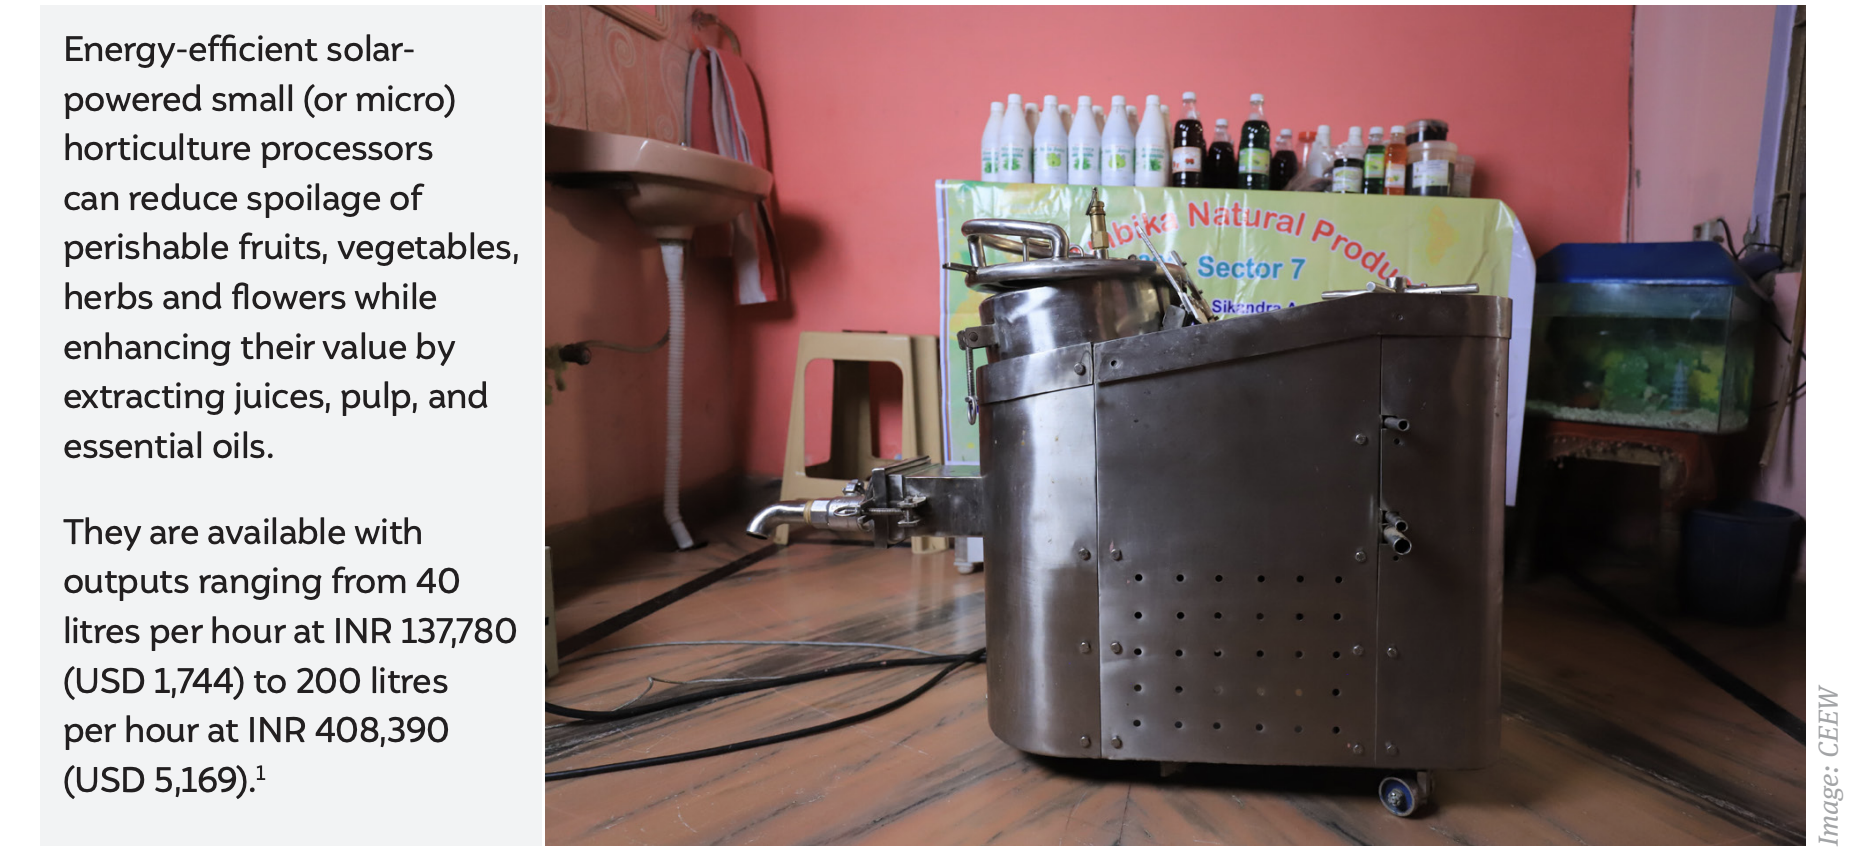
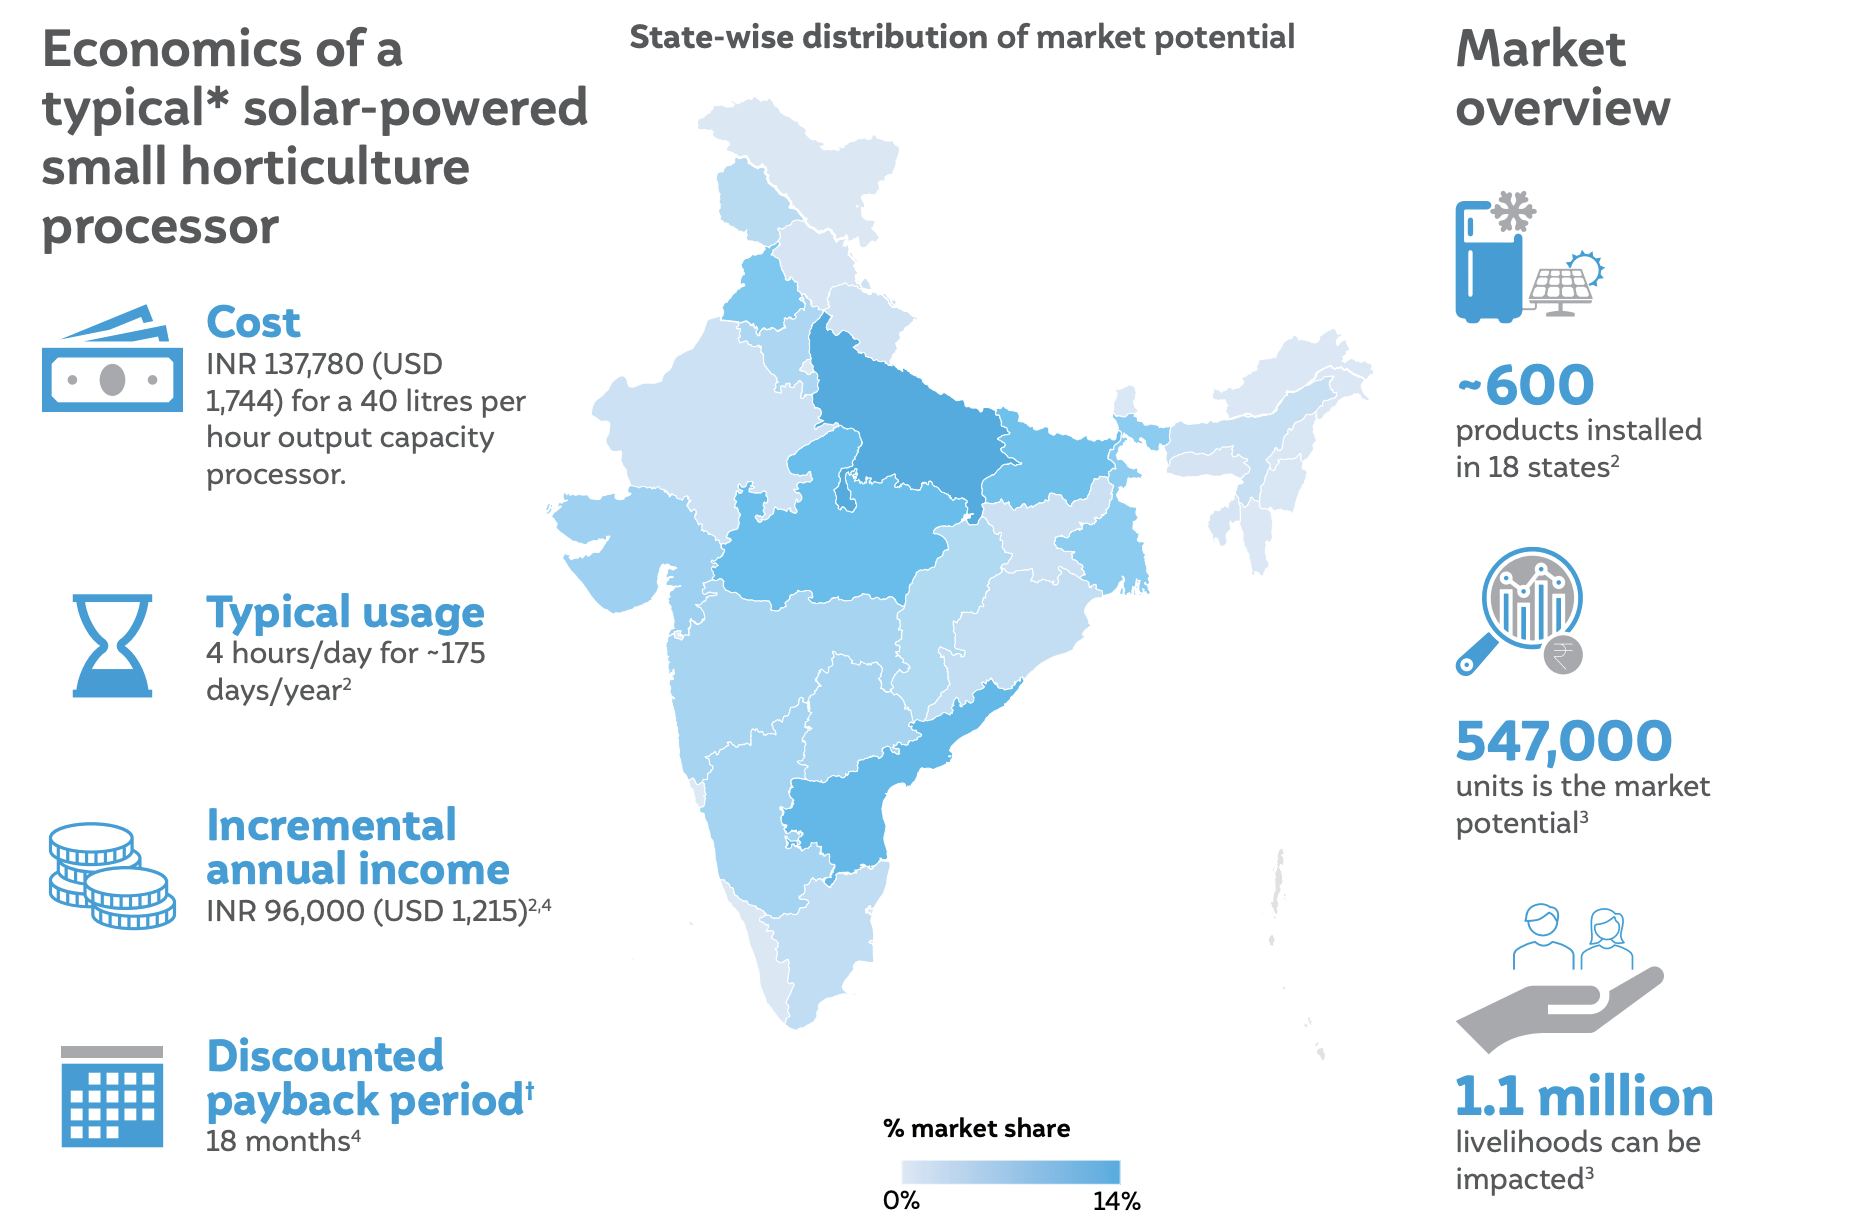
The incremental income and associated payback period are based on the average or median values. Incremental annual income from the processed commodity varies from INR 30,000 for commodities such as peaches and goes up to INR 200,000 for commodities such as aloe vera. Many users with incomes lower than average or median income would have much longer payback periods. Accordingly, such users may need support through product subsidies or longer-tenure loans.
 Source: Authors’ analysis
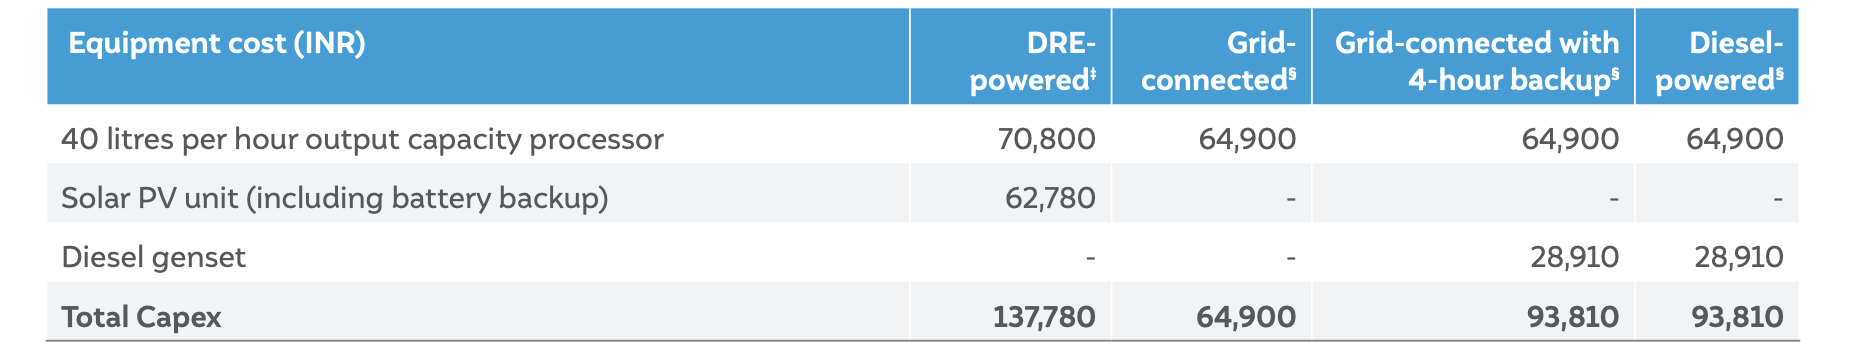
‡ The power rating of the DRE-powered product is 0.375 kW. Details considered are sourced from the manufacturers.
§ A 40 litre per hour output electric juicer has a typical power rating of 2.25 kW. Details listed are as indicated on IndiaMART (last accessed in August 2022).
 Source: Authors’ analysis
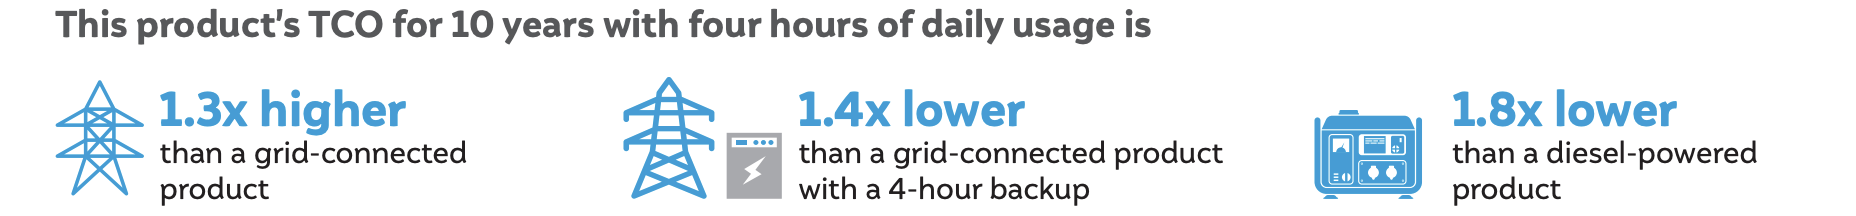
We compare the TCO†† of DRE-powered products with that of other variants under different scenarios of power availability and daily usage durations for various investment horizons.
In the table below, the cell’s colour represents the financially-preferable product variant. Whereas, the cell values denote the ratio of DRE-powered product’s TCO compared to the other product variant’s TCO in percentage terms.
 Source: Authors’ analysis
The comparative analysis of Total Cost of Ownership (TCO) shows that the DRE variant is financially more attractive than the other product variant in regions with no access to electricity. In regions of erratic electricity, the DRE variant is financially more attractive than the other product variant for an investment horizon of ten years and more. Grid-connected variant is financially preferable in regions with reliable electricity.
 Source: Authors’ analysis
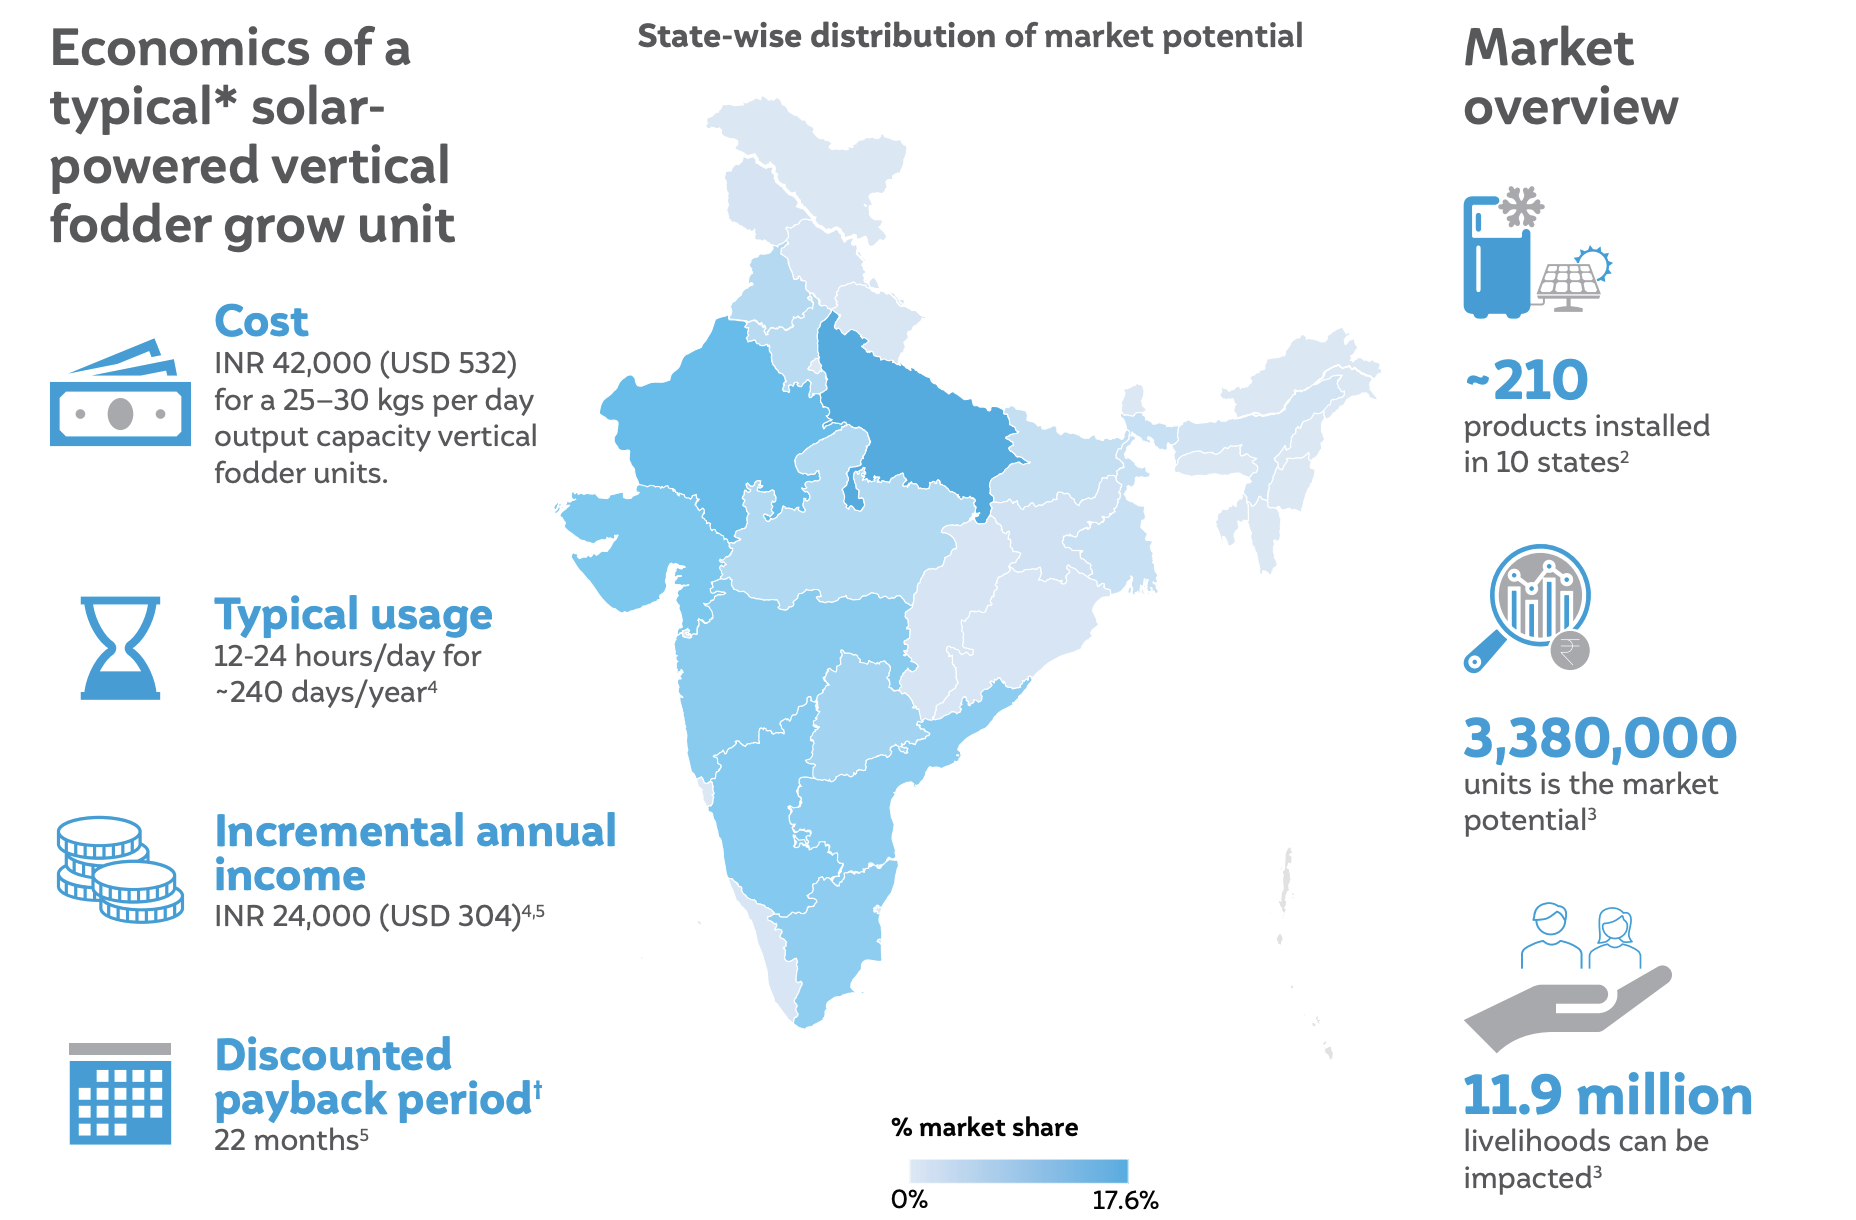
The incremental income and associated payback period are based on the average or median values. A vertical fodder grow unit may result in an increase of milk yield varying from 1–3 litre per cattle . Therefore, an animal husbandry farmer with four cattle can earn an incremental income of INR 9,600–57,600. Many users with incomes lower than average or median income would have much longer payback periods. Accordingly, such users may need support through product subsidies or longer-tenure loans.
 Source: Authors’ analysis
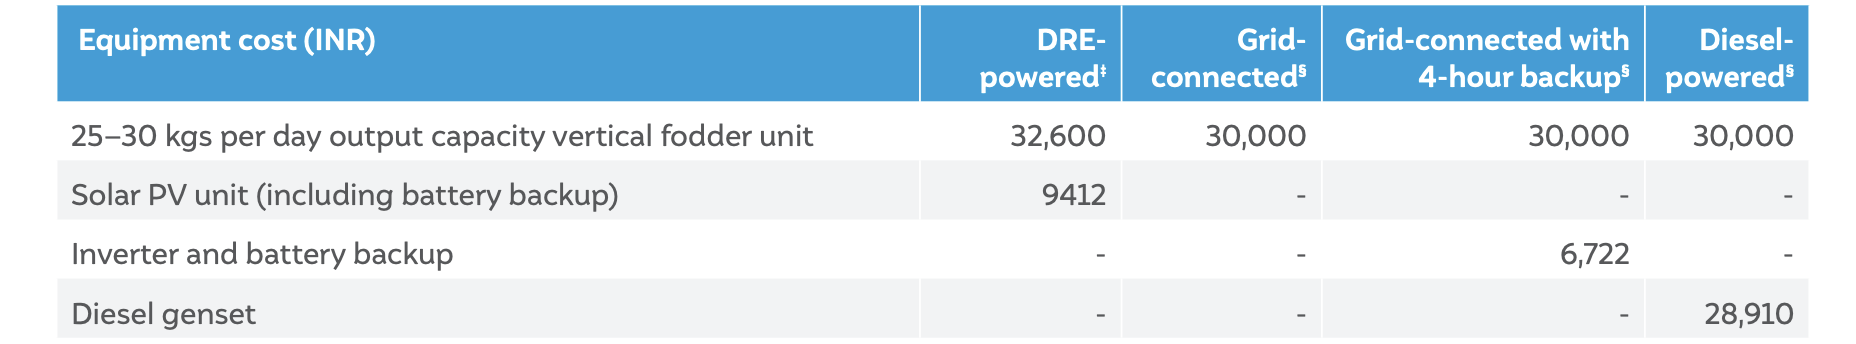
‡ The power rating of the DRE-powered product is 0.375 kW. Details are sourced from the manufacturers.
§ A 25—30 kg per day output electric vertical fodder grow unit has a typical power rating of 0.375 kW. Details listed are as indicated on IndiaMART (last accessed in August 2022).
 Source: Authors’ analysis
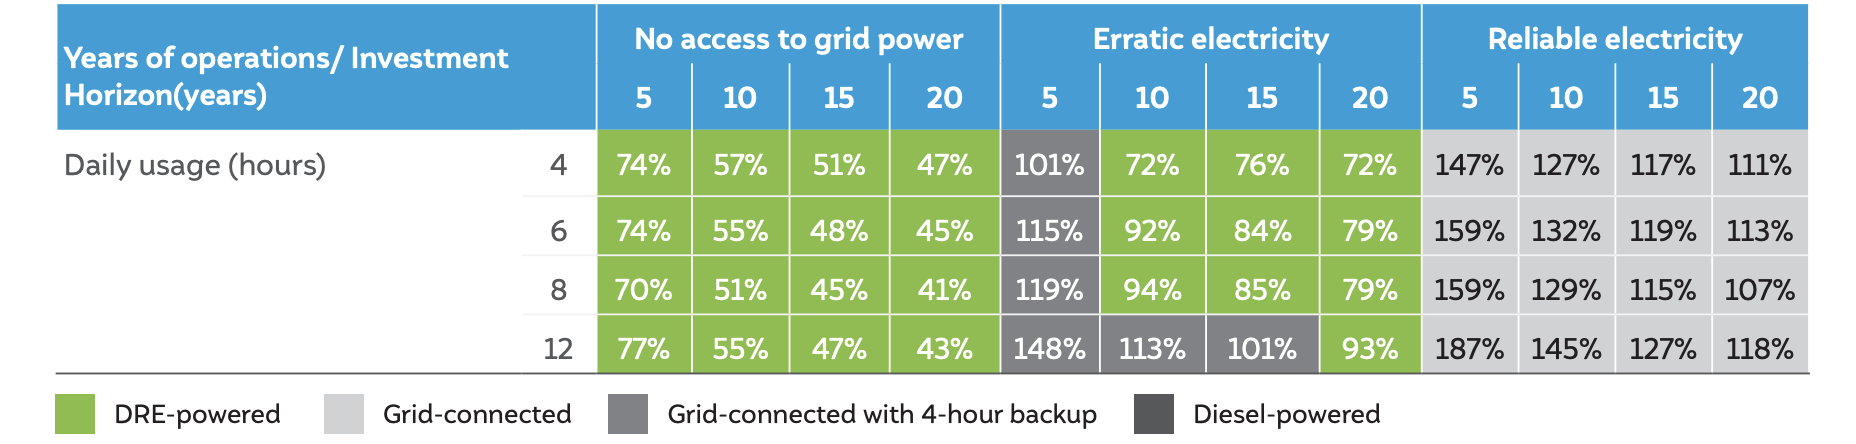
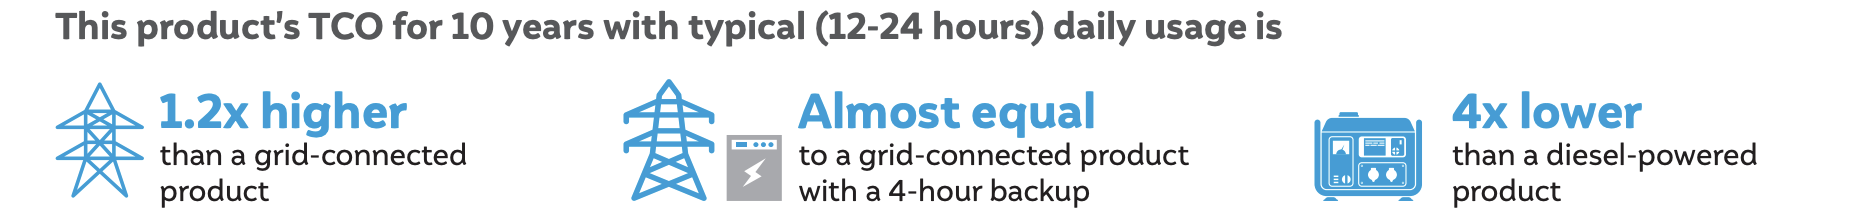
We compare the TCO†† of DRE-powered products with that of other variants under different scenarios of power availability and daily usage durations for various investment horizons.
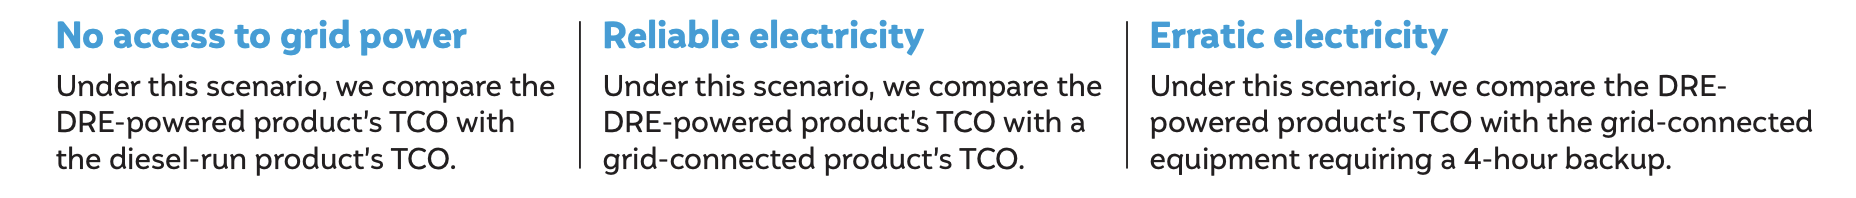
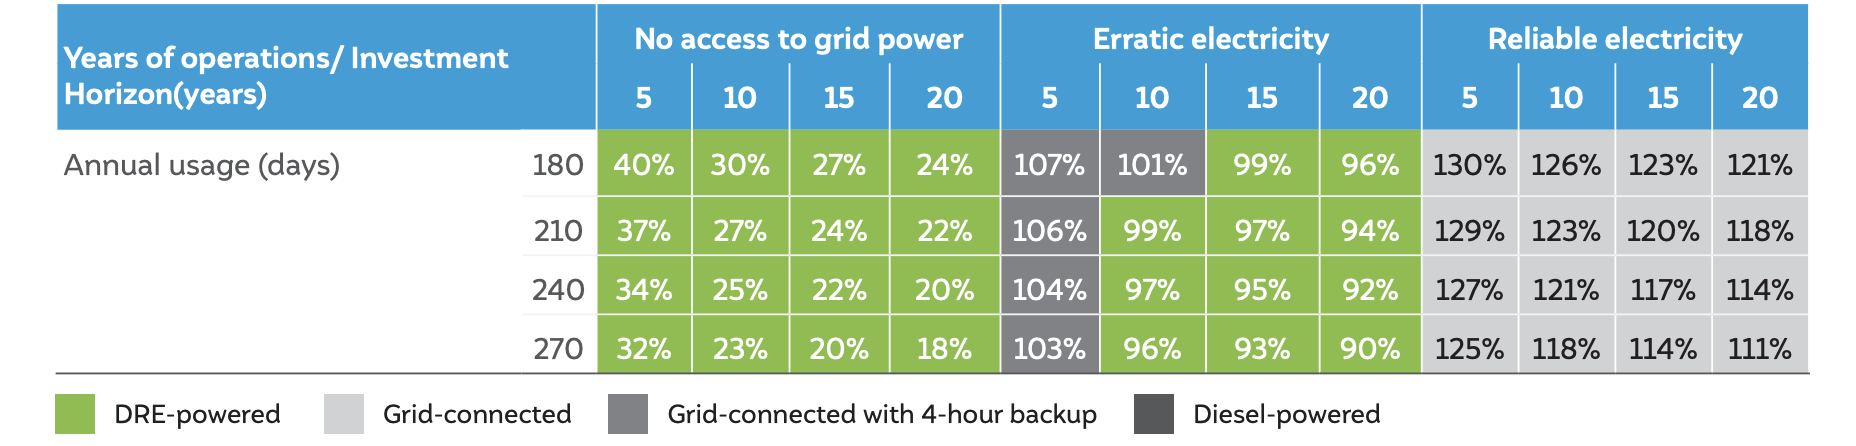
In the table below, the cell’s colour represents the financially-preferable product variant. Whereas, the cell values denote the ratio of DRE-powered product’s TCO compared to the other product variant’s TCO in percentage terms.
Source: Authors’ analysis
The comparative analysis of Total Cost of Ownership (TCO) shows that the DRE variant is financially more attractive than the other product variant in regions with no access to electricity. In regions of erratic electricity, the DRE variant is financially more attractive than the other product variant for an investment horizon of ten years and more. Grid-connected variant is financially preferable in regions with reliable electricity.
Maximising Rooftop Solar Performance by Enabling a Robust O&M Ecosystem
What Drives Rooftop Solar Installation Decisions in Indian Homes?
Building a People-centric Energy Future:
Roadmap of the methodology to assess the climate co-benefits of the SUP ban in Tamil Nadu