Council on Energy, Environment and Water Integrated | International | Independent
Suggested citation: Almeida et al., Driving Energy Transition: Workforce, Skills, and Gender in India's Renewable Energy Sector, CEEW - NRDC, 2026.
CEEW: Nicole Almeida, Akanksha Tyagi, and Soham Roy (former researcher)
NRDC India: Deepesh Tourani, Pallavi Girolkar, and Rana Pujari
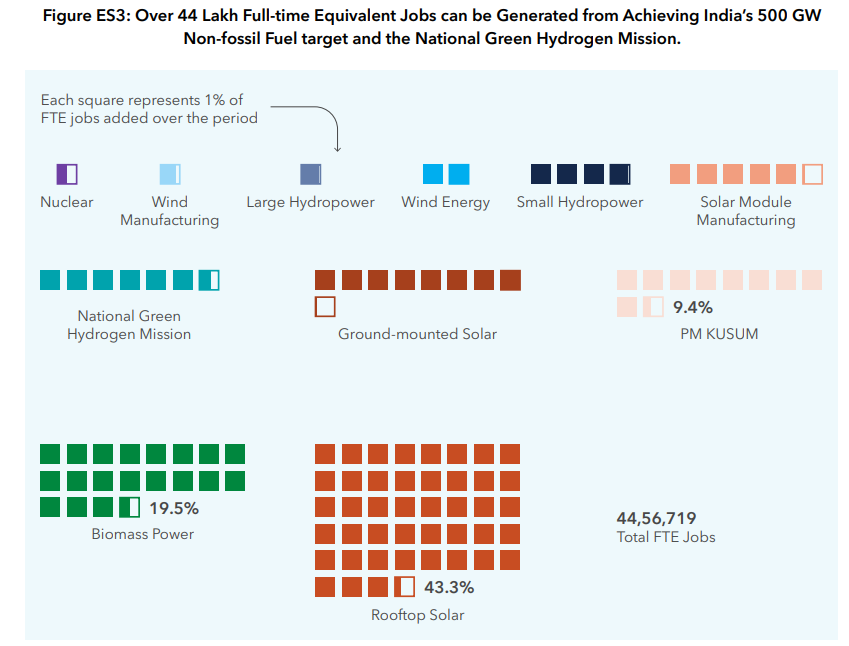
India's energy transition is both a climate imperative and an economic opportunity. In July 2025, India met its NDC target of sourcing 50 per cent of installed power capacity from non-fossil fuels — five years ahead of schedule. As renewable energy (RE) deployment and manufacturing become central to the Viksit Bharat 2047 vision, understanding the workforce implications of this transition is critical.
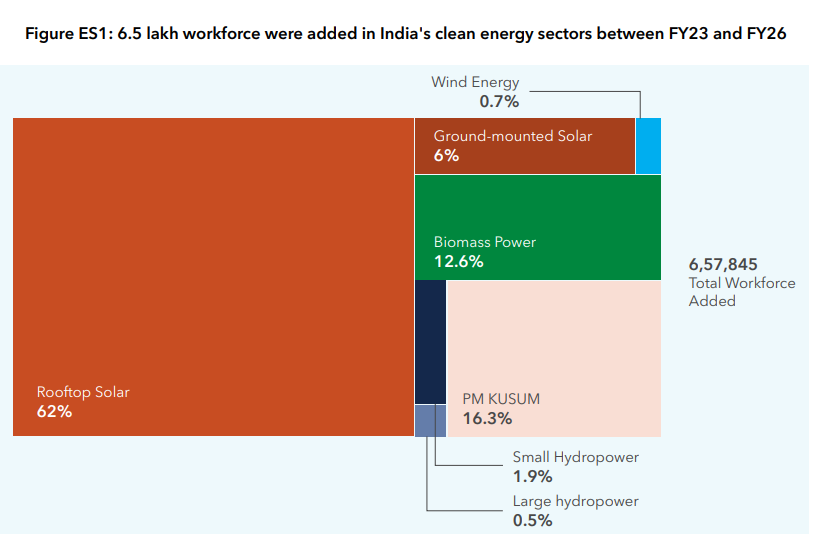
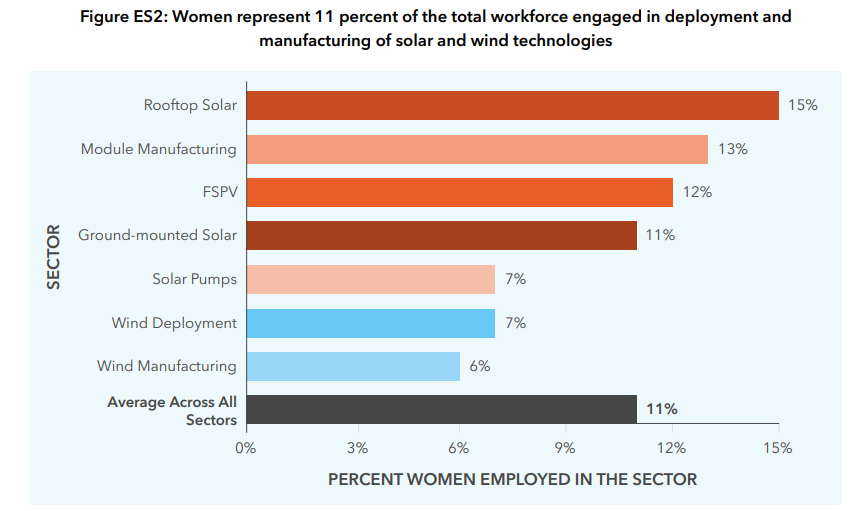
The study has developed full-time equivalent (FTE) coefficients for assessing the employment intensity across the deployment and manufacturing of various RE technologies. The coefficients cover the various business phases, such as business development, pre-construction, construction, operation and maintenance. The FTE coefficient or job-year is a ratio of the time spent by an employee on a particular project or task in a given year to the standard total working hours in that particular year. These FTEs are standardised per megawatt (MW) or as per the standard unit of measurement in the sector. The study also examines trends in the representation of women in the clean energy workforce, skill distribution across skilling levels and new clean energy workforce additions between financial year (FY) 2023 and 2026.
India is making significant progress in pursuing and achieving its energy transition goals. The country now ranks third globally in renewable energy installed capacity.1 India also achieved its target of meeting 50 percent of cumulative electric power installed capacity from non-fossil sources in 2025, five years ahead of schedule.2 Clean energy technologies play a critical role in India’s vision of a Viksit Bharat (an economically developed, self-reliant, and prosperous India) by 2047 and achieving net-zero emissions by 2070.
An accurate estimation of clean energy jobs, skill requirements, and gender participation aids in informing skill-building programs, developing measures to ensure a gender and equity-focused energy transition, and helping policymakers develop programs to optimize job creation, among other benefits. To this end, with support from the Government of India’s Ministry of New and Renewable Energy, the Natural Resources Defense Council (NRDC) India and the Council on Energy, Environment and Water (CEEW) conducted a primary survey of companies in 2024-25 across the solar, wind, bioenergy, and hydropower sectors to assess the clean energy workforce advancements in India.
The study has developed full-time equivalent (FTE) coefficients for assessing the workforce intensity across business phases (these phases include business development, pre-construction, construction, operation and maintenance, etc. Details in Table 2). The FTE coefficient or job-year is a ratio of the time spent by an employee on a particular project or task in a given year to the standard total working hours in that particular year. These FTEs are standardized per megawatt (MW) or as per the standard unit of measurement in the sector.i The study also examines trends in representation of women in the clean energy workforce, skill requirements and new clean energy workforce additions between financial year (FY) 2023 and 2026.
Table ES1: Sector-wise FTE Employment Coefficients
| Sector | Coefficient | Unit |
|---|---|---|
| Deployment Sectors | ||
| Ground-mounted Solar | 1.00 | FTE (job-years)/MW |
| Rooftop Solar | 44.68ii | FTE (job-years)/MW |
| Floating Solar | 2.21 | FTE (job-years)/MW |
| Wind | 0.65 | FTE (job-years)/MW |
| Small Hydropower | 152.43 | FTE (job-years)/MW |
| Biomass to Power | 164.82 | FTE (job-years)/MW |
| Compressed Biogas (CBG) | 9.91 | FTE (job-years)/TPD |
| PM-KUSUM Component A* | 1.17 | FTE (job-years)/MW |
| PM-KUSUM Component B** | 47.91 | FTE (job-years)/MW |
| PM-KUSUM Component C Grid-connected Pumps (IPS)*** | 47.32 | FTE (job-years)/MW |
| PM-KUSUM Component C Feeder-level Solarisation (FLS)**** | 1.17 | FTE (job-years)/MW |
| Large Hydropower***** | 0.72 | FTE (job-years)/MW |
| Manufacturing Sectors | ||
|---|---|---|
| Solar Module Manufacturing | 1.51 | FTE (job-years)/MW |
| Solar Pumps manufacturing | 6.37 | FTE (job-years)/MW |
| Wind Manufacturing | 1.44 | FTE (job-years)/MW |
| Pellet Manufacturing | 8.04 | FTE (job-years)/TPH |
Notes:
* Ground-mounted solar FTE (for smaller systems below 2 to 3 MW) used here, as the scheme targets smaller sized systems.
** Rooftop solar FTE for 5-kilowatt (kW) systems, along with solar pumps systems installation FTE, have been used in this case.
*** Rooftop solar FTE for 5 kW systems have been used.
**** Ground-mounted solar FTE (for smaller systems below 2 to 3 MW) used for feeder-level solarisation.
***** FTE for O&M phase only
Source: CEEW-NRDC Analysis, 2026
Source: CEEW-NRDC Analysis, 2026
Source: CEEW-NRDC Analysis, 2026
Source: CEEW-NRDC Analysis, 2026 and Ministry of New and Renewable Energy, 2024
Based on this analysis, the report proposes the following recommendations to strengthen evidence-based decision making on jobs and skills, and build a robust clean energy jobs ecosystem:
Clean energy jobs span the entire project lifecycle — from manufacturing components like solar modules and wind turbines, to deploying and installing systems in the field, to operating and maintaining assets over decades. Each phase requires a different mix of skills: construction and installation work is relatively labour-intensive and employs semi-skilled workers; manufacturing increasingly demands precision and technical training; and operations rely on a smaller but steadier workforce. Beyond these, clean energy also generates jobs in areas like logistics, project finance, and community engagement.
It depends on whether you measure total jobs or jobs per megawatt. In absolute terms, large-scale solar dominates simply because of deployment volume. But in terms of labour intensity per MW, rooftop solar, solar pumps, and bioenergy are significantly more employment-intensive — making them particularly valuable for rural and distributed employment goals. It is because one needs to deploy more systems for a distributed technology to reach the same capacity. More systems need more people and create more jobs.
The clean energy sector requires a mix of low-skilled, semi-skilled, and highly-skilled workers, with the distribution varying by technology and phase. Manufacturing in solar and wind is particularly skewed towards semi- and highly-skilled workers — for precision assembly, quality control, and systems integration. Deployment phases have a higher share of low- to semi-skilled labour, particularly for civil, electrical, and installation work.
A full-time equivalent (FTE) is a standardised measure that converts variable, part-time, or project-based work into comparable units of one full-time job for one year. Clean energy projects are cyclical — they require intensive labour during construction and much less during operations. Using FTEs, rather than raw headcounts, allows for meaningful comparison of employment intensity across technologies, project sizes, and project phases. This study develops India-specific FTE employment coefficients based on primary survey data from industry — a significant methodological contribution, given that most global studies rely on coefficients derived from other countries.
Maximising Rooftop Solar Performance by Enabling a Robust O&M Ecosystem

What Drives Rooftop Solar Installation Decisions in Indian Homes?

Building a People-centric Energy Future:

Roadmap of the methodology to assess the climate co-benefits of the SUP ban in Tamil Nadu

Roadmap of the methodology to assess the climate co-benefits of the SUP ban in Maharashtra