Council on Energy, Environment and Water Integrated | International | Independent

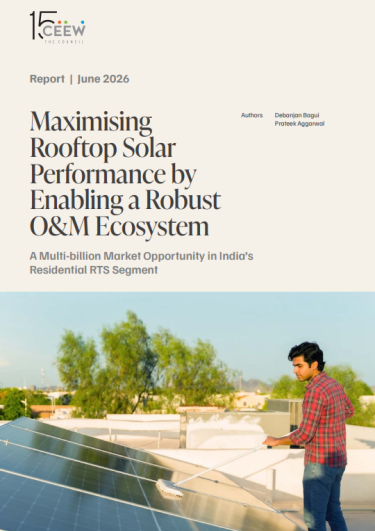
Suggested Citation: Bagui, Debanjan, Prateek Aggarwal. 2026. Maximising Rooftop Solar Performance by Enabling a Robust O&M Ecosystem: A Multi-billion Market Opportunity in India’s Residential RTS Segment New Delhi: Council on Energy, Environment and Water
India’s residential rooftop solar (RTS) sector has experienced unprecedented growth in recent years. As of April 2026, the residential RTS installed capacity has exceeded 10 GW, with more than 60 per cent of the total capacity added since the launch of the PM Surya Ghar: Muft Bijli Yojana in 2024 (MNRE 2026; Gulia et al. 2024). Ambitious national targets, complemented by increasing electricity demand and supportive policy instruments, have enabled this growth. More than 3 million households across the country have already adopted RTS systems, while the target is to reach 10 million households (30 GW) by 2027 (MNRE 2024, MNRE 2026).
This expansion of distributed generation marks a structural shift in how electricity is produced and consumed at the household level. As installations scale up, ensuring that systems deliver their projected output consistently over their operational lifetime becomes central to preserving their economic and environmental value. Against this backdrop, the study is guided by four central questions:
India’s residential rooftop solar (RTS) sector has experienced unprecedented growth in recent years. As of April 2026, the residential RTS installed capacity has reached over 10 GW, with more than 60 per cent of the total capacity added since the launch of the PM Surya Ghar: Muft Bijli Yojana in 2024 (MNRE 2026, Gulia, et al. 2024). Ambitious national targets, complemented by increasing electricity demand and supportive policy instruments, have enabled this growth. More than 3 million households across the country have already adopted RTS systems, while the government aims to expand installations to 10 million households (30 GW) by 2027 (MNRE 2024, MNRE 2026).
This expansion of distributed generation marks a structural shift in how electricity is produced and consumed at the household level. As installations scale up, ensuring that systems deliver their projected output consistently over their operational lifetime becomes central to preserving their economic and environmental value. Against this backdrop, the study is guided by four central questions:
From the outset, India’s RTS policies, including the PM Surya Ghar: Muft Bijli Yojana, have rightly prioritised accelerating RTS adoption. However, post-installation maintenance and long-term operational performance remain areas where policy direction is still evolving. While residential RTS systems are generally considered low-maintenance, basic upkeep such as periodic cleaning, system diagnostics, and routine servicing are essential to ensure that they deliver their expected electricity output over time.
To better understand how maintenance is currently delivered in the residential RTS segment, we engaged with more than 60 RTS vendors across multiple states/Union territories (including Bihar, Delhi-NCR, Gujarat, Madhya Pradesh, Odisha, Rajasthan, Uttar Pradesh, and Uttarakhand) through structured surveys and one-on-one consultations. The consultations sought to understand the scope of services currently offered under the PM Surya Ghar: Muft Bijli Yojana, vendor practices around maintenance delivery, and the structural constraints affecting service provision.
The findings pointed out that although the PM Surya Ghar: Muft Bijli Yojana mandates five years of free maintenance, the scope of services and minimum frequency of visits are not clearly defined. As a result, maintenance delivery varies significantly across vendors, ranging from quarterly visits to once-a-year servicing. In many cases, service provision remains reactive, initiated only when consumers report system issues. Table ES1 summarises these findings.
Table ES1. Evaluating the operational realities of residential RTS maintenance services
| Theme | Prevailing market practice |
|---|---|
| Service awareness | Almost all vendors are highly aware of the five-year free annual maintenance contract (AMC) mandate; however, the actual scope of services delivered varies significantly across vendors. |
| Scope of maintenance service | Cleaning services are typically not included in free AMC provisions, which are largely limited to basic electrical and system health checks. Vendors generally provide guidance to consumers on recommended cleaning practices. |
| Cost structure | Most vendors report that the "free" five-year AMC is not actually free; costs are predominantly embedded in the initial installation price. |
| Service frequency | Service delivery is predominantly reactive. Maintenance is mainly carried out at the consumer's request rather than through scheduled visits. |
| Paid AMC uptake | Consumer willingness to subscribe to paid O&M services after the initial five-year period remains limited, with most households expressing hesitation or indifference towards renewal. |
Source: Authors’ analysis
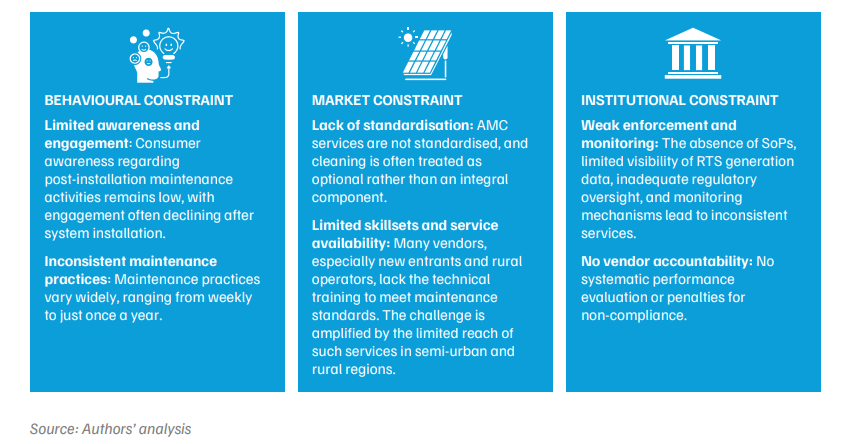
The findings suggest that maintenance remains a peripheral activity within the residential RTS ecosystem, shaped by a combination of behavioural, market, and institutional factors. Together, these factors create a system-level bottleneck that limits the realisation of the full economic and environmental potential of RTS systems (Figure ES1).
Figure ES1. From low consumer awareness to weak regulatory enforcement, systemic gaps hinder effective maintenance services
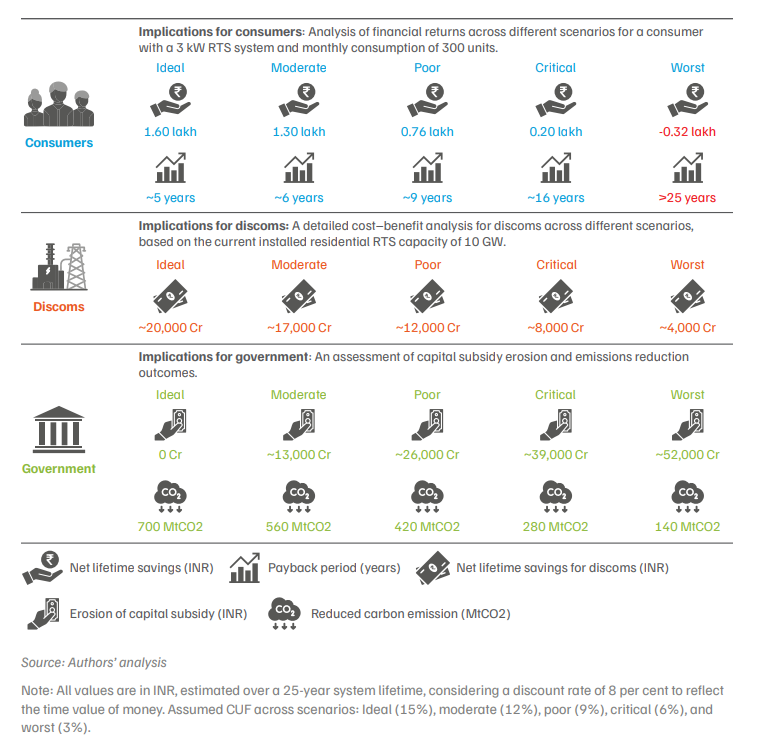
There is substantial evidence that regular maintenance is a crucial component in ensuring the long-term performance of solar systems (Abdulla, Sleptchenko, and Nayfeh 2024). Irregular maintenance practices can significantly reduce energy generation, accelerate system degradation, and compromise the long-term durability of residential RTS installations. Over time, this directly affects the financial viability of systems by eroding expected savings and shortening lifetimes. The implications extend beyond individual consumers to the entire RTS ecosystem (Figure ES2). To assess these implications at scale, the report models performance variance across five scenarios. These range from ideal system operation (15 per cent CUF) to extreme underperformance (3 per cent CUF). The analysis evaluates how deviations from projected generation output affect household savings, subsidy efficiency, discoms’ planning assumptions, and realised emissions outcomes.
Figure ES2. Financial implications of irregular maintenance for different stakeholders in the residential RTS ecosystem
The observed gaps in awareness, standardisation, and service consistency point not only to structural weaknesses but also a significant untapped market opportunity within the residential RTS ecosystem. As installation capacity is scaled up, the cumulative base of systems requiring periodic servicing is expected to grow rapidly, driving rapid expansion of an emerging economic opportunity.
Along with significant market opportunities, the O&M sector also holds strong employment potential. Considering national target of 30 GW RTS capacity, this could generate approximately 0.33 million (3.30 lakh) jobs in the O&M sector (CEEW, NRDC 2026).
Figure ES3. More than 70% of the market opportunity for bundled maintenance services is concentrated in 5 states
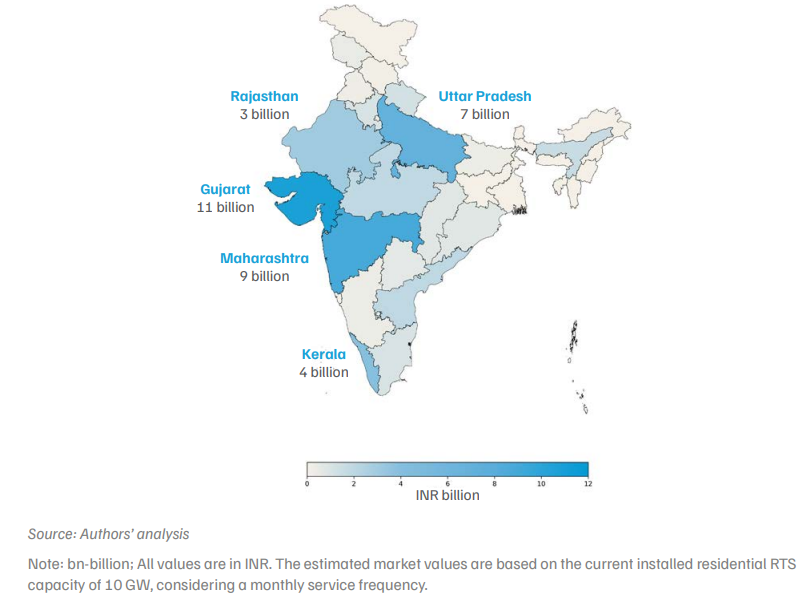
While the multi-billion recurring O&M market presents a massive opportunity, it remains highly fragmented, unorganised, and lacks standardisation. As installations scale up from 3 million households to tens of millions, the structural gap is likely to widen unless service delivery becomes formalised. To institutionalise maintenance practices and to capture the economic value, the ecosystem must shift towards structured, tech-enabled business models. This report proposes two scalable frameworks to create an accountable maintenance ecosystem:
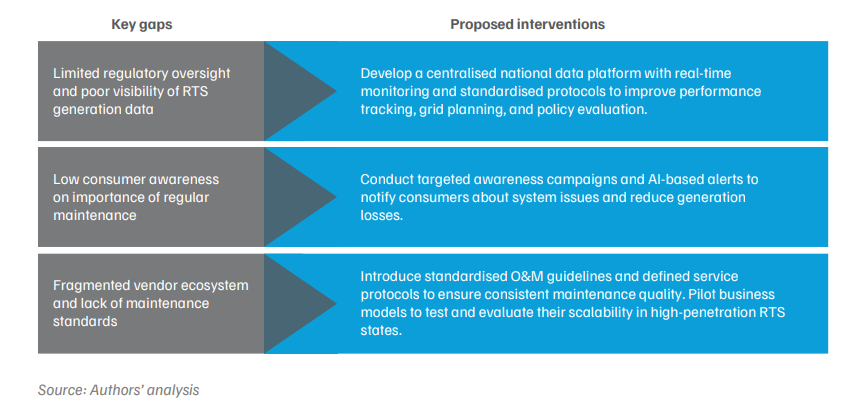
While the proposed business models can improve the accessibility, accountability, and standardisation of RTS maintenance services, structural gaps persist, including low consumer awareness and limited visibility of generation data. As India expands its RTS footprint, the focus must move beyond installation and capacity addition to prioritising sustained system performance as well. Figure ES4 presents a strategic roadmap outlining key steps to achieve this transition.
Figure ES4. Strategic roadmap for strengthening system performance in India’s residential RTS ecosystem
India’s residential rooftop solar (RTS) sector has experienced unprecedented growth in recent years. As of April 2026, the residential RTS installed capacity has reached over 10 GW, with more than 60 per cent of the total capacity added since the launch of the PM Surya Ghar: Muft Bijli Yojana in 2024 (MNRE 2026, Gulia, et al. 2024). Ambitious national targets, complemented by increasing electricity demand and supportive policy instruments, have enabled this growth. More than 3 million households across the country have already adopted RTS systems, while the government aims to expand installations to 10 million households (30 GW) by 2027 (MNRE 2024, MNRE 2026).
This expansion of distributed generation marks a structural shift in how electricity is produced and consumed at the household level. As installations scale up, ensuring that these systems deliver their projected output consistently over their operational lifetime becomes central to preserving their economic and environmental value.
India’s strategy for meeting rising electricity demand sustainably
Being one of the fastest-growing economies, India is witnessing industrialisation, rapid urbanisation, and improving living standards, contributing to higher electricity demand (PIB 2025). Between 2026 and 2030, India’s electricity demand is projected to grow at an average of ~6.4 per cent annually, nearly double the global average (IEA 2026). Climateinduced extreme weather events are likely to further influence the growth trajectory. Meeting this demand sustainably and reliably requires a diversified energy portfolio.
RTS contributes uniquely to this strategy as it reduces technical losses and moderates pressure on distribution networks. The residential segment, in particular, plays a critical role in expanding the decentralised energy transition. The nation is blessed with abundant solar radiation; the residential RTS sector alone holds a technical potential of ~118 GW (Zachariah, Tyagi and Kuldeep 2023), highlighting the significant scope for expansion. As the segment grows, the focus must extend beyond installations towards the sustained performance of RTS systems.
Irregular maintenance can significantly affect the performance and durability of RTS systems
Growth in RTS installed capacity does not automatically translate into proportional growth in electricity generation. In practice, residential RTS systems operate under diverse environmental, physical, and behavioural conditions. Unlike utilityscale plants, these systems are dispersed across millions of roofs and are typically not subject to performance audits. Distribution companies (discoms) only record net-metered flows, whereas granular system-level generation data, degradation trends, and maintenance history are rarely captured in a structured manner.
Although RTS systems are typically considered low-maintenance, adherence to basic maintenance practices is essential for reliable, long-term performance. Soiling from dust, pollution, and bird droppings is among the most common operational challenges in Indian conditions, along with inverter faults and downtime (Tyagi, et al. 2023). Design factors such as tilt, orientation, and shading influence baseline output, while installation quality, including wiring integrity and earthing, affects both safety and efficiency
Irregular maintenance practices compromise both system performance and module integrity. Initially, accumulated dirt blocks sunlight, resulting in an immediate drop in energy yield (Adekanbi, et al. 2024). When neglected for a prolonged period, this can form hotspots2 and eventually lead to glass cracking or fire hazards (Alzahrani, et al. 2024, SOLARCO 2025, Akram, et al. 2022). In the absence of routine inspections, minor technical issues (e.g., loose electrical connections, corrosion, inverter malfunctions, damaged insulation, and faulty wiring) may go undetected and progressively impair system performance, leading to electrical malfunctions and short circuits (Kut, Urbanik, and Kurek 2024) and posing risks to system reliability and user safety. Studies have shown that irregular maintenance can reduce the energy generation by up to 60 per cent (Tyagi, et al. 2023). Additionally, studies have shown that poor maintenance practices can significantly accelerate module degradation and reduce system lifetime (Peters, et al. 2021).
Reduced energy generation and accelerated degradation directly affect the financial viability of RTS systems. If early adopters experience these drawbacks, it can create a negative perception, thereby slowing down RTS adoption. This not only affects consumers but also the entire RTS ecosystem. For instance, a mismatch between projected and realised generation will lead to demand-supply forecast errors and force discoms to undertake costly corrective actions. From a policy perspective, such inefficiencies undermine the effectiveness of capital subsidies and delay the energy transition and netzero goals.
Scope and approach of this report
To date, research has been largely consumercentric and lacks a holistic perspective of the entire ecosystem. Unlike large utility-scale systems, the mechanisms for determining the performance outcomes and financial returns of residential RTS (metering arrangements, compensation structures, and regulatory design, etc.) differ significantly. Considering the rapid growth of the residential RTS sector in India, quantifying the impact of irregular maintenance through a system-level lens is critical. Against this backdrop, the report is guided by four central themes:
• Operational realities and the structural gap in the residential RTS ecosystem: Drawing on interactions with consumers and vendors across states, assessment of the scope of existing operations and maintenance (O&M) services under the PM Surya Ghar: Muft Bijli Yojana scheme and highlights key constraints in service delivery.
• Financial implications across the RTS ecosystem: By modelling performance variance (ranging from ideal to sub-optimal) at scale, it evaluates the impact across stakeholders: how deviations from projected output affect household savings, subsidy efficiency for the government, distribution network and energy procurement planning for discoms, and realised emissions outcomes for broader climate goals.
• Emerging market opportunities: Assessment of the emerging market opportunity for residential RTS O&M services in India.
• Scalable business models: Additionally, potential business models that could enable scalable and standardised O&M service delivery.
The analysis highlights how strengthening O&M services can help ensure that RTS deployment in India not only reaches scale but also delivers the expected economic, system, and environmental benefits. Though the impact of irregular maintenance on RTS is likely to be similar across consumer categories, this report focuses specifically on the residential sector.
To understand the scope of the current O&M services provided under the PM Surya Ghar: Muft Bijli Yojana and the key constraints, we engaged with more than 60 vendors3 across states/UTs (including Bihar, Delhi NCR, Gujarat, Madhya Pradesh, Odisha, Rajasthan, Uttar Pradesh, and Uttarakhand) through structured surveys and one-on-one interactions. The key insights emerging from these engagements are outlined below.
How maintenance services are currently delivered
• O&M is mandated, but the service scope is not standardised: Most vendors are aware of the five-year free maintenance requirement under the PM Surya Ghar: Muft Bijli Yojana. However, what constitutes “maintenance” varies widely. In many cases, annual maintenance contract (AMC)4 services are limited to basic system health checks and electrical inspections. There is no uniform definition of minimum service standards across vendors.
• Periodic cleaning, the most critical performance driver, is often outside formal AMC: Module cleaning, which directly influences generation levels in Indian conditions, is typically not included within formal AMC contracts. Vendors may provide guidance on cleaning practices, but routine cleaning is often treated as the consumer’s responsibility rather than the vendor’s.
• AMC costs are embedded upfront: Although the scheme specifies that five years of AMC should be provided without additional charges, vendors indicated that maintenance costs are generally included in the initial installation price. AMC is, therefore, not positioned as a distinct lifecycle service product, but as a bundled compliance feature of installation.
• Servicing is predominantly reactive rather than preventive: Maintenance activity is largely triggered by consumer requests or visible system issues. Preventive, scheduled servicing protocols are not uniformly institutionalised. Where proactive visits are conducted, quarterly servicing is typically reported as the norm, though practices vary.
• Transition to paid AMC after five years remains limited: Vendors offer paid AMC packages beyond the initial five-year period. However, uptake appears limited. Consumer willingness to transition to paid maintenance contracts is mixed, reflecting limited awareness of long-term performance risks and the absence of clearly articulated service benchmarks.
Why maintenance remains peripheral in residential RTS ecosystem
The limited mainstreaming of maintenance practices in the residential RTS segment can be attributed to a combination of market, behavioural, and institutional factors. Together, these factors create a systemlevel bottleneck in realising the full economic and environmental potential of RTS systems.
• Behavioural constraints: Typically, consumer engagement with RTS systems declines after installation. Additionally, consumer awareness of maintenance requirements remains limited. Even in an urban centre such as Delhi, where information penetration and institutional outreach are stronger, only 42 per cent of respondents were aware of RTS maintenance requirements (Saji, Kuldeep, and Chawla 2019). Our interaction with consumers5 also reveals similar patterns. Awareness levels vary significantly, and maintenance practices are inconsistent. Cleaning frequency varies widely, from once a week to as infrequently as once a year.
• Market constraints: From a market perspective, AMC services lack standardisation. Cleaning services are treated as optional rather than integral, and service frequencies vary widely. The absence of uniform service benchmarks constrains consumer comparability and limits formalisation. At the same time, the maintenance service ecosystem remains fragmented. Many vendors, particularly new entrants, small-scale operators, or those operating in rural areas, lack adequate technical training, limiting their ability to consistently meet maintenance standards. The issue is further compounded by the limited availability of such services, which diminish progressively from urban to semi-urban and rural areas.
• Institutional and regulatory constraints: Weak regulatory enforcement and limited monitoring mechanisms further constrain service quality. The absence of standardised operating procedures (SOPs), limited visibility of RTS generation data, systematic performance evaluation, and penalties for non-compliance reduces vendor accountability. Practical limitations related to system design and service markets also affect maintenance practices. Although guidelines recommend installing RTS systems in locations that allow easy inspection, repair, and cleaning, in practice, many installations are positioned in areas that make self-cleaning difficult for consumers.
Maintenance provisions exist in policy frameworks and contracts; however, a lack of structured data monitoring, performance verification, and maintenance standards creates an execution gap that undermines expected system outcomes. This raises important questions about how capacity additions are evaluated and how their contribution to energy security and policy outcomes is measured (Das 2025).
RTS holds immense potential to transform India’s energy landscape by generating clean electricity, offering a sustainable alternative to conventional fossil-fuel-based power, and fostering economic and environmental benefits. However, the successful implementation and adoption depend on coordinated efforts by diverse stakeholders, including policymakers, regulators, discoms, financial institutions, technology providers, and end users. Each one plays a critical role, from the pre-installation phase to the operational phase (Figure 1).
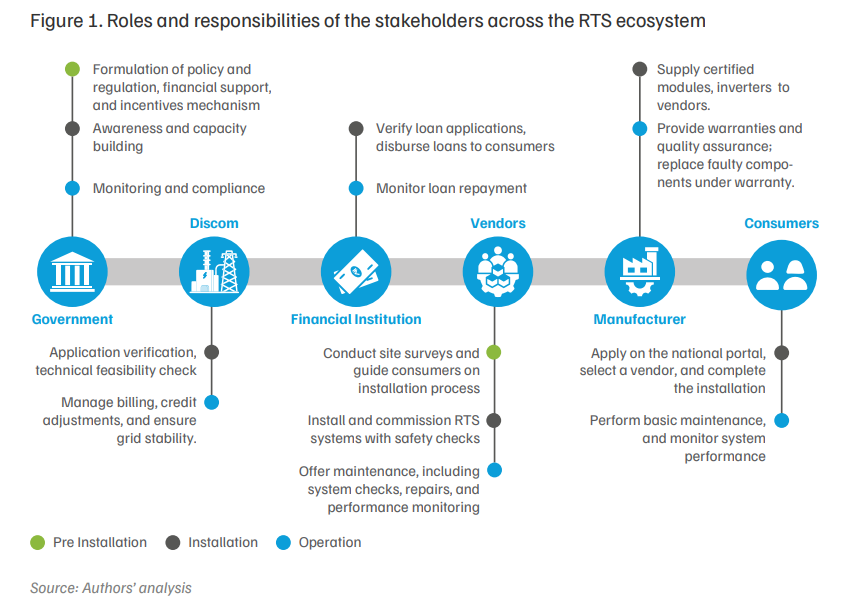
From policy to outcomes: Understanding the RTS ecosystem and its stakeholders
Extensive research, literature review, and consultations have shown that there are three stakeholder groups for whom outcomes are most directly linked to system performance:
• Consumers, whose electricity bill savings depend on actual electricity generation.
• Discoms, whose procurement strategies and operational planning are affected by the RTS generation.
• Governments (central and state), which support RTS deployment through capital subsidies and tariff support mechanisms while also aligning with broader net-zero targets.
For the remaining stakeholders, there is no direct evidence indicating the financial implications of irregular maintenance. The rationale for this assessment is outlined briefly below.
Vendors, given a lack of performance-based penalties or similar mechanisms, are not held financially accountable for poor maintenance practices.
Financial institutions could theoretically be impacted as inadequate maintenance could reduce system savings, which in turn may affect a borrower’s capacity to service debt and thereby expose lenders to repayment risks. However, repayment defaults cannot be attributed solely to maintenance issues, as other economic and household factors may also play a significant role6 .
While manufacturers are generally responsible for addressing defects arising from manufacturing faults or transit-related damage, the extent to which replacement provisions are triggered in practice is unclear. Our consultations with vendors revealed mixed views regarding liability for damaged modules during the warranty period. Stakeholders also indicated that responsibility allocation often varies on a case-by-case basis, and may differ across manufacturers, depending on contractual terms and the nature of the damage.
Therefore, the study does not explicitly include manufacturers, financial institutions, and solar vendors within its stakeholder assessment.
Framework for scenario-based performance assessment
This study adopts a scenario-based approach to assess the implications of RTS underperformance. One of the key constraints in analysing residential RTS performance in India is the limited availability of reliable generation data. At present, most discoms have limited access to real-time or historical electricity generation from residential RTS systems, which limits their ability to evaluate system performance at scale.
Recognising this gap, the Ministry of New and Renewable Energy (MNRE) recently mandated (MNRE 2025) that all new inverters deployed under the PM Surya Ghar: Muft Bijli Yojana be equipped with secure machine-to-machine (M2M) SIM-based telemetry. This enables real-time generation data to be transmitted to an India-hosted national portal using standardised open communication protocols such as Message Queuing Telemetry Transport (MQTT), thereby improving visibility into system performance over time.
Therefore, given the absence of RTS generation data and robust empirical data linking maintenance practices to the capacity utilisation factor (CUF)7 of RTS systems, this study uses a scenario-based approach to examine potential performance outcomes. A thorough review of existing literature, including data from manufacturers and vendors, suggests that the average CUF operating under typical Indian climatic conditions generally falls within the range of 15 - 18 per cent (Yadav and Bajpai 2018, SolarNPlus 2024, Sharma and Goel 2017). For this study, a conservative CUF of 15 per cent has been adopted as the ideal benchmark. All alternative scenarios represent proportional reductions relative to this benchmark (see Table 1).
Table 1. Comparative CUF-based performance benchmarks for RTS systems
| Scenario | CUF (%) | Interpretation |
|---|---|---|
| Ideal | 15 | Regular maintenance and optimal performance |
| Moderate | 12 | Minor performance degradation |
| Poor | 9 | Noticeable underperformance |
| Critical | 6 | Severe underperformance |
| Worst | 3 | Extreme underperformance |
Source: Authors' analysis
How irregular maintenance affects consumer returns
Among the many benefits of RTS, the one that matters most to consumers is the financial savings. These benefits arise from reduced electricity bills and, in some cases, revenue from surplus electricity exported to the grid.
When an RTS system underperforms, the anticipated savings on electricity bills are directly compromised. This shortfall in expected financial benefits erodes the immediate economic advantage, with a more profound effect on the long-term financial returns. Beyond the financial implications, neglecting routine checks and preventive measures often leads to higher, unforeseen repair costs. Furthermore, poorly maintained systems are prone to accelerated degradation and a higher probability of premature failure (as discussed in section 1.2). Figure 2 summarises the consequences of RTS underperformance from a consumer perspective.
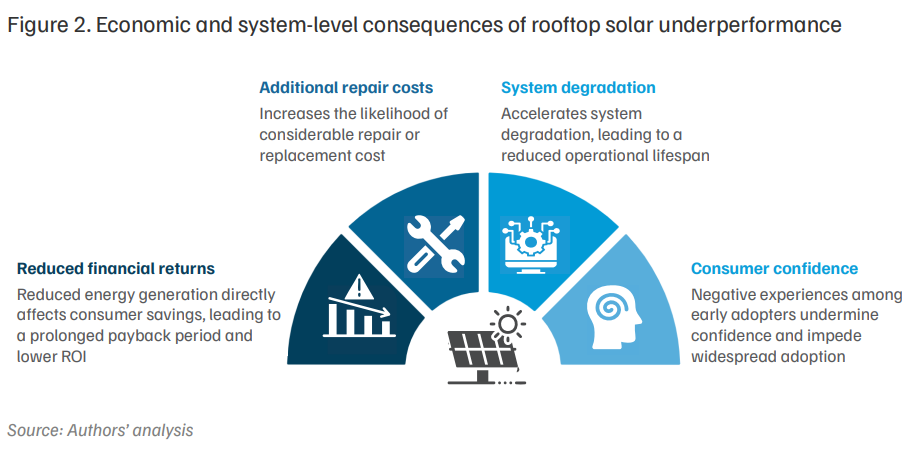
Metrics to evaluate the implications for consumers
To analyse these impacts, this study evaluates four key performance indicators commonly used by households to assess the affordability of an investment (see Table 2): Lifetime savings, payback period, return on investment (ROI), and levelised cost of electricity (LCOE).
Table 2. From lifetime savings to return on investment: Factors driving household adoption of RTS
| Metric | What it captures | How it is calculated |
|---|---|---|
| Net lifetime savings | The total financial benefits accrued over the system's operational life. | Net savings from electricity bill reductions and revenue from surplus electricity exports after accounting for installation and operational expenses. |
| Payback period | Time required to recover the upfront capital investment. |
Annual net savings from RTS generation relative to capital investment, reflecting the duration needed for cumulative net savings to offset the upfront investment. e.g., if someone generates a profit of INR 20 annually on an initial investment of INR100, the payback period will be 5 years. |
| Return on investment (ROI) | ROI measures the profitability of an investment or project. |
Net savings generated over the system lifetime relative to the initial investment. e.g., if someone generates a net profit of INR 120 on an initial investment of INR100, the ROI will be 120%. |
| Levelised cost of electricity (LCOE) | The effective cost of electricity generated by the RTS system over its lifetime. | Total system cost (upfront and operational costs) relative to lifetime electricity generation. |
Source: Authors’ analysis
Note: Although consumers may not explicitly evaluate the investment using the LCOE, it remains a widely accepted metric for assessing the economic viability and competitiveness of RTS. Detailed formulations for estimating these metrics are provided in Annexure A
Irregular maintenance can reduce lifetime savings from a RTS system up to 100%
To quantify the financial implications of declining system performance, a scenario analysis was conducted for a representative 3 kW residential RTS system serving a household with a monthly electricity consumption of 300 units. Figure 3 illustrates how the economics of a residential RTS investment change as system performance declines across the CUF scenarios defined in Table 1 (for detailed assumptions, refer to Annexure A).
Key insights emerging from the analysis
• First, net lifetime savings may decline to zero as electricity generation falls. Lower system output reduces the amount of electricity offset against grid consumption and limits surplus electricity exports, leading to a steady erosion of cumulative household savings.
• Second, investment recovery periods increase beyond 25 years. As annual net savings decline, the time required for households to recover their upfront investment increases rapidly. In severe underperformance scenarios, the payback period may approach or exceed the expected system lifetime.
• Third, the ROI is negatively impacted. Because the initial investment remains unchanged, while the net savings generated over the system lifetime are reduced due to system underperformance. In the worst-case scenario, the ROI may become negative over the system’s lifetime.
• Fourth, the effective cost of electricity rises substantially. Because the initial investment remains unchanged, while electricity generation declines, the levelised cost of electricity increases sharply. Across scenarios, the LCOE ranges from ~INR 3.5/kWh to ~INR 18/kWh, representing an increase of more than four times relative to the ideal scenario.
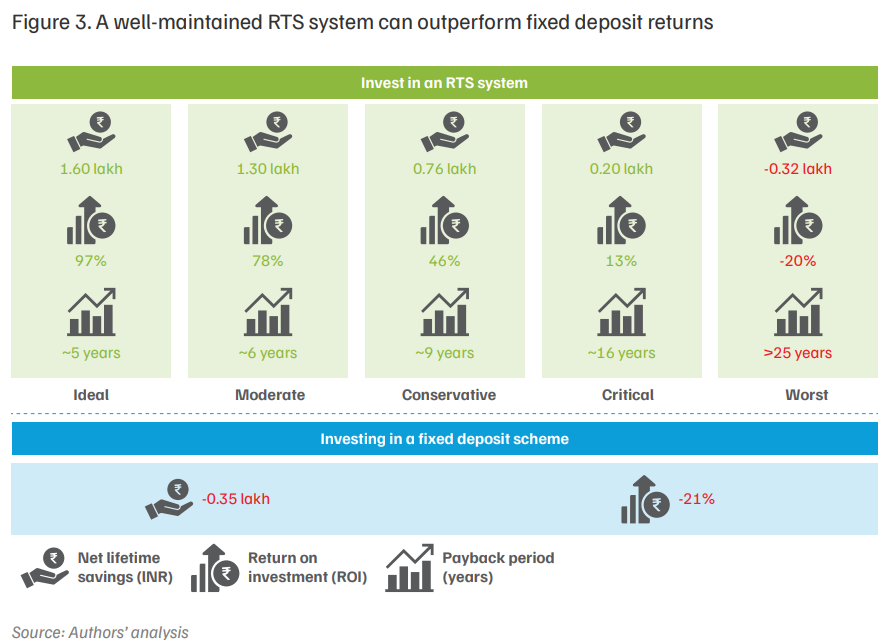
Note: The scenarios do not account for any generation-based incentives (GBI) or revenue from surplus energy compensation, as not all states provide the same. It has been assumed that consumers have self-cleaned the system and that no major technical faults have occurred. All values are estimated using a discount rate of 8 per cent. For more detailed assumptions, refer to Annexure A.
Box 1. RTS as a long-term household investment
For many households, RTS serves not only as a clean energy solution but also as a long-term financial investment. Comparing its returns to those of a conventional fixed deposit (FD) helps illustrate how system performance influences financial attractiveness.
If the consumer had invested the same capex cost of INR 0.16 million (1.65 lakh) in an FD with an annual interest rate of 6.5 per cent (SBI 2025) for 25 years, the maturity value would be approximately INR ~0.83 million (8.27 lakh). This translates into a net profit of about INR 0.66 million (6.62 lakh). However, when the returns are adjusted for the time value of money, there is no profit; In fact, over the long term, fixed deposits seem to provide a negative return (the maturity amount reduced to INR 0.13 million or 1.30 lakh). In comparison, a well-performing RTS system can generate a profit of up to ~INR 0.16 million (1.60 lakh; compared to zero profit in FDs), highlighting that RTS can serve as a stable, long-term household asset, provided the system is properly maintained and performs as expected.
FD interest rates have generally declined over time. In contrast, the economics of RTS are constantly improving. Initiatives such as Make in India (MNRE 2022), goods and services tax (GST) reforms (PIB 2025), and capital subsidies are reducing the upfront costs of the RTS system, making it affordable for all. Additionally, upward trends in retail electricity tariffs and recent discussions on the potential phase-out of cross-subsidies and implementation of time of day (ToD) tariff regime have further strengthened the case for RTS.
Discoms play a central role in integrating RTS into the electricity system. They act as the interface between consumers and the grid, facilitating system interconnection, managing bi-directional power flows, and ensuring accurate billing and settlement of electricity transactions.
As RTS deployment expands, the distributed generation increasingly influences discoms’ network operations and long-term planning. Under the resource adequacy planning (RAP) framework, discoms are required to prepare short-, medium-, and longterm demand and supply plans to ensure a reliable electricity supply. In this context, RTS generation becomes an important variable in forecasting electricity demand and system capacity requirements. However, when RTS systems underperform due to irregular maintenance, the generation expected from the installed capacity does not materialise. This creates a gap between the projected and actual distributed generation, affecting both operational planning and financial outcomes for discoms.
Framework for assessing economic implications
The financial implications of RTS for discoms are often debated, particularly regarding potential revenue losses from reduced electricity sales. Higher RTS penetration can reduce grid electricity consumption, especially among higher-income consumers, potentially affecting discom revenues. At the same time, RTS can generate several operational and economic benefits by reducing peak demand, avoiding expensive power procurement, lowering network losses, and contributing towards renewable purchase obligations. The overall impact on discom finances, therefore, depends on the balance between reduced electricity sales and the system-level benefits created by distributed generation.
To evaluate these competing effects, this study applies a cost–benefit framework previously developed by CEEW (Kuldeep, et al. 2019) to assess the economic implications of RTS from a discom perspective8 . The framework evaluates (Table 3) both avoided system costs and potential revenue impacts associated with RTS deployment across the performance scenarios defined in Section 3.2. For detailed assumptions, refer to Annexure B.
Table 3. List of parameters considered to evaluate costs and benefits for discoms
| Theme | Prevailing market practice |
|---|---|
| Service awareness | Almost all vendors are highly aware of the five-year free annual maintenance contract (AMC) mandate; however, the actual scope of services delivered varies significantly across vendors. |
| Scope of maintenance service | Cleaning services are typically not included in free AMC provisions, which are largely limited to basic electrical and system health checks. Vendors generally provide guidance to consumers on recommended cleaning practices. |
| Cost structure | Most vendors report that the "free" five-year AMC is not actually free; costs are predominantly embedded in the initial installation price. |
| Service frequency | Service delivery is predominantly reactive. Maintenance is mainly carried out at the consumer's request rather than through scheduled visits. |
| Paid AMC uptake | Consumer willingness to subscribe to paid O&M services after the initial five-year period remains limited, with most households expressing hesitation or indifference towards renewal. |
Source: Authors’ analysis
Note: In our assessment, avoided generation capacity costs (AGCC) have not been considered, as RTS primarily offsets demand during solar generation hours. Even in configurations where RTS is paired with battery storage, discoms would still need to contract for generation capacity and incur full capacity charges to reliably meet demand across all hours.
In addition to these parameters, underperforming RTS may increase the risk of deviations from scheduled power drawal, potentially exposing discoms to deviation settlement mechanism (DSM) penalties.
However, quantifying DSM impacts requires granular operational data across states/UTs and has, therefore, not been included in the present analysis.
Poor maintenance of the RTS reduces the economic benefits
Using the framework outlined in Table 3, the financial implications of RTS are evaluated across the performance scenarios. Table 4 presents the capacity-normalised values of costs and benefits per kW of RTS installed over the 25-year lifetime under different performance conditions.
Table 4. RTS underperformance can erode the net financial benefit for discoms by up to 80%
| Scenarios | APPC (INR/kW) | ATRC (INR/kW) | ARECC (INR/kW) | ADCC (INR/kW) | AWCC (INR/kW) | Revenue loss (INR/kW) | Net savings or loss (INR/kW) |
|---|---|---|---|---|---|---|---|
| Ideal | 80,320 | 6,190 | 4,208 | 927 | 507 | 70,694 | 21,458 |
| Moderate | 64,256 | 4,952 | 3,366 | 927 | 405 | 56,555 | 17,351 |
| Poor | 48,192 | 3,714 | 2,525 | 0 | 304 | 42,417 | 12,318 |
| Critical | 32,128 | 2,476 | 1,683 | 0 | 203 | 28,278 | 8,212 |
| Worst | 16,064 | 1,238 | 842 | 0 | 101 | 14,139 | 4,106 |
Source: Authors' analysis
Note: The numbers provided are intended to offer a preliminary estimate based on certain assumptions, such as all distribution transformers (DTs) serving only residential consumers and all RTS systems installed in the discom’s network serving only residential consumers. In reality, the scenario will be more complex, with mixed consumer categories and varying load profiles. Accurate determination of the AGCC, ATRC, and APPC benefits requires detailed load, power purchase, and solar generation data at 15-minute intervals. SCF and other technical parameters used here are also based on assumptions. All calculated values are estimated using a discount rate of 8 per cent; for further details refer to Annexure B.
Key insights emerging from the analysis
• First, the economic benefits of RTS for discoms decline as system performance deteriorates. ATRC, APPC, and ATRC all decrease in proportion to the decline in electricity generation. The net financial benefit per kW of installed RTS declines by nearly 80 per cent between the ideal and worst-case scenarios. When extrapolated to the current installed RTS solar capacity of 10 GW, the cumulative financial impact under severe underperformance scenarios could reach INR ~160 billion (16,000 crore).
• Second, the reduction in avoided power purchase costs is particularly significant. Since power procurement typically accounts for 75 - 80 per cent of a discom’s total expenditure, lower RTS generation directly reduces the expected savings from RTS procurement.
• Third, while RTS reduces grid electricity sales, the net financial impact depends on the balance between avoided system costs and revenue losses.
Overall, the analysis indicates that net savings decline sharply as system performance deteriorates. While RTS delivers substantial system benefits under ideal operating conditions, these benefits diminish significantly under lower performance scenarios.
Beyond these financial outcomes, underperforming RTS systems can also affect distribution system planning and operations. When the distributed generation does not deliver the expected electricity output, demand forecasts may diverge from actual system requirements, complicating procurement planning and increasing reliance on short-term power markets. In addition, higher RTS penetration at the distribution transformer level may require network upgrades to maintain system stability. If RTS systems operate below expected performance levels, these investments may not deliver the anticipated system benefits.
When any policy or scheme is conceptualised or implemented by the central or state government, they are typically motivated by strategic policy considerations and a long-term vision for the nation’s development. For instance, efforts to promote clean cooking (PIB 2023) aim to reduce reliance on conventional biomass, thereby reducing air pollution and improving the quality of life. Similarly, the PM Surya Ghar: Muft Bijli Yojana seeks to accelerate India’s clean energy transition, with a broader vision to empower households to be energy-resilient and self-sufficient.
However, the effectiveness and impact of the scheme depend not only on deployment but also on sustained performance over the long term. Poor maintenance practices can lead to suboptimal performance, undermining both the consumer experience and broader policy objectives. More importantly, this ineffectiveness can result in substantial economic losses, challenge the credibility of future initiatives, and serve as a barrier to the nation’s aspiration to transition from a developing to a developed economy. To assess these implications, this study evaluates three key indicators of policy effectiveness: capital subsidy efficiency, the grid rebound effect and associated electricity subsidy exposure, and emissions-reduction outcomes (Table 5). Detailed formulations for estimating these indicators are presented in Annexure C.
Table 5. RTS underperformance has a grave impact on subsidy efficiency, emissions & more
| Metrics | What it captures | Policy relevance |
|---|---|---|
| Capital subsidy efficiency | Electricity generated per unit of capital subsidy | Determines the effectiveness of capital subsidy |
| Grid rebound effect and associated subsidy exposure | Quantifying the electricity subsidy is required due to increased grid consumption resulting from lower RTS generation | Reflects fiscal implications for state governments |
| Emissions reduction | CO2 emissions avoided through RTS generation | Measures contribution to climate commitments |
Source: Authors' analysis
Erosion of subsidy effectiveness
Capital subsidies have been a key policy lever for promoting the adoption of RTS in India. From the launch of the National Solar Mission in 2010 to the PM Surya Ghar: Muft Bijli Yojana in 2024, capital subsidies have been provided to reduce the high upfront cost barrier for consumers. The realised value of this support, however, is linked to the electricity generated by subsidised systems over their lifetime.
Due to poor maintenance, if generation falls below the expected level, the effective subsidy per unit of electricity generated exceeds the intended level, implying that the outcomes of the allocated subsidy are not being fully realised. For example, if the government allocates a budget of INR 100 to generate 200 units of electricity, the implicit subsidy is INR 0.50 per unit. However, if only 150 units are generated, the per-unit subsidy rises by 50 per cent to INR 0.75 per unit. In such cases, the financial support intended to facilitate a clean energy transition becomes a sunk cost rather than a productive investment.
Irregular maintenance practices may result in up to 80% erosion in the effectiveness of capital subsidies
The PM Surya Ghar: Muft Bijli Yojana aims to install 30 GW of RTS capacity in the residential sector, with an estimated electricity generation of 1,000 billion units (BU) over its lifetime. To achieve this, the MNRE has allocated a substantial budget of INR 657 billion (65,700 crore) exclusively for capital subsidies, translating into a subsidy of INR ~0.66 per unit of expected lifetime generation. However, this calculation holds only if the installed capacity can sustain the expected long-term performance. Figure 4 illustrates the ineffectiveness of the subsidy across different scenarios, given an installed capacity of 30 GW.
Key insights emerging from the analysis:
• The subsidy’s ineffectiveness could range from 20 per cent in the moderate scenario to 80 per cent in the worst-case scenario. This implies that 80 per cent of the allocated subsidy would no longer be utilised effectively.
• The results also indicate that achieving the originally expected generation outcomes may require additional capacity deployment. For example, in the moderate scenario, the 198 BU generation9 shortfall would require approximately 6 GW of additional RTS capacity over 25 years (assuming ideal scenario, i.e., 15 per cent CUF). In the worst-case scenario, an additional 24 GW may be required. Assuming an average system size of 3 kW, this would translate into additional subsidy expenditure of INR 156 billion - INR 624 billion (15,600 crore - 62,400 crore), depending on the performance scenario10.
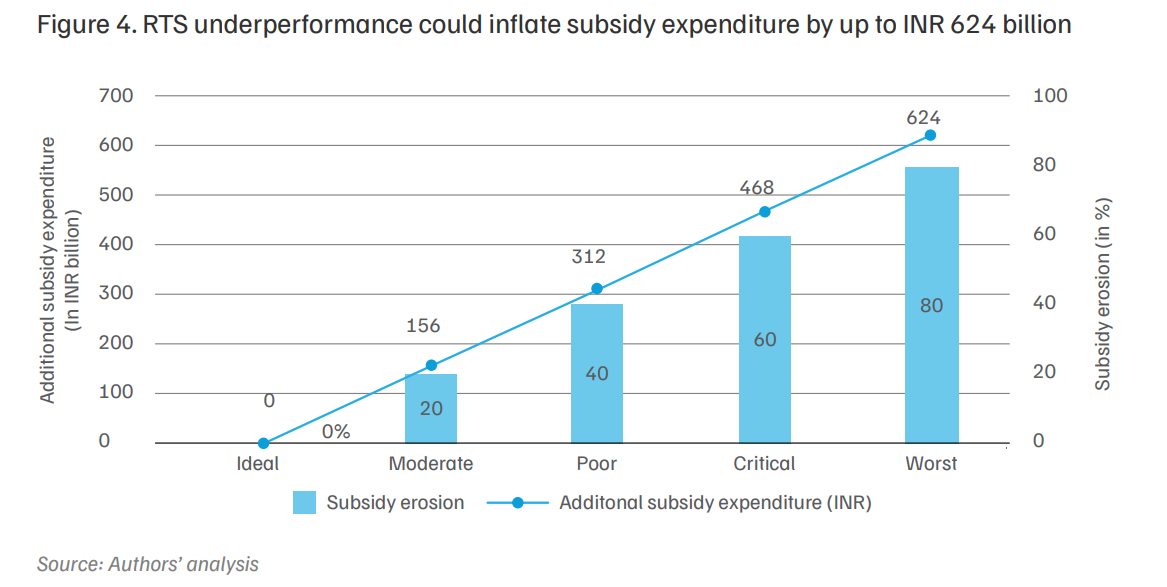
Note: The above estimates are based on a simplified proportional approach that assumes the full subsidy allocation is disbursed and benchmarked against projected lifetime generation. The analysis evaluates the extent of subsidy erosion under different generation shortfall scenarios by comparing actual generation to the ideal case. In practice, however, capital subsidies under the scheme are disbursed in phases and linked to installation milestones rather than lifetime performance. Therefore, the calculated erosion figures should be interpreted as indicative estimates of efficiency loss rather than actual fiscal losses. The methodology is intended to illustrate potential risks to subsidy effectiveness under sustained underperformance, rather than to measure realised financial outflows.
Understanding the grid-rebound effect in the context of retail tariff subsidies
In India, the residential segment is heavily subsidised to provide affordable energy and support basic living standards for low- and middle-income consumers. There are two types of subsidies:
• Cross-subsidy: where a higher tariff is levied on commercial and industrial (C&I) consumers to offset and cross-subsidise the tariff for residential or agricultural consumers.
• Per-unit subsidy: The other is direct fiscal support from the state government on retail tariffs, enabling households to pay a reduced tariff.
Besides these mechanisms, some states/UTs (Delhi, Bihar, Punjab, Tamil Nadu, etc.) also provide free electricity up to a specified consumption limit. A total of 16 states and UTs provide residential tariff support through either per-unit subsidies or free electricity schemes. This directly benefits low-consumption households. All of these measures can impose a substantial economic burden on both the state and the central governments.
RTS adoption can lead to reduced subsidy requirements: By enabling on-site generation, RTS systems help meet consumer electricity demand and reduce reliance on the grid. Over time, this is expected to gradually phase out the subsidy burden associated with providing cheaper grid electricity. To make RTS installations more affordable, the central government offers capital subsidies, and several states/UTs, including Delhi, Odisha, Uttar Pradesh, and Assam, offer a top-up on central subsidies.
RTS underperformance and the risk of dual subsidisation: However, a poorly maintained system yields lower-than-expected energy generation, leading consumers to revert to drawing electricity from the grid (termed the grid rebound effect). This creates a dual financial challenge for the state, as it incurs costs for the capital subsidy supporting RTS adoption while simultaneously spending on retail tariff subsidies. Therefore, it represents a latent financial and policy risk, underscoring the importance of sustained system performance to achieve the scheme’s intended outcomes.
Quantifying the grid rebound effect and additional subsidy burden
This impact is particularly pronounced in states/ UTs that offer state-level subsidies for installing RTS as well as for retail electricity tariffs. These include Delhi, Assam, and Uttar Pradesh. For the present case study, Assam has been considered as the reference state. Assam provides an additional state subsidy of INR 15,000 per kW (APDCL 2024), capped at INR 45,000 per consumer, on top of the central subsidy. Additionally, the state offers a retail electricity subsidy of approximately INR ~1 (APDCL 2025) per unit for residential consumption up to 500 units. In FY 25, Assam government has already allocated INR 5 billion (500 crore) for the same (North East Live 2025).
When an RTS system performs as expected, consumers with an RTS should ideally be able to meet a certain percentage of the total electricity demands from RTS systems. This can optimise the state’s subsidy expenditure and benefit consumers without RTS who rely entirely on grid power, which is the policy’s intended outcome. However, if the RTS system underperforms, consumers with RTS also tend to rely on grid electricity, thereby increasing the subsidy burden on the state.
With unchanged subsidy provision, additional lifetime costs could exceed INR 8 billion (₹800 crore)
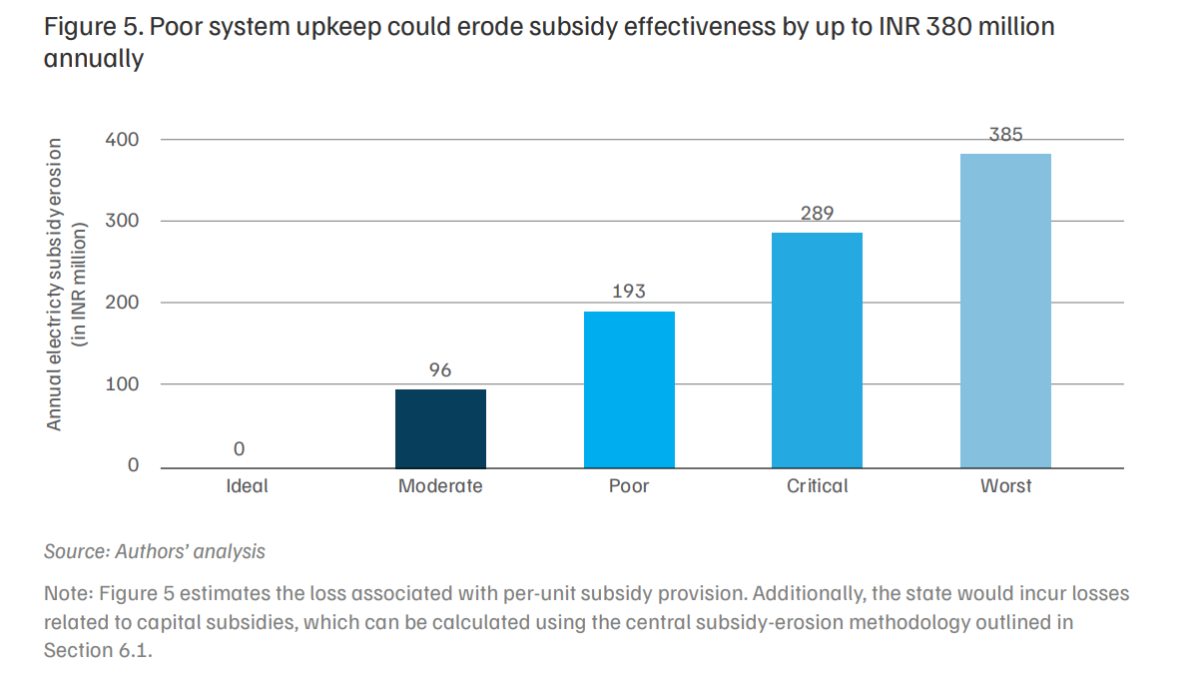
Analysis indicates that, for Assam’s installed RTS capacity of ~370 MW (as of April 2026; MNRE 2026), annual electricity generation could reach ~490 GWh under ideal conditions (refer to the scenario in Table 1). In the worst-case scenario, generation could decline to 100 GWh. The resulting generation shortfall would need to be met through grid electricity, potentially increasing annual subsidy expenditure by up to INR ~380 million (INR 38 crore; ~8 per cent of the allocated subsidy budget), as illustrated in Figure 5.
Emissions reduction outcomes
RTS not only empowers households to be energyindependent and self-sufficient but also focuses on reducing carbon emissions. A 1 kW system can reduce up to ~25 tonnes of CO2 (tCO2 ) over its lifetime (i.e., 25 years)11.
Considering the broader vision to achieve net zero by 2070, RTS is expected to play a key role in reducing electricity-related emissions while facilitating longterm decarbonisation opportunities. However, when the RTS system underperforms due to poor maintenance practices, the intended emission reduction doesn’t materialise. This can directly affect the national net-zero ambitions. Therefore, ensuring regular upkeep of the RTS systems is critical not only for financial returns but also for realising their full environmental benefits.
Poor maintenance practices could delay India’s net-zero ambitions
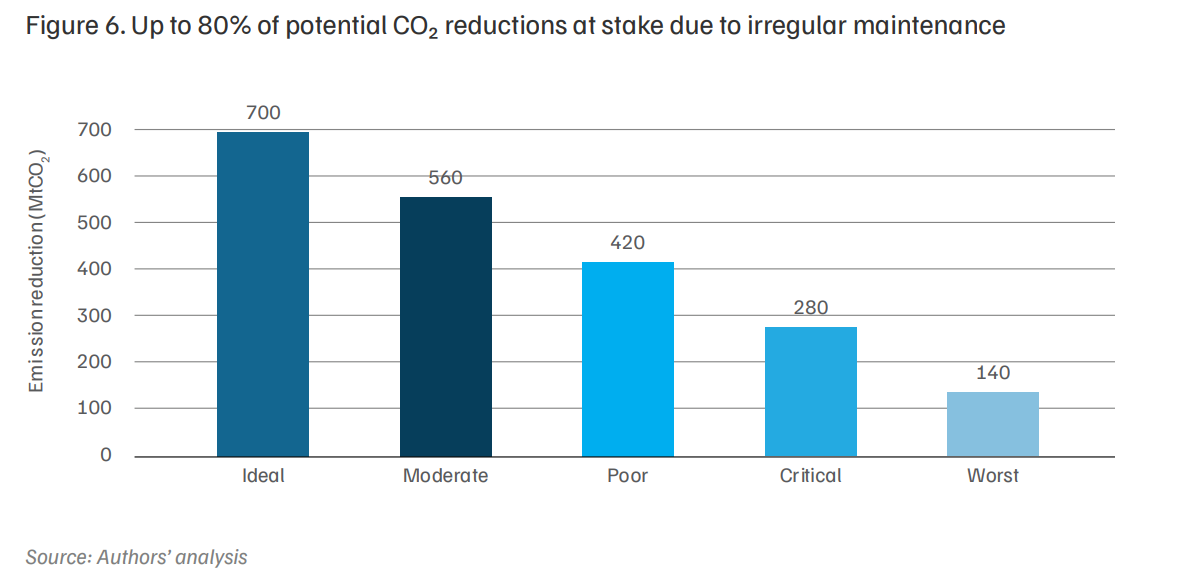
The national RTS target of 30 GW could result in cumulative savings of ~700 million tonnes of CO2 (MtCO2 ) over the lifetime (i.e., 25 years). However, in the worst-case scenario, where system performance is severely compromised, the potential emission reduction could decline by up to 80 per cent (Figure 6). Such a shortfall would significantly undermine the efforts to meet India’s commitment to achieving netzero emissions within the stipulated timeline.
The gaps identified in Section 2.2 in terms of awareness, standardisation, and consistency in O&M service delivery highlight not only system-level weaknesses but also a significant untapped market opportunity within the residential RTS sector. As installation capacity is scaled up, the cumulative base of systems requiring periodic servicing is expected to grow rapidly, driving rapid expansion of an emerging economic opportunity.
Cleaning services alone represent a multi-billion annual market
Based on the current installed capacity of ~10 GW, the estimated annual total addressable market (TAM)12 for cleaning services alone in the residential O&M segment is nearly INR 19 billion (INR 1900 crore; considering a monthly cleaning frequency)13. Achieving the 30 GW target by 2027 would expand the TAM by ~3 times to nearly INR 54 billion (5,400 crore).
Bundled maintenance services expand the revenue pool significantly
Moreover, considering the broader O&M market, including full-service packages (such as basic system health checks and electrical inspections) rather than cleaning alone, the market potential increases substantially.
Under the current installed capacity of ~10 GW, the annual TAM for bundled AMC services is estimated at approximately INR ~50 billion (INR 5,000 crore; considering a monthly frequency)14. At 30 GW of residential capacity, the potential expands to nearly INR 144 billion (14,400 crore). The magnitude of this expansion reflects not only installation growth but also the compounding effect of recurring service demand. Figure 7 illustrates the state-level TAM for bundled AMC services based on the current installed capacity (considering a monthly service frequency).
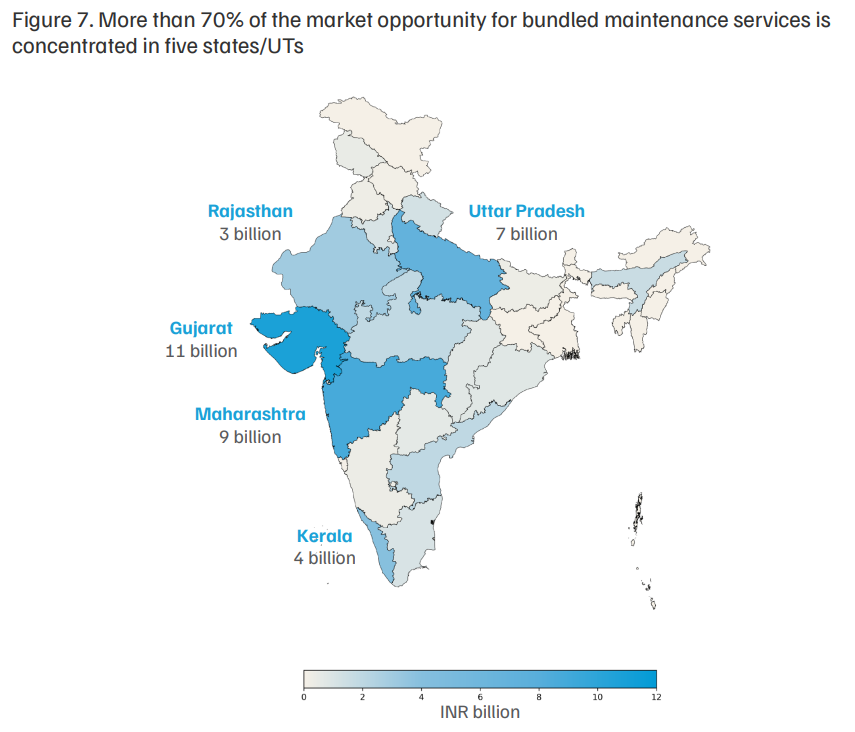
Source: Authors’ analysis
Note: All values are in INR. bn-billion; The estimated market values are based on the current installed residential RTS
capacity of 10 GW, considering a monthly service frequency
The actual realisation depends on consumer uptake
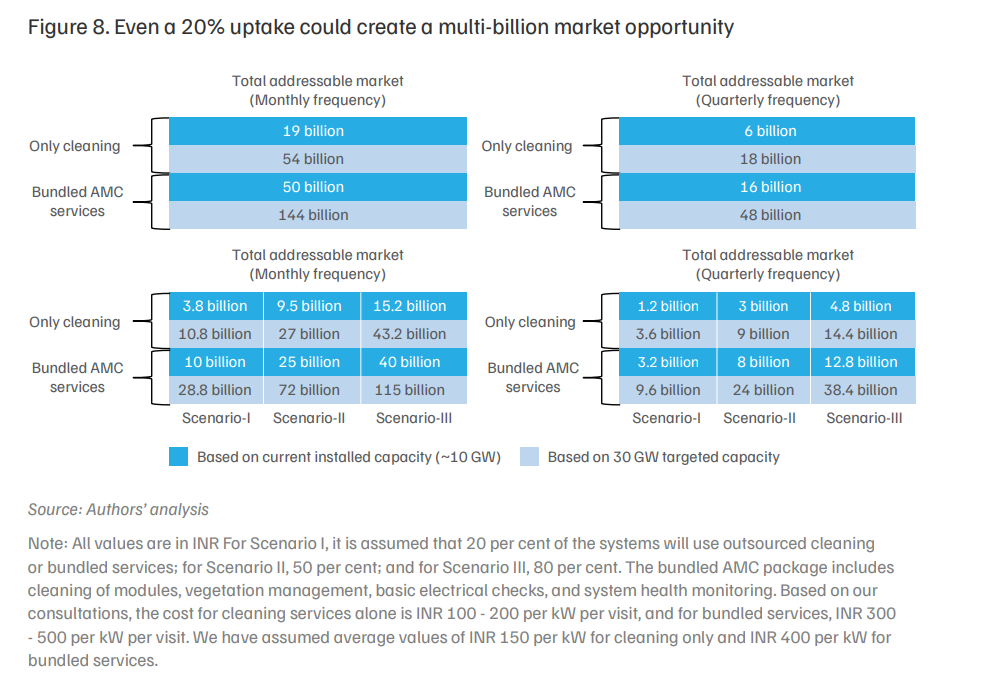
The total serviceable market (TSM) is expected to be less than the TAM, as not all consumers are likely to outsource cleaning or bundled AMC services. The following estimates assume a 50 per cent participation level and a monthly service frequency scenario to reflect realistic adoption rather than the theoretical maximum.
Under the current installed capacity (10 GW):
• Cleaning-only services yield an estimated annual TSM of INR ~9.5 billion (950 crore)
• Bundled AMC services yield INR ~25 billion (2,500 crore).
If the installed capacity reaches 30 GW:
• Cleaning-only TSM could increase to INR ~27 billion (2,700 crore).
• Bundled AMC TSM could increase to INR ~72 billion (7,200 crore).
While the figures above assume that half of the adopters opt to outsource maintenance services, in reality, the market is expected to grow more gradually. In the initial years, adoption of bundled maintenance services may be around 10 per cent, but as early users demonstrate the benefits, uptake could increase exponentially
Figure 8 demonstrates the sensitivity analysis across uptake scenarios of 20 per cent, 50 per cent, and 80 per cent, and shows that the realised market size is highly contingent on consumer participation levels and frequency of services. The extent to which the theoretical revenue pool converts into actual service demand will depend on improvements in awareness, service standardisation, and trust in maintenance providers.
Along with significant market opportunities, the O&M sector also holds strong employment potential. Considering the national target of 30 GW of rooftop solar capacity, this could generate approximately 0.33 million (3.30 lakh15) jobs in the O&M sector (CEEW, NRDC 2026).
The earlier chapter established that residential RTS O&M represents a multi-billion recurring service market. Yet the O&M market remains highly fragmented, largely unorganised, and lacking standardisation in service protocols and quality benchmarks. This structural gap, combined with the significant and underpenetrated market opportunity, presents a compelling chance to develop a scalable business model that can institutionalise maintenance practices and ensure consistent, reliable service delivery across states/UTs.
The subsequent sections present two business models to create a structured, accountable, and mainstream maintenance ecosystem by introducing structured service schedules, establishing uniform quality benchmarks, and leveraging technologyenabled monitoring systems.
• Platform-led marketplace model driven by private aggregation.
• Pay-per-use service model anchored in oversight by discoms or state nodal agencies (SNAs)16.
Platform-led marketplace model driven by private aggregation
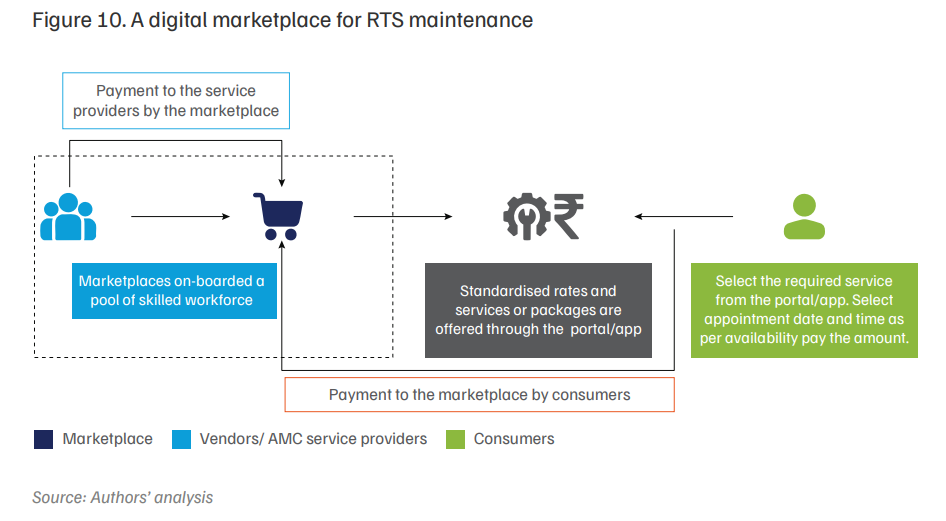
The untapped demand can independently drive market growth, but the significant potential here calls for a more structured approach, one that leverages existing marketplaces operating in analogous service categories, such as electrical appliance servicing, AC maintenance, and related trades. Given that discoms and SNAs may face resource and operational constraints in taking on additional monitoring and verification responsibilities, the proposed model explores an alternative: anchoring service delivery through established third-party platforms (such as Urban Company, TaskRabbit, or Sulekha). Under this framework, operational responsibilities, including performance verification and service assurance, are delegated to private entities, creating a fully service-driven model with independent accountability mechanisms. (Figure 10).
Step-by-step operational mechanism:
• Onboard service providers: The marketplace aggregates a pool of skilled workers and onboards them to the platform. The operator conducts credential verification and periodic compliance checks to ensure service reliability.
• Service packages: The platform will publish standardised service packages, including bundled AMC plans and standalone services such as cleaning or equipment checks. Each package must clearly define scope, pricing, and service frequency. Modular offerings enable consumers to choose services that match their system size and maintenance requirements, much as urban companies like service platforms offer differentiated packages for household repairs or similar services.
• Consumer subscription & payment: Consumers shall have the flexibility to select a service package that best suits their needs. Upon choosing the package (bundled or standalone), they may schedule a service slot through the portal according to their convenience and complete the corresponding payment.
• Service delivery: Upon receiving the service request, the marketplace shall assign a service provider and carry out the service at the scheduled time slot. The service provider must complete a pre- and post-feasibility checklist to document the system’s condition and confirm that no damage occurred during service delivery. Additionally, the service provider must submit geo-tagged photographs along with the consumer’s digital signature via the portal or application (similar to an e-commerce delivery confirmation process), thereby providing verifiable proof of service and reinforcing vendor accountability.
• Verification & payment disbursement: Upon service completion and documentation compliance, payments are released to the service provider in accordance with platform policies. Verification mechanisms should be proportionate, ensuring accountability without introducing administrative delays that undermine service efficiency.
Prerequisites to operationalise the proposed model.
• A marketplace aggregator model or platformled ecosystem must be established to coordinate private service providers and existing market players. The platform would enable service discovery, transaction facilitation, and service tracking, creating a structured ecosystem similar to urban service marketplaces. Existing players may also be incentivised to offer services through the platform to enhance market depth and consumer choice.
• MNRE to articulate clear operational guidelines and standardised SOP for O&M, including minimum technical standards and procedural requirements. These guidelines should define service scope, maintenance protocols, and performance benchmarks to ensure consistent service quality across providers and system sizes. Benchmark standards will support quality assurance and accountability.
• Availability of a skilled workforce pool capable of delivering standardised O&M services across locations. Workforce readiness may require structured training, certification pathways, and quality assurance mechanisms to ensure service competence and consistency
Risks and limitations:
• Consumer trust in private platforms may vary, particularly in smaller towns. Quality heterogeneity may emerge if oversight mechanisms are weak. Additionally, performance data may remain siloed unless formal datasharing arrangements are established.
Pay-per-use service model anchored in oversight by discoms or state nodal agencies
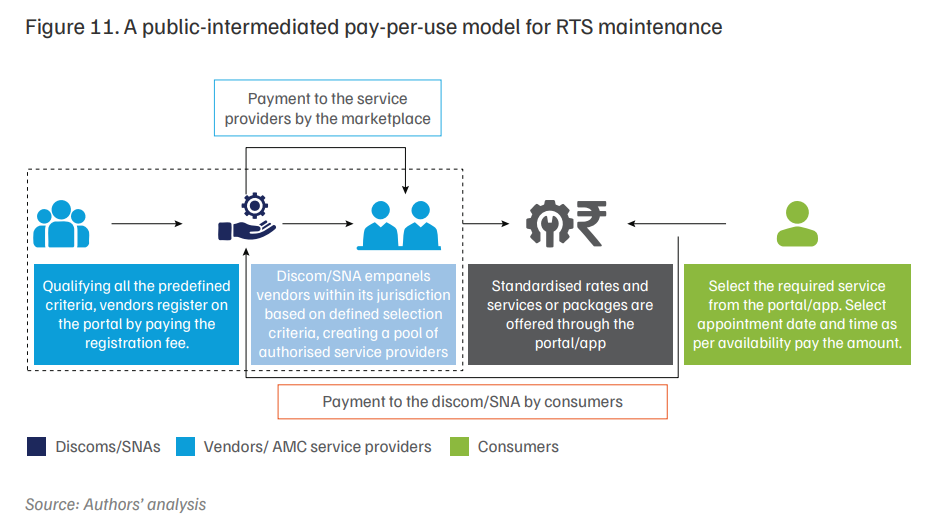
While the earlier model relies entirely on thirdparty market operators with minimal government intervention, it carries notable limitations, including concerns regarding consumer trust, besides accountability and data privacy risks. To address these gaps, the present model posits that discoms or a state nodal agency (SNA)17 act not as a service provider, but as an accountable intermediary that standardises18, verifies, and facilitates O&M transactions between consumers and empanelled vendors (Figure 11).
Step-by-step operational mechanism:
• Vendor empanelment: Upon fulfilling the eligibility criteria (e.g., technical qualifications, experience, service capacity, service locations, skill sets, and feedback from the PM Surya Ghar portal), vendors or AMC service providers shall register on the portal. Discoms/SNAs will review applications and onboard eligible vendors (A nominal registration fee may be applicable).
• Service packages: Empanelled vendors or AMC service providers shall publish standardised AMC packages that detail both bundled (one-time and long-term) and standalone services (e.g., only cleaning or inverter checks), with clearly defined scope, frequency, and pricing. The packages shall be modular, allowing them to suit different system sizes and consumer needs.
• Consumer subscription & payment: Consumers shall have the flexibility to select a service package that best suits their needs. Upon choosing the package (bundled or standalone), they may schedule a service slot through the portal according to their convenience and complete the corresponding payment.
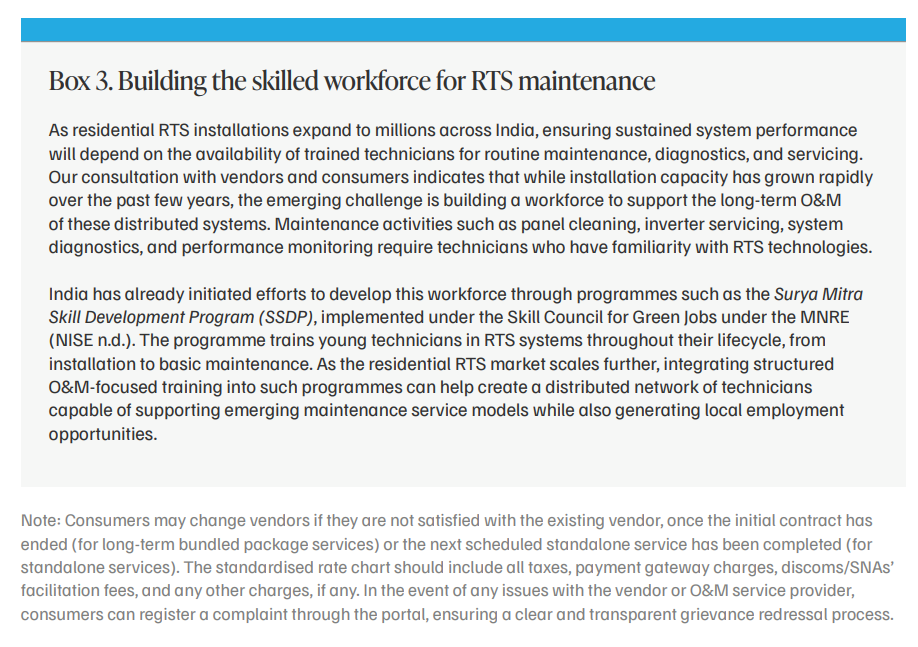
• Service delivery: Upon receiving the service request, the selected vendor shall be notified and they will carry out the service in the scheduled time slot. The service provider must complete a pre- and post-feasibility checklist to document the system’s condition and confirm that no damage occurred during service delivery. Additionally, the vendor must submit geo-tagged photographs along with the consumer’s digital signature via the portal or application (similar to an e-commerce delivery confirmation process), thereby providing verifiable proof of service and reinforcing vendor accountability. Such standardised service delivery relies on a trained workforce capable of supporting a large-scale RTS O&M ecosystem (see box 3).
• Verification & payment disbursement: The SNAs or discoms shall review the submitted documentation and proof of service. Upon successful verification, payment shall be disbursed to the vendor, with the discoms/SNAs retaining a specified percentage as a facilitation or transaction fee, where applicable.
Prerequisites to operationalise the proposed model:
• A dedicated digital application or portal shall be developed to enable invoice generation, service tracking, and documentation, ensuring transparency, traceability, and streamlined verification of service delivery. Alternatively, the existing National RTS portal may be leveraged.
• A structured grievance redressal mechanism may be needed for post-installation maintenance services, as the current system only covers issues up to installation and does not address servicerelated complaints or disputes thereafter.
• MNRE must articulate clear operational guidelines and standardised SOP for O&M, including minimum technical standards and procedural requirements. These guidelines should define service scope, maintenance protocols, and performance benchmarks to ensure consistent service quality across providers and system sizes. Benchmark standards will support quality assurance and accountability.
• Adequate institutional capacity, including dedicated human resources at the SNAs or discoms level, may be required to oversee verification, process documentation, monitor compliance, and ensure timely approval and disbursement under the proposed framework.
Risks and limitations:
• The primary constraint is institutional bandwidth. Discoms and SNAs may already be under operational pressure. Additional verification and oversight responsibilities must be supported by dedicated resources. Administrative rigidity could also reduce flexibility in service innovation.
As deployment scales to tens of millions of households, the ecosystem must focus not only on installation but also on ensuring sustained system performance over the operational lifetime of RTS systems. The report highlights several structural challenges affecting the development of a robust maintenance ecosystem. These include limited visibility into RTS generation data, a lack of standardised maintenance guidelines, limited skill sets, and low consumer awareness of routine system upkeep.
While foundational initiatives have established a baseline for mainstreaming, several unresolved challenges remain. Table 6 presents a strategic roadmap outlining key steps to strengthen the RTS system performance. However, it should be noted that the proposed interventions are primarily forwardlooking, as implementing most of the interventions, such as mandating remote monitoring for existing RTS installations, may impose additional retrofit costs and face technical compatibility constraints with legacy systems.
Table 6. Strategic roadmap for strengthening system performance in India’s residential RTS ecosystem
| Ecosystem challenge | Recommendation | Key stakeholders | Long-term sectoral benefits |
|---|---|---|---|
| Limited regulatory oversight and poor visibility of RTS generation data |
|
MNRE, CEA, discoms/SNAs, inverter manufacturers, platform operators, BIS. |
|
| Low consumer awareness of maintenance requirements |
|
MNRE and discoms/ SNAs |
|
| Fragmented vendor ecosystem and a lack of standardised maintenance practices |
|
MNRE, discoms/ SNAs, and RTS vendors | Standardised frameworks will promote market uniformity and vendor accountability by establishing clear service benchmarks and digital compliance mechanisms, thereby enhancing service quality and consumer confidence. |
Source: Authors' analysis
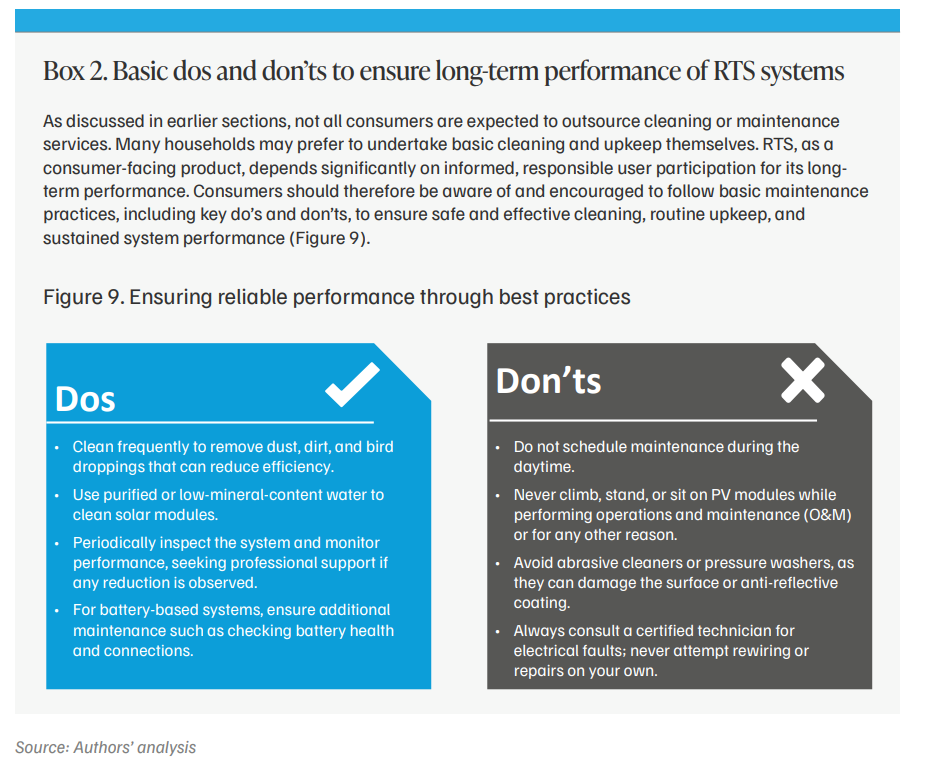
No, rooftop solar systems require minimal maintenance; periodic cleaning (Preferably biweekly) and basic inspections to ensure optimal performance are usually sufficient.
Schedule maintenance during early morning or near sunset to avoid disrupting generation. Clean panels using water and a soft microfibre cloth, preferably low-mineral water. Avoid abrasive cleaners or pressure washers, and do not climb or stand on panels.
A solar meter usually records your solar generation, but its installation depends on your state and electricity service provider. Additionally, a smart inverter can also track your solar generation and is generally connected to a mobile app via Wi-Fi for real-time monitoring.
What Drives Rooftop Solar Installation Decisions in Indian Homes?
Building a People-centric Energy Future:
Roadmap of the methodology to assess the climate co-benefits of the SUP ban in Tamil Nadu

Roadmap of the methodology to assess the climate co-benefits of the SUP ban in Maharashtra