Council on Energy, Environment and Water Integrated | International | Independent

Suggested Citation: Jain, Himani, Neerav Sharma, Samradh Singh Chauhan, Saoni Sanyal, and Sourav Dhar. E-Bus Route and Service Planning in Emerging Public Transport Cities: Methodology and Tool for the PM e-Bus Sewa Cities. New Delhi: Council on Energy, Environment and Water (CEEW), 2026.
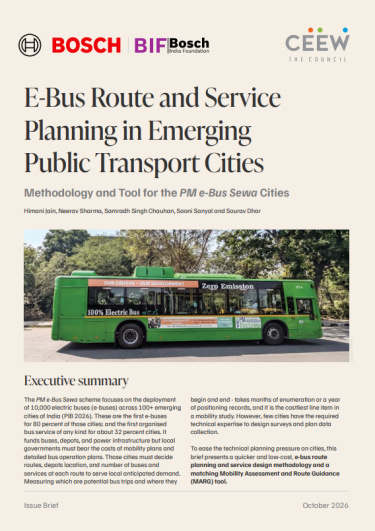
The PM e-Bus Sewa scheme focuses on deploying 10,000 electric buses (e-buses) across 100+ emerging cities of India (PIB 2026). 80 per cent of these cities are getting e-buses for the first time. 32 per cent of these cities are developing organised bus service for the first time.
Cities must decide routes, depot locations, and the number of buses and services on each route to serve anticipated local demand. Identifying potential bus trips could take months of enumeration, and is the costliest line item in the mobility study. Few cities have technical expertise to design surveys and plan data collection, especially smaller ones. Such small cities (with population < 5 lakh) make up 55% of the sanctioned cities, and are least likely to hold any comprehensive mobility plans and/or bus operations expertise. The scheme funds operations, depots and power infrastructure, but the local government must bear the costs of mobility plans and detailed bus operation plans.
To ease this technical planning pressure, this issue brief presents a quicker, lower-cost e-bus route and service planning methodology and a matching Mobility Assessment and Route Guidance (MARG) tool. The methodology was developed based on approved routes in four case cities in Punjab: Ludhiana, Amritsar, Jalandhar and Patiala, covering typical city sizes, types, varied vehicle ownerships and modal shares of Scheme cities (CEEW and SG Architects 2026).
The matching MARG tool is an evolving machine-learning model that is trained on the four case cities methods and results. The brief validates the methodology and MARG tool on Bhubaneswar, a city with an established public transit network, using passive mobile data, and is explicit that MARG is a work in progress.
Figure 1. The MARG tool takes a city from its boundary to a ranked bus network through five connected stages
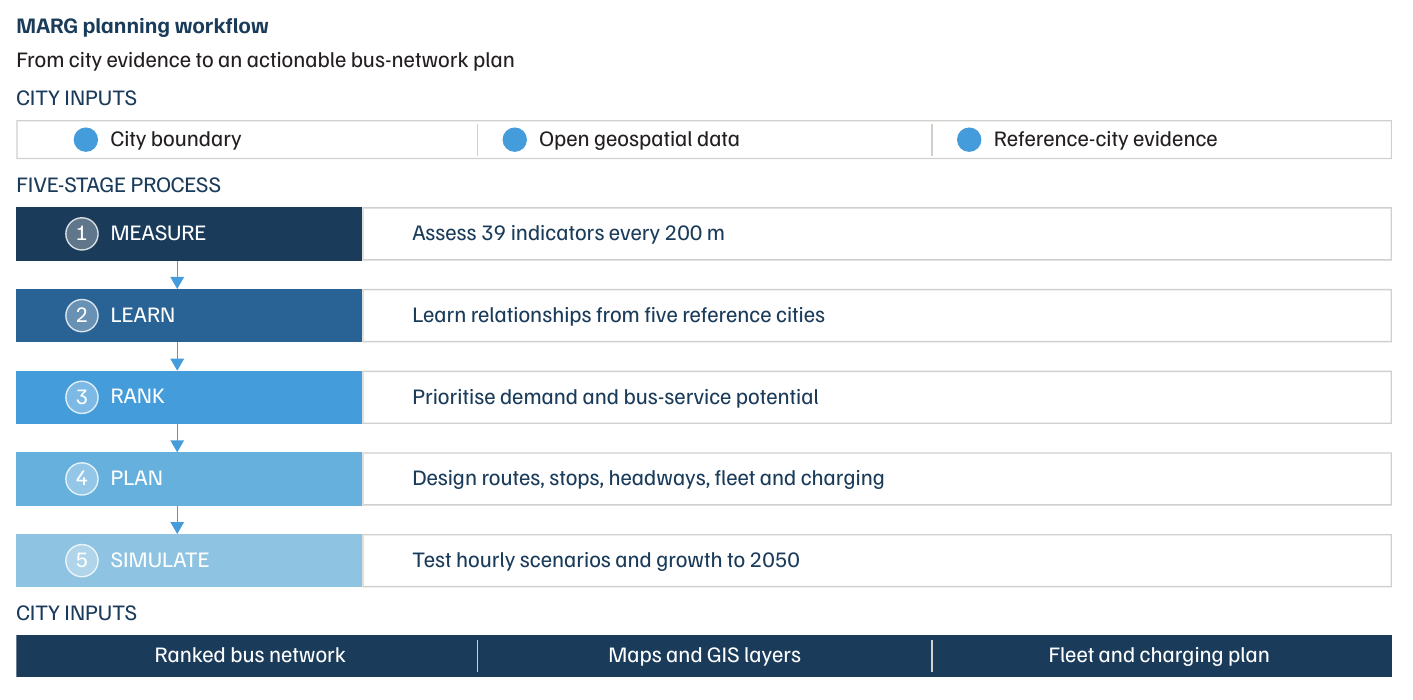
The brief finds that limited data need not mean limited planning. The tool uses only publicly available geospatial layers to estimate demand, rank corridors, and propose candidate routes and stops for a new city. Its outputs feed a digital twin in which planners can edit routes and test fleet and growth scenarios.
The PM e-Bus Sewa scheme focuses on the deployment of 10,000 electric buses (e-buses) across 100+ emerging cities of India (PIB 2026). These are the first e-buses for 80 percent of those cities; and the first organised bus service of any kind for about 32 percent cities. It funds buses, depots, and power infrastructure but local governments must bear the costs of mobility plans and detailed bus operation plans. Those cities must decide routes, depots location, and number of buses and services at each route to serve local anticipated demand. Measuring which are potential bus trips and where they begin and end - takes months of enumeration or a year of positioning records, and it is the costliest line item in a mobility study. However, few cities have the required technical expertise to design surveys and plan data collection.
To ease the technical planning pressure on cities, this brief presents a quicker and low-cost, e-bus route planning and service design methodology and a matching Mobility Assessment and Route Guidance (MARG) tool.
E-bus route and service planning methodology is a robust yet quick approach that combines available Census and ward-level data with targeted small surveys. It models ridership across multiple mode-shift scenarios and jointly optimises route and charging requirements. The targeted surveys focus on immediate demand that can shift from Intermediate Public Transport (IPT); and potential two-wheeler users, cyclists, and regional bus users. This approach enables cities to develop practical bus operations plans using existing institutional capacity and limited data. CEEW and SG Architects' forthcoming study applied the methodology successfully to four case-cities, in three popular city population categories (<5 lakhs, 5-10 lakhs and 10-20 lakhs) of PM e-Bus Sewa.
Mobility Assessment and Route Guidance (MARG) tool is an evolving machine learning based tool which treats origin-destination evidence as a shared asset rather than a per-city purchase. The four case-cities train the tool’s framework. The tool has learned how travel demand and route feasibility relate to measurable urban form. It uses only open geospatial layers and no measurement of its own, to apply that learning to a new case-city. Powered by a digital twin, the tool ingests a city’s municipal boundary to provide an interactive demand surface, ranked transit corridors, candidate routes, and optimised stops. The digital twin can edit; step through hour by hour; and test under alternative fleet, route, and growth scenarios for near-future projections. A tool in continual development evolves as cities use it to develop their interim routes, refining demand-urban form algorithms.
Our methodology and MARG tool are validated on Bhubaneshwar, a city with an established and robust public transit network. Three results validate the tool and methodology using passive GPS mobile data.
Our method and tool, both, strive to inform the Scheme that does not just delivers buses, but one that delivers robust bus systems in cities. They are intended mainly for target Scheme cities where no formal bus-route network exists, e-buses are being introduced, and origindestination datasets are not in existence–and where technical capacity is limited and budget outlay planning is inconsistent.
Unlike conventional diesel buses, e-buses have a fixed range, need opportunity charging and depend on strategically located depots with charging infrastructure, so their operations are more complex. The scheme provides viability gap funding of INR 22-24 per km for 10 years or until March 2037, along with full funding for behind-the-meter power infrastructure and limited capital assistance for depots (MoHUA 2023). Cities and states carry the residual operating gap and all service planning. There are no dedicated funds for bus-system planning. A city starting from zero has no route history, no ridership record and no operations team, yet the depot, grid connection, terminal, stops and chargers all follow from the route plan.
It draws on three sets of inputs. The first is an existing mobility baseline: Census 2011 work-trip data, comprehensive mobility plans where available, and projects under the Jawaharlal Nehru National Urban Renewal Mission and the Smart Cities Mission. The second is a spatial baseline of the road network, ward-level land use and population density, and major trip attractors. The third is short, targeted primary surveys using the ‘potential-user’ approach, focusing on three-wheeler, two-wheeler, cycle and regional bus users who are most likely to shift to buses. They combine video-based vehicle counts and occupancy recordings in peak and off-peak periods with user surveys at high-footfall locations. Origin-destination samples range from 500–1200 based on city population, spread across 30–45 locations. Sampling is purposive and demand-based, not random, so these ratios indicate corridor coverage intensity rather than a statistical sampling fraction. The outputs are mode-shift scenarios, a network plan for the first 50–100 sanctioned e-buses, a route and service plan, and a charging and service schedule plan.
MARG is a machine-learning-based planning-support tool that works through five connected stages: measure, learn, rank, plan and simulate. It assesses 39 spatial, mobility and land-use indicators at 200-m intervals along the classified road network, learns how demand and route feasibility relate to urban form from the reference case-cities, and ranks locations by combining a corridor model and a demand model. It then turns priority locations into candidate routes and loads them into a digital twin, where planners can edit routes and stops, change fleet sizes and compare scenarios hour by hour. The Bhubaneswar base data holds more than 200 bus stops, 67 wards, 73 bus routes and 2,23,662 building footprints and a large OD dataset from passive mobility data. Thus, it can enter at the ‘plan’ stage. A city with only a municipal boundary and basic land use data shall start at the ‘measure’ stage. MARG does not finalise a network: it presents a feasible set of routes for local refinement.
On Bhubaneswar, which was held out of training, the corridor model returned an AUC of 0.837, with precision of 79.4 per cent (about four in five recommended locations sit on a real route) and recall of 0.542, meaning it is selective rather than reproducing the whole network. Across the four Punjab cities, leave-one-city-out testing gave a mean AUC of 0.905, ranging from 0.882 for Ludhiana to 0.953 for Amritsar. The top 30 per cent of predicted demand locations account for 77.2 per cent of observed trips. The issue brief also mentions the limits. Every number rests on four training cities, one validation city, and one city is one observation. MARG is not a validated microsimulation: it performs no link-level traffic assignment, its congestion representation is a strategic index, and its land-use projection modules are specified rather than validated.
For new cities and their transit undertakings, it recommends starting route planning now. Emerging transit cities can start building the core network around the 3–10 km trip band, mapping depot-to-route distances before finalising routes. They must treat MARG outputs as an interim position to be refined with local officials and operators. For the MARG tool itself, it recommends widening the training and validation base with the help of cities, and applying a common set of datasets, indicator definitions and quality checks across cities. We recommend that MoHUA measure and offer the technical assistance and training requirements for new city transport undertakings and special purpose vehicles. It must also fund a few city-wide passive mobility measurements, as shared, national digital data.
Microbuses have Mega Demand in Indian Cities
Are Microbuses Suitable as Public Transport Vehicles?
Greenhouse Gas Accounting for On-road Transport Emissions