Home
Council on Energy, Environment and Water Integrated | International | Independent

REPORT
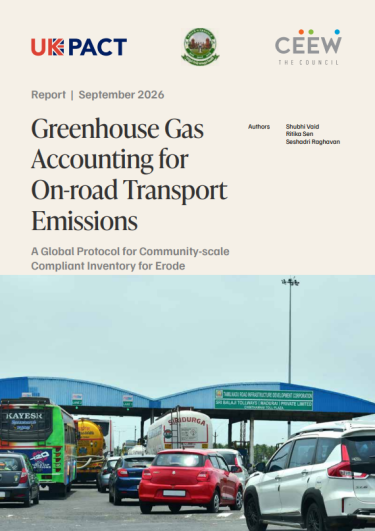
Greenhouse Gas Accounting for On-road Transport Emissions
A Global Protocol for Community-scale Compliant Inventory for Erode
10 September, 2026 | Sustainable Mobility
Shubhi Vaid, Ritika Sen and Seshadri Raghavan

Suggested Citation: Vaid, Shubhi, Ritika Sen, and Seshadri Raghavan. 2026. Greenhouse Gas Accounting for On-road Transport Emissions: A Global Protocol for Community-scale Compliant Inventory for Erode. New Delhi: Council on Energy, Environment and Water.
Overview

India's transport sector contributes about 14 per cent of national greenhouse gas (GHG) emissions, and on-road transport accounts for roughly 90 per cent of that. Tier-2 and tier-3 cities, where population, vehicle ownership, and freight demand are rising fastest, remain largely absent from this evidence base. Constrained by data availability, technical capacity, and finance, these cities cannot establish an emissions baseline, prioritise mitigation measures, or track progress against state and national commitments.

This study develops a Global Protocol for Community-Scale Greenhouse Gas Emission Inventories (GPC)-compliant accounting framework for on-road transport emissions in Erode Municipal Corporation (EMC), Tamil Nadu, and translates it into an Excel-based GHG calculator and a website version for EMC. The framework adopts a bottom-up, modified production-based method (Activity–Share–Intensity–Emission Factor) at the GPC BASIC+ reporting level, covering Scope 1 tailpipe emissions, Scope 2 emissions from grid electricity used by electric vehicles, and selected Scope 3 emissions such as transboundary trips and transmission and distribution losses. The calculator supports annual inventory updates and scenario modelling to 2045, and is designed to be transferable to other tier-2 and tier-3 Indian cities working with comparable data and institutional capacity.

The study recommends integration of the calculator into comprehensive mobility plans and master plans; targeting high-emission-intensity diesel freight and buses through scrappage-linked incentives and green freight access zones; accelerating electrification across high-volume and public fleet segments; strengthening in-use emissions compliance at city cordon points and through permit-linked Pollution Under Control enforcement; and institutionalising data-sharing arrangements with RTOs, oil marketing companies, and fleet operators.

Key highlights

  • Erode’s on-road transport emits about 0.61 MtCO₂e annually (2025) and could double by 2045 without intervention.
  • High-emitting segments have a disproportionate impact. Diesel trucks make up just 1.4% of the fleet but contribute 21% of emissions, driven by diesel dependence, an older fleet (average age ~9 years), low mileage and long daily distances.
  • Two- and four-wheelers dominate the fleet, accounting for about 95% of vehicles and 68% of emissions. Together, they consume roughly 167 million litres of petrol and 126 million litres of diesel annually.
  • Urban sprawl and longer trips are key drivers of emissions. A 1% increase in vehicle-registration growth raises fuel demand by about 0.45% (~3,060 tCO₂e/year), while a 1% increase in VKT growth raises it by about 0.9% (~6,500 tCO₂e/year).
  • Improving fuel economy by 20–30% could reduce emissions by 17–23% by 2030, supported by stronger vehicle inspection, maintenance and in-use emissions compliance.
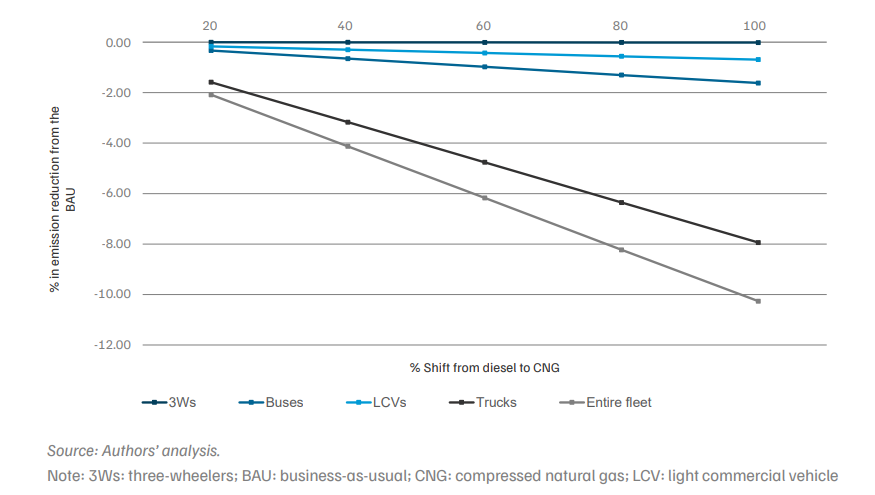
  • CNG can help, but only as a transition fuel. A complete shift from diesel to CNG could reduce emissions by up to 10% by 2030, with most reductions coming from trucks (~8%). Benefits for three-wheelers and LCVs are limited to under 1%, as methane-related CO₂e emissions offset efficiency gains.
  • Electrification offers the largest opportunity. High-volume segments like 2Ws can deliver major aggregate reductions (17 per cent. High-intensity segments, meanwhile, offer larger emissions reductions per vehicle.

HAVE A QUERY?

author image
Programme Associate
“You cannot manage what you cannot measure. For Erode, this work turns transport emissions data into a practical planning tool—enabling the city to track progress, compare interventions, and make informed choices for a lower-carbon future.”

Executive summary

In India, transport sector contribute ~14 per cent of national greenhouse gas (GHG) emissions (MoEFCC 2024). Although India's annual per capita emissions remain below the global average (2.4 tonnes of CO2 equivalent [tCO2e] per capita compared with 6.3 tCO2e per capita globally) (Shinde et al. 2023), tier-2 and tier-3 cities are experiencing growth in population, vehicle ownership, and economic activity, leading to an increase in transport emissions (Ramachandra et al. 2015). Strengthening city-level GHG accounting is therefore essential to enable India to achieve the goals outlined in the nationally determined contributions (NDCs) (GoI 2022). Without such granular data, designing targeted mitigation strategies and tracking progress remains challenging.

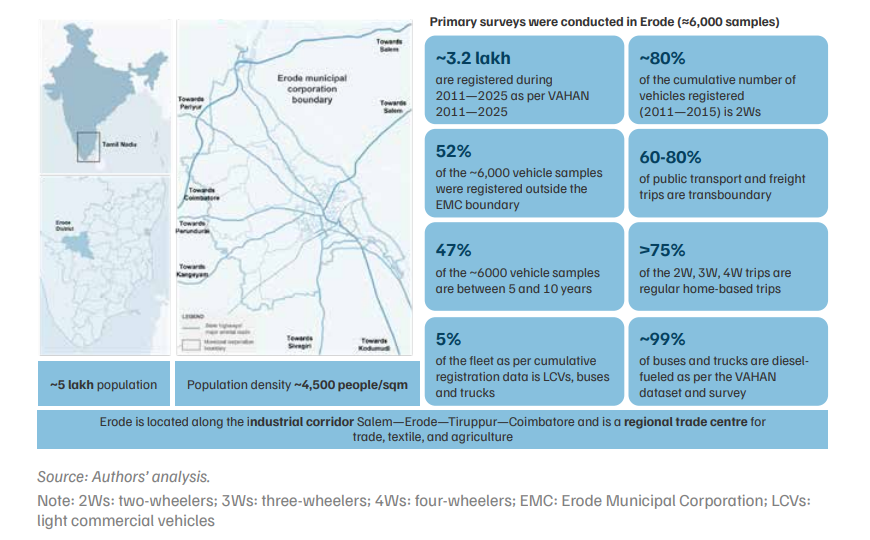
This study develops a Global Protocol for Community-Scale (GPC)-compliant Greenhouse Gas Emission Inventories (GHG) accounting framework for on-road transport emissions in Erode Municipal Corporation (EMC), Tamil Nadu. Although Tamil Nadu has adopted progressive climate action plans across sectors, including road transport, cities continue to face systemic gaps in data, infrastructure, and institutional capacity limiting the integration of emissions data into transport planning. Undertaken under the India–UK Partnering for Accelerated Climate Transitions (UK PACT) programme, Erode is one of the cities selected under the partnership, as it is one of the major regional trade centres for textiles and agriculture. The study aims to establish a transferable methodological model tailored to the data realities and institutional capacities of tier-2 and tier-3 Indian cities. The framework is designed to be scalable and transparent, enabling consistent reporting and policy alignment across comparable urban contexts. It accommodates varying levels of data availability, governance capacity, and transport system characteristics.

Figure ES1. Erode Municipal Corporation is a rapidly growing tier-2 city with increasing mobility demand
Methodology and tool development

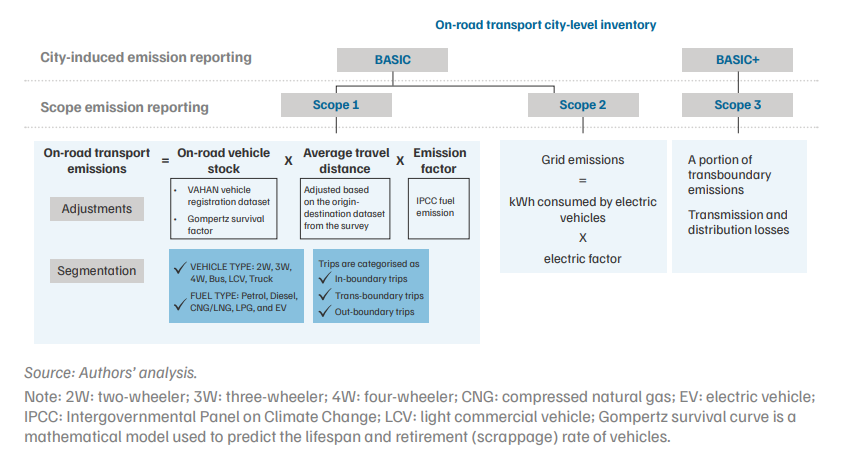
The study adopts a GPC-compliant, city-scale emissions-accounting framework at the BASIC+ reporting level, using a bottom-up, modified production-based methodology (Activity–Share– Intensity–Emission Factor). The analytical framework quantifies Scope 1 (tailpipe emissions), Scope 2 (emissions associated with grid electricity consumption associated with electric vehicles [EVs]), and selected Scope 3 emissions, such as trans-boundary trips and transmission and distribution (T&D) losses linked to electricity use.

Figure ES2. Framework for GPC-compliant on-road emissions inventory
To operationalise the framework, we developed an Excel-based GHG calculator for EMC. The tool is designed to support periodic inventory updates, features transparent documentation of assumptions, and enables scenario modelling within consistent methodological boundaries. It can simulate business-as-usual (BAU) scenarios and multiple alternative scenarios (activity-driven and energy-efficiency-driven) for the period 2030–45.

Key findings

  • On-road transport emissions could nearly double by 2045 under a high-growth scenario.
    Erode generates ~0.61 million tonnes of CO2 equivalent (MtCO₂e) annually from on-road transport, of which Scope 1 (tailpipe) emissions account for ~86 per cent of total emissions, highlighting their significant contribution. By 2030, emissions are projected to range from ~0.66 MtCO₂e (low-development case) to ~0.79 MtCO₂e (high-development case). Under a high-growth scenario, which combines increased vehicle registrations and vehicle kilometres travelled (VKT), emissions could reach ~1.42 MtCO₂e by 2045, nearly double the 2025 baseline (Figure ES3). Therefore, early intervention is more cost-effective than attempting to reduce emissions after the vehicle fleet and travel demand have expanded.

Figure ES3. Without intervention, on-road transport emissions could nearly double by 2045, reaching ~ 1.42 MtCO2 e under high growth conditions, compared to the BAU scenario
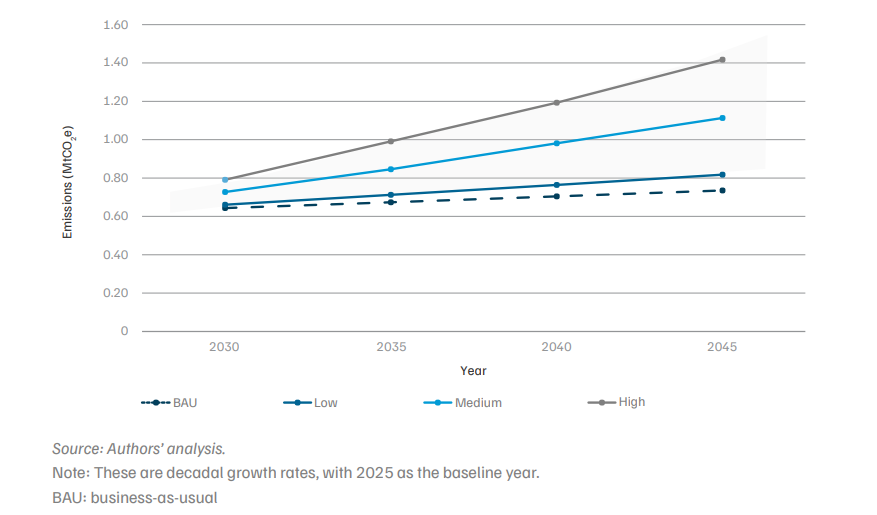
Rate of development Vehicle registration growth rate (%) Increase in VKT (%)
Low 10 5
Medium 30 7
High 50 9

*Development means an increase in vehicle registration and an increase in average VKT.

Source: Authors' analysis.

Note: VKT: vehicle kilometres travelled

  • Heavy-duty diesel vehicles contribute disproportionately to emissions.
    Diesel trucks constitute only 1.4 per cent of the fleet but account for ~ 21 per cent of total emissions. Similarly, buses account for less than 0.3 per cent of the fleet, yet contribute ~ 7 per cent of emissions. This is because per-vehicle emissions are high, and because of diesel dependence, an older vehicle fleet (average age of ~ 9 years for trucks and ~ 7 years for buses), low mileage, and longer average daily travel distances. Buses have the highest annual pervehicle emissions intensity, followed by trucks (36.6 tCO2 e per bus and 20.7 tCO2 e per truck). This underscores the need to prioritise heavy-duty diesel vehicles in city-level emissionreduction strategies to maximise the impact of transport-sector interventions.

Figure ES4. Growth in vehicle kilometres travelled leads to a greater increase in fuel demand and carbon dioxide (CO2 ) emissions than growth in vehicle registration
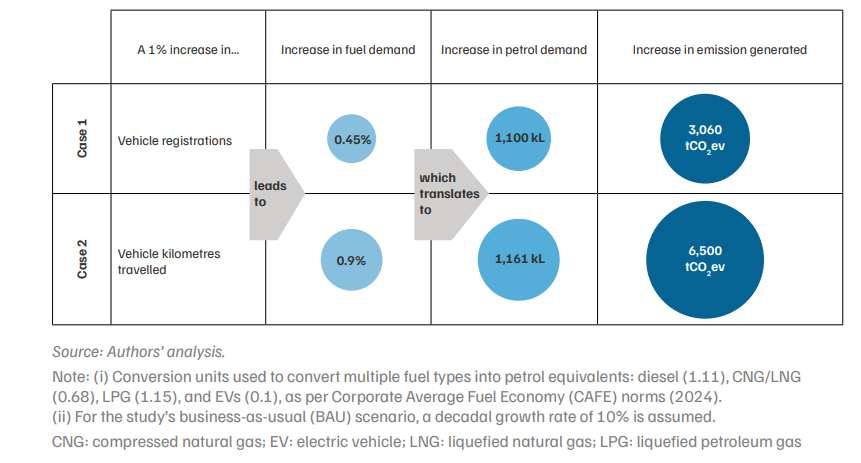
  • Emissions are significantly more sensitive to increases in VKT than to growth in vehicle registration.
    To ensure comparability, both parameters were normalised, where the decadal growth rates of vehicle registrations and VKT were independently varied by a per cent change from their respective baseline growth trajectories (Figure ES4). The analysis shows that an increase in travel demand has nearly twice the impact on fuel consumption and consequently emissions, as an equivalent increase in vehicle registration growth.
    • A 1 per cent increase in decadal vehicle registration growth rate results in a ~ 0.45 per cent increase in fuel demand, equivalent to ~ 3,060 tCO₂e annually.
    • A 1 per cent increase in the VKT growth rate results in a ~0.9 per cent increase in fuel demand, equivalent to ~6,500 tCO₂e annually.
  • Improving fleet fuel economy offers substantial emission reduction potential.
    Improving fleet fuel economy by 20–30 per cent could reduce emissions by 17–23 per cent relative to the BAU scenario by 2030, lowering emissions to ~0.64 MtCO₂e. This can be supported through strengthened vehicle inspection, maintenance programmes and enforcement of in-use emissions compliance.
  • Diesel-to-CNG transition delivers limited fleet-wide emissions reductions.
    A full transition from diesel to compressed natural gas (CNG) yields a maximum emission reduction of ~10 per cent by 2030, primarily driven by trucks (Figure ES5). The CNG transition in three-wheelers (3Ws) and light commercial vehicles (LCVs) is likely to have a marginal impact (less than 1 per cent) due to methane-related CO₂e factors and limited net fuelefficiency gains.

Figure ES5. In the full transition scenario, emission reductions are driven primarily by trucks, while transitions to CNG in 3Ws and LCV show negligible impact
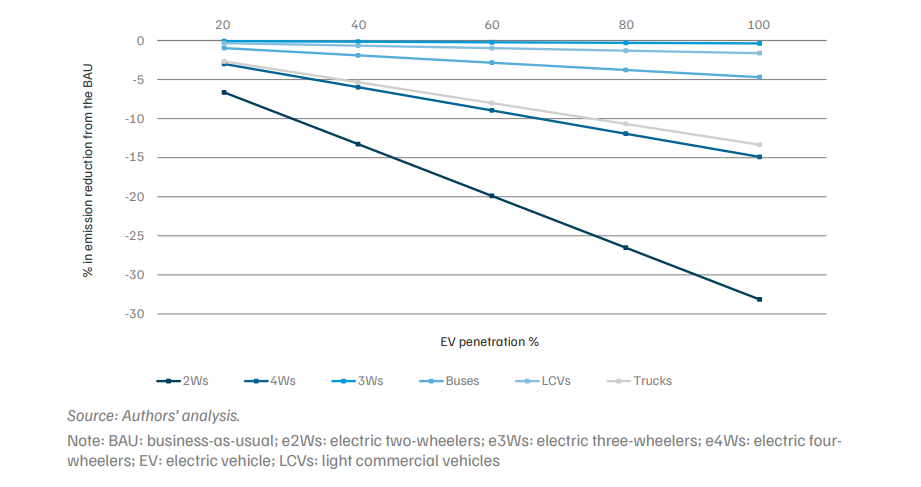
  • The benefits of electrification can be achieved through volume-driven reductions in twowheeler (2W) and four-wheeler (4W) vehicles, and intensity-driven emission reductions from heavy-duty freight vehicles.
    • High-volume segments (2Ws and 4Ws) generate substantial aggregate emission reductions. Electrifying 50 per cent of 2Ws alone could reduce total emissions by ~17 per cent (Refer to figure ES6).
    • High-intensity segments (trucks and buses) provide larger annual per-vehicle reductions due to elevated baseline emissions (36.6 tCO₂e per bus; 20.7 tCO₂e per truck) (Refer to figure ES6).
    • Electrifying 30 per cent of the total fleet by 2030 could reduce emissions by ~20 per cent relative to the BAU scenario (~0.64 MtCO₂e). It would also shift the emissions composition from Scope 1 dominance (85 per cent to 74 per cent) towards a greater contribution from Scope 2 (0.3 per cent to 12 per cent), reinforcing the importance of grid decarbonisation.

Figure ES6. e2Ws and e4Ws deliver the highest aggregate emission reductions due to the overall higher fleet share
Policy recommendation and priorities

  • Manage transport demand and align planning with emissions outcomes. (High impact | Medium–long term)
    • Estimate the annual transport-sector GHG baseline to model the emissions impacts of policy scenarios, such as accelerated fleet electrification and diesel vehicle scrappage. While the impacts of these measures are primarily modelled at the state and national levels, translating them into measurable city-level targets is essential. City-level GHG assessment can support context-specific planning, prioritisation, and monitoring.
    • Integrate the GHG calculator into comprehensive mobility plans (CMPs) and master plans, where interventions propose altering VKT or modal share, the calculator can be used to assess fleet-level emission impacts.
    • Introduce location- and time-based differential parking pricing in the central business district and high-congestion corridors. Pricing may be scaled according to vehicle size and engine type to limit the use of private and freight vehicles during peak hours and in congested areas.

Concerned stakeholders: EMC, Directorate of Town and Country Planning (DTCP), Department of Transport (Government of Tamil Nadu)

  • Target high-intensity diesel freight and bus segments. (High impact | Medium term)
    • Identify diesel trucks and private buses that are over 10 years old and introduce scrappage-linked incentives (e.g., permit prioritisation, fee waivers, or access benefits) for private operators and drivers, given their high emissions intensity per vehicle.
    • Designate green freight access zones within the city core, with restricted entry for older diesel vehicles and preferential loading and unloading bays for compliant fleet operators.
    • Initiate a corridor-level study of the Salem–Erode–Tiruppur–Coimbatore freight route to assess the feasibility and impacts of long-haul trucks transitioning to cleaner fuels.
    • Mandate the procurement of e-buses for government fleets.

Concerned stakeholders: state transport department, regional transport offices (RTOs), Tamil Nadu State Transport Corporation (TNSTC), EMC, district collectors

  • Accelerate electrification across high-volume and public fleet segments. (High impact | Medium–long term)
    • Erode Municipal Corporation can conduct awareness campaigns on EV purchase incentives under the Tamil Nadu Electric Vehicles Policy, 2023, and the PM Electric Drive Revolution in Innovative Vehicle Enhancement (PM E-DRIVE) scheme, including purchase subsidies, registration fee waivers, and road tax exemptions.
    • The TNSTC should plan for depot charging infrastructure through the public–private partnership (PPP) model, drawing on lessons and guidance from Chennai and Coimbatore.

Concerned stakeholders: TNSTC, Tamil Nadu Generation and Distribution Corporation Limited (TANGEDCO), state transport department

  • Strengthen in-use emissions compliance and fleet transition. (Low impact | Medium term)
    • Conduct emission checks at city-level cordon points (entry and exit points) and along high-traffic corridors to identify non-compliant vehicles. Implement phased restrictions on pre-Bharat Stage-VI vehicles in high-emission zones.
    • Strengthen enforcement of annual Pollution Under Control (PUC) certification requirements for freight vehicles more than 10 years old by linking permit renewal at the RTO level.
    • Address gaps in PUC testing verification and quality and support the gradual retirement of highly polluting vehicles from the active fleet.
    • Pilot CNG/liquefied natural gas (LNG) retrofit programmes for heavy-duty truck fleets where technically feasible.

Concerned stakeholders: traffic police, state transport department

  • Institutionalise data and governance structures. (Low-hanging | Short term)
    • Notify the EMC as the custodian of the annual GHG inventory, with defined responsibilities for sourcing, updating, and publishing data on fleet composition from VAHAN, fuel sales, and travel characteristics from periodic surveys to ensure fixed annual updates rather than ad hoc reporting.
    • Establish standardised data-collection protocols and reporting formats, along with mechanism for regular data transmission to the state government, to support state-level planning and reporting.
    • Establish data-sharing memoranda of understanding (MoUs) with RTOs, oil marketing companies (OMCs), and fleet operators to facilitate the regular provision of anonymised vehicle activity and fuel sales data at the city level.
    • Operationalise existing Integrated command and control centre (ICCC) infrastructure to generate periodic monitoring data on the vehicle mix, fleet age distribution, and traffic volumes at key junctions and freight corridors to generate annual GHG inventory updates and help identify areas for demand-management interventions.
    • Create a city-level transport decarbonisation task force, co-chaired by the EMC and the state transport department, with representation from TNSTC, TANGEDCO, and RTOs, to review annual inventory results and align actions with Tamil Nadu's net-zero commitments.

Concerned stakeholders: EMC, TANGEDCO, TNSTC, state transport department
Note: Short term: 1–2 years; medium-term: 3–5 years; long term: >5 years

FAQs

Frequently Asked Questions

  • What does a ‘GPC-compliant’ inventory mean, and why does it matter for a city?

    The Global Protocol for Community-Scale Greenhouse Gas Emission Inventories (GPC) is the global standard for city-scale emissions reporting, recognised at COP21 in Paris. It requires cities to report emissions across defined scopes—direct emissions within the boundary, emissions from imported energy, and selected out-of-boundary emissions- so inventories are consistent, transparent, and comparable across cities. Frameworks such as the IPCC guidelines, the IEA and EDGAR datasets classify transport emissions at the national or regional level and cannot capture intra-city travel patterns or local vehicle profiles. This study reports at the GPC BASIC+ level.

  • What data does the inventory rest on?

    Two datasets. The VAHAN registration database provides vehicle category, type, registration year and fuel type — about 3.2 lakh vehicles registered within the EMC boundary (RTOs TN33 and TN86) between 2011 and 2025. Because VAHAN does not record vehicle use, the study also ran a Fuel Station User Survey of about 6,000 vehicles across Erode in September 2025, capturing vehicle age, mileage, trip origins and destinations, trip type, and distance. A minimum of 300 samples were collected for each vehicle category, with the overall distribution matched to observed VAHAN registration shares.

  • Can other cities use this framework?

    Yes. The framework was built around the data realities and institutional capacities typical of Indian tier-2 and tier-3 cities, and accommodates varying levels of data availability, governance capacity and transport system characteristics. It is designed to be scalable and transparent so that reporting stays consistent and policy-comparable across similar urban contexts.

  • What can Erode Municipal Corporation or other corporations do with the calculator?

    The Excel-based calculator is built for institutional use rather than one-off analysis. It documents its assumptions transparently, supports annual inventory updates, and models business-as-usual and alternative scenarios for 2030, 2035, 2040 and 2045. The study recommends notifying EMC as custodian of the annual inventory, integrating the calculator into comprehensive mobility plans and master plans so that any proposal affecting VKT or modal share can be tested for its emissions impact, and drawing on the Integrated Command and Control Centre built under the Smart Cities Mission as a data hub.
  •  

HAVE A QUERY?

author image
Programme Associate

Sign up for the latest on our pioneering research

Explore Related Publications