Council on Energy, Environment and Water Integrated | International | Independent
Kar, Abhishek, Sunil Mani, Adya Sharma, Surya Shekhar Auddy, Shruti Sharma, Paras Bhattarai, Rahul Das. 2024. Improving India’s Clean Cooking Fuel Supply: Recommendations to Enhance Last-mile LPG Accessibility. New Delhi: Council on Energy, Environment and Water.
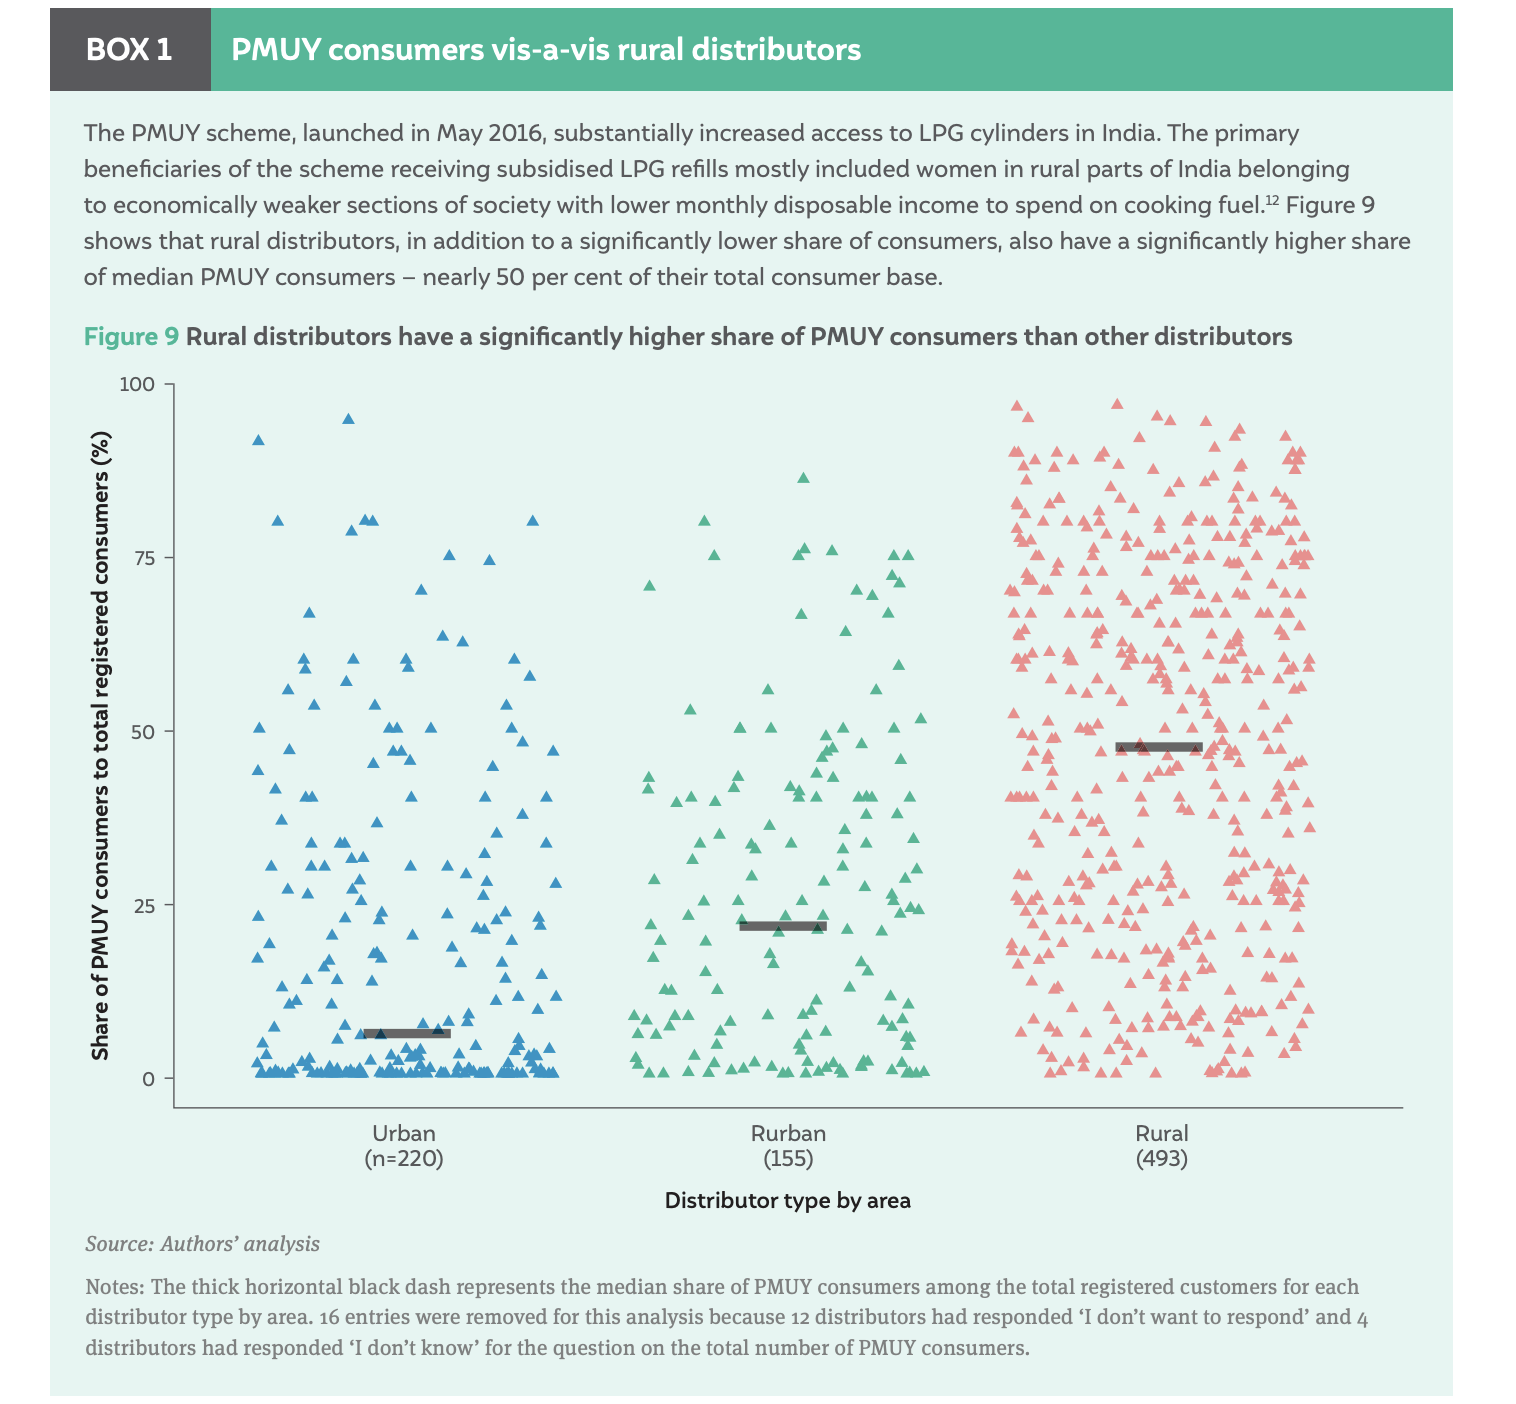
Ensuring access to clean cooking energy is a cornerstone of India's development and health agendas, particularly in rural areas where cooking with traditional biomass fuels is still prevalent. The Pradhan Mantri Ujjwala Yojana (PMUY) has been instrumental in expanding subsidised LPG connections to 103 million women from low-income households, providing an opportunity to transition away from polluting fuels. To realise the government’s vision of universal clean cooking, ensuring timely and convenient delivery of LPG refills to encourage sustained use of clean cooking fuel is imperative. In rural and remote regions, the challenge of maintaining a reliable supply chain for LPG distribution is significant. Logistical challenges, high delivery costs, and a low and spare consumer base continue to hamper the viability of the LPG distributors.
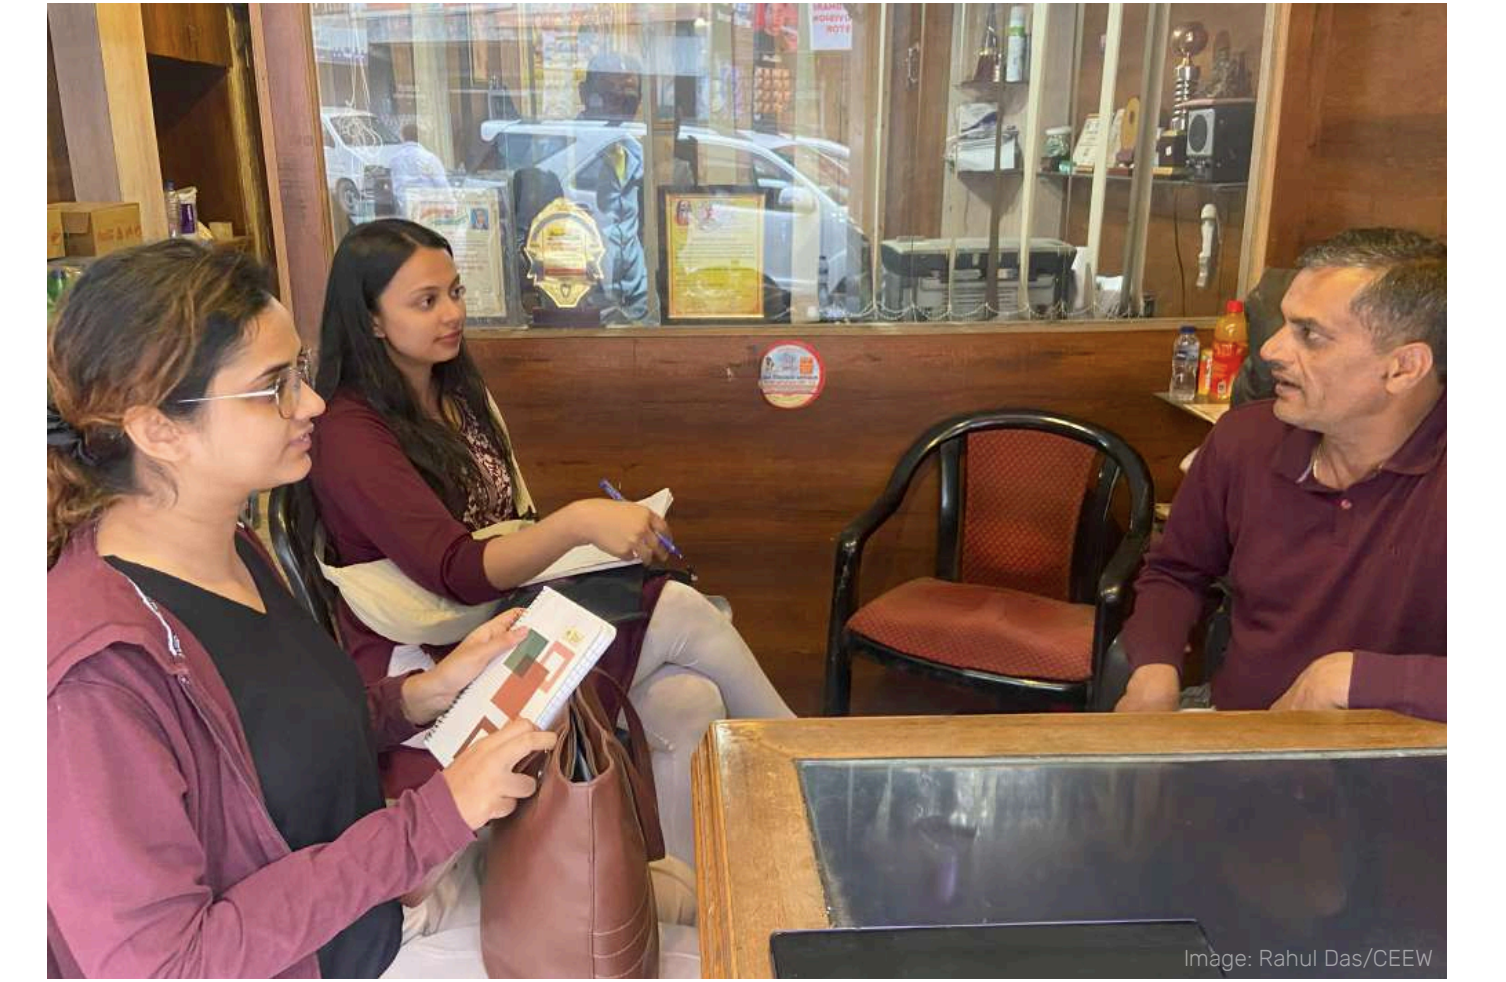
To gain a deeper understanding of these challenges, an extensive telephonic survey was conducted from October 2022 to March 2023 with904 LPG distributors across the three Oil Marketing Companies (OMCs)- Indian Oil Co. Ltd, Bharat Petroleum Co. Ltd, and Hindustan Petroleum Co. Ltd, in six Indian states - Assam, Maharashtra, Jharkhand, Telangana, Uttarakhand, and Uttar Pradesh. The first-ever supply-side perspective of the LPG distribution system in India at scale, this survey provides valuable insights into the operational challenges reported by distributors, who serve as a critical link between the government’s flagship clean cooking initiative and Indian households. These findings shed light on the disparity between distributors, both within and across distribution areas (urban, rurban, rural, and durgam), the factors that distinguish disadvantaged distributors from viable distributors, and provide targeted recommendations that can help overcome these challenges and strengthen India’s clean cooking infrastructure.
The use of solid fuels like firewood and cattle dung cake for cooking leads to household air pollution (HAP). HAP is a significant contributor to India’s overall disease burden, accounting for nearly 800,000 deaths annually, particularly among women and children (Chowdhury et al. 2019). Consequently, progress towards achieving multiple United Nations Sustainable Development Goals (SDGs) has been delayed (Rosenthal et al. 2018; Gill-Wiehl et al. 2023). India has made significant advancements over the past two decades in replacing solid fuels for cooking such as firewood, dung cakes, coal, and agricultural residue with clean fuels such as liquefied petroleum gas (LPG). LPG has been the primary focus for substituting solid fuels, especially since the introduction of the Pradhan Mantri Ujjwala Yojana (PMUY) scheme in May 2016. Under the programme, the government has provided subsidised LPG connections to ~103 million poor women (households) between May 2016 and July 2024 (PPAC, 2024). LPG’s inherent scalability potential, coupled with the government’s proactive policies and targeted programmes, has fuelled India’s remarkable transition towards a cleaner energy mix.
While the rapid expansion in LPG access is commendable, the sustained use of LPG has been a challenge to consumers due to high initial costs, delivery challenges, fuel stacking, cultural preferences, etc. Previous studies have estimated that 41 per cent of Indian households still rely primarily on solid fuels for cooking (Ministry of Health and Family Welfare 2021). Among several barriers hindering the sustained transition from solid fuels to LPG, two factors, namely, affordability and easy availability of cheap or non-monetised solid fuels, have been widely discussed in the existing literature.
However, very few studies have investigated in detail the challenges related to LPG access from a supply side, particularly in rural India. A recent study by CEEW found that 64 per cent of Indian households reported receiving home delivery of their refills. The study also found that improving home delivery may increase LPG use (Mani et al. 2021).
This study investigates challenges at the last mile of India’s LPG supply chain focused on home delivery of LPG and those responsible for the same – LPG distributors. There are over 25,000 distributors (private entrepreneurs) across India that provide sales and service to over 326 million LPG consumers (households) in India (Petroleum Planning and Analysis Cell, 2024). Notably, in India, LPG is a controlled product sold by three public sector oil marketing companies (OMCs), namely, Indian Oil Corporation Limited (IOCL), Bharat Petroleum Corporation Limited (BPCL), and Hindustan Petroleum Corporation Limited (HPCL) under the oversight of the Ministry of Petroleum and Natural Gas (MoPNG), Government of India. This survey has been conducted as part of the Cleaner Air and Better Health project (supported by USAID), which is a five-year initiative that aims to establish evidence-based models for improved air quality management in India.
The primary survey was conducted telephonically with a sample of 904 LPG distributors across six states of India (Figure ES1). The LPG distributorships (mostly male-dominated businesses) are classified into four categories based on the geographical mix of their consumers. The geographic category of distributors as per MoPNG are:
Figure ES1 State-wise coverage of the first-ever nationwide survey with LPG distributors of India
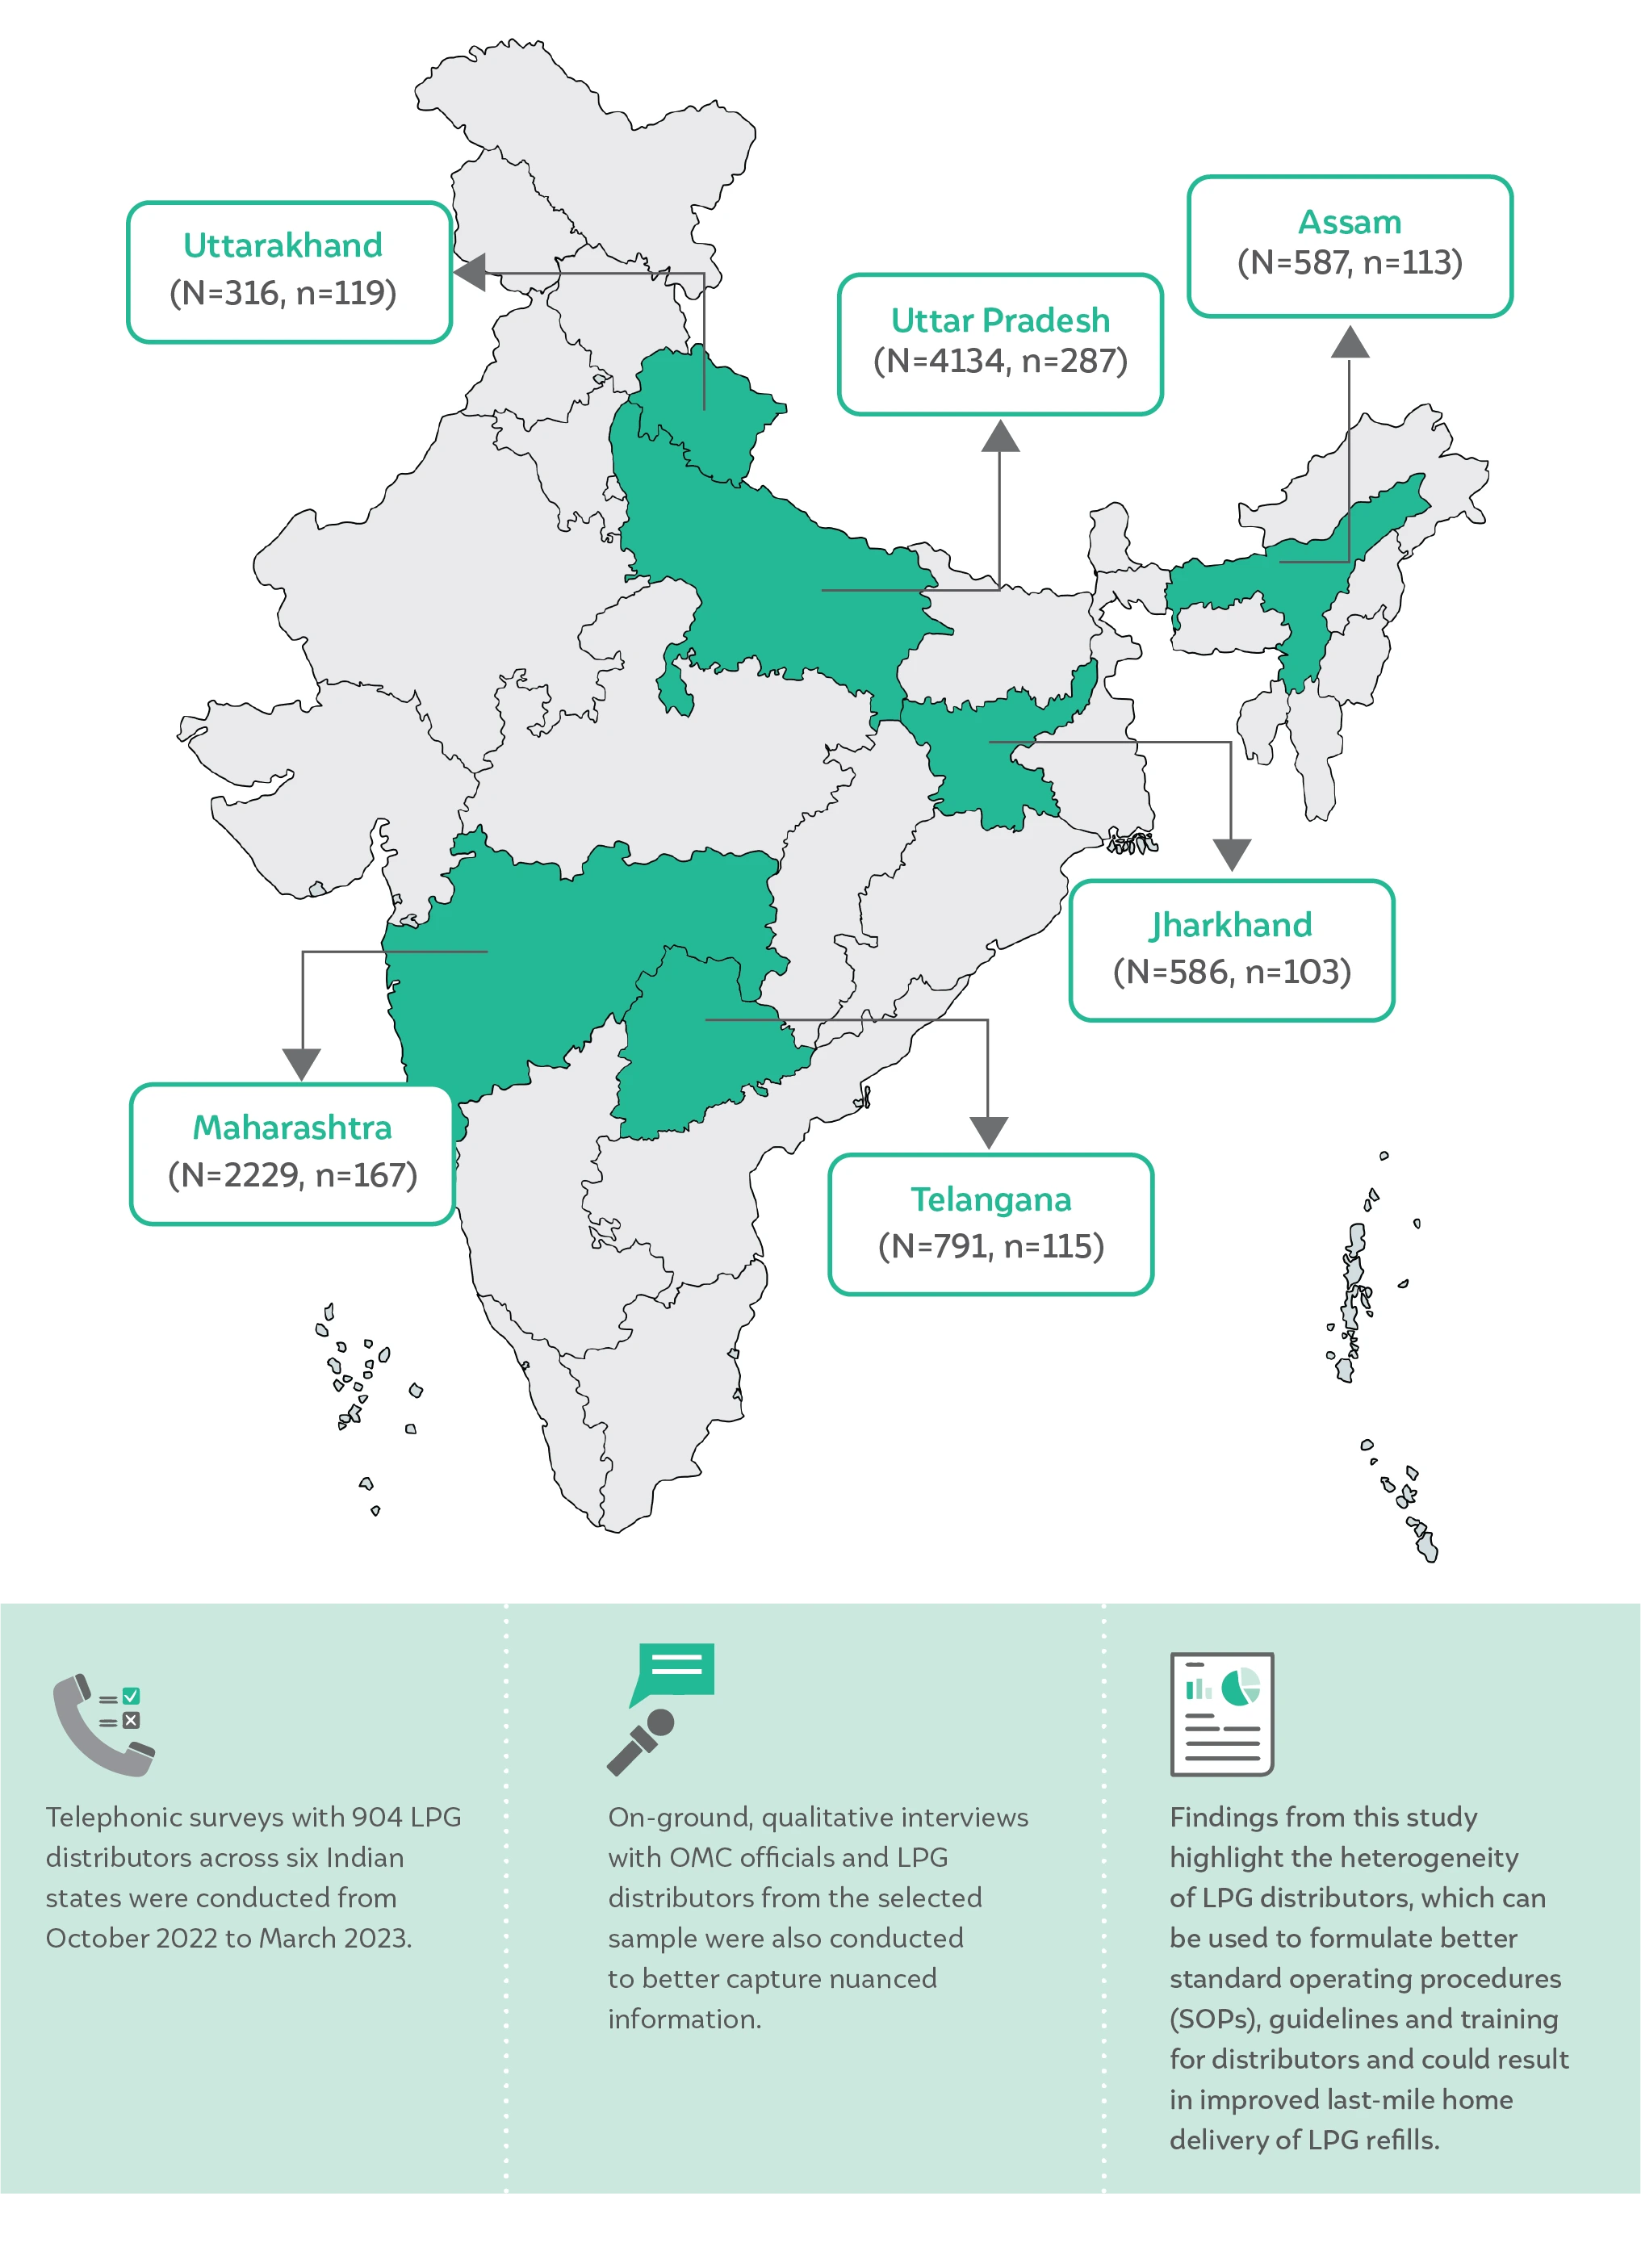
Source: Authors’ compilation
Note: N refers to population size; n refers to sample size.
According to the 2016 Unified Guidelines issued by OMCs, all distributors must provide home delivery except Durgam Kshetriya distributors. The other three types of distributors are mandated home delivery with a uniform fixed commission on a per-cylinder basis. At the time of survey administration (Oct 2022 - March 2023), the total fixed commission was INR 64.84 per [14.2 kg] cylinder for distributors including a home delivery charge of INR 29.26.
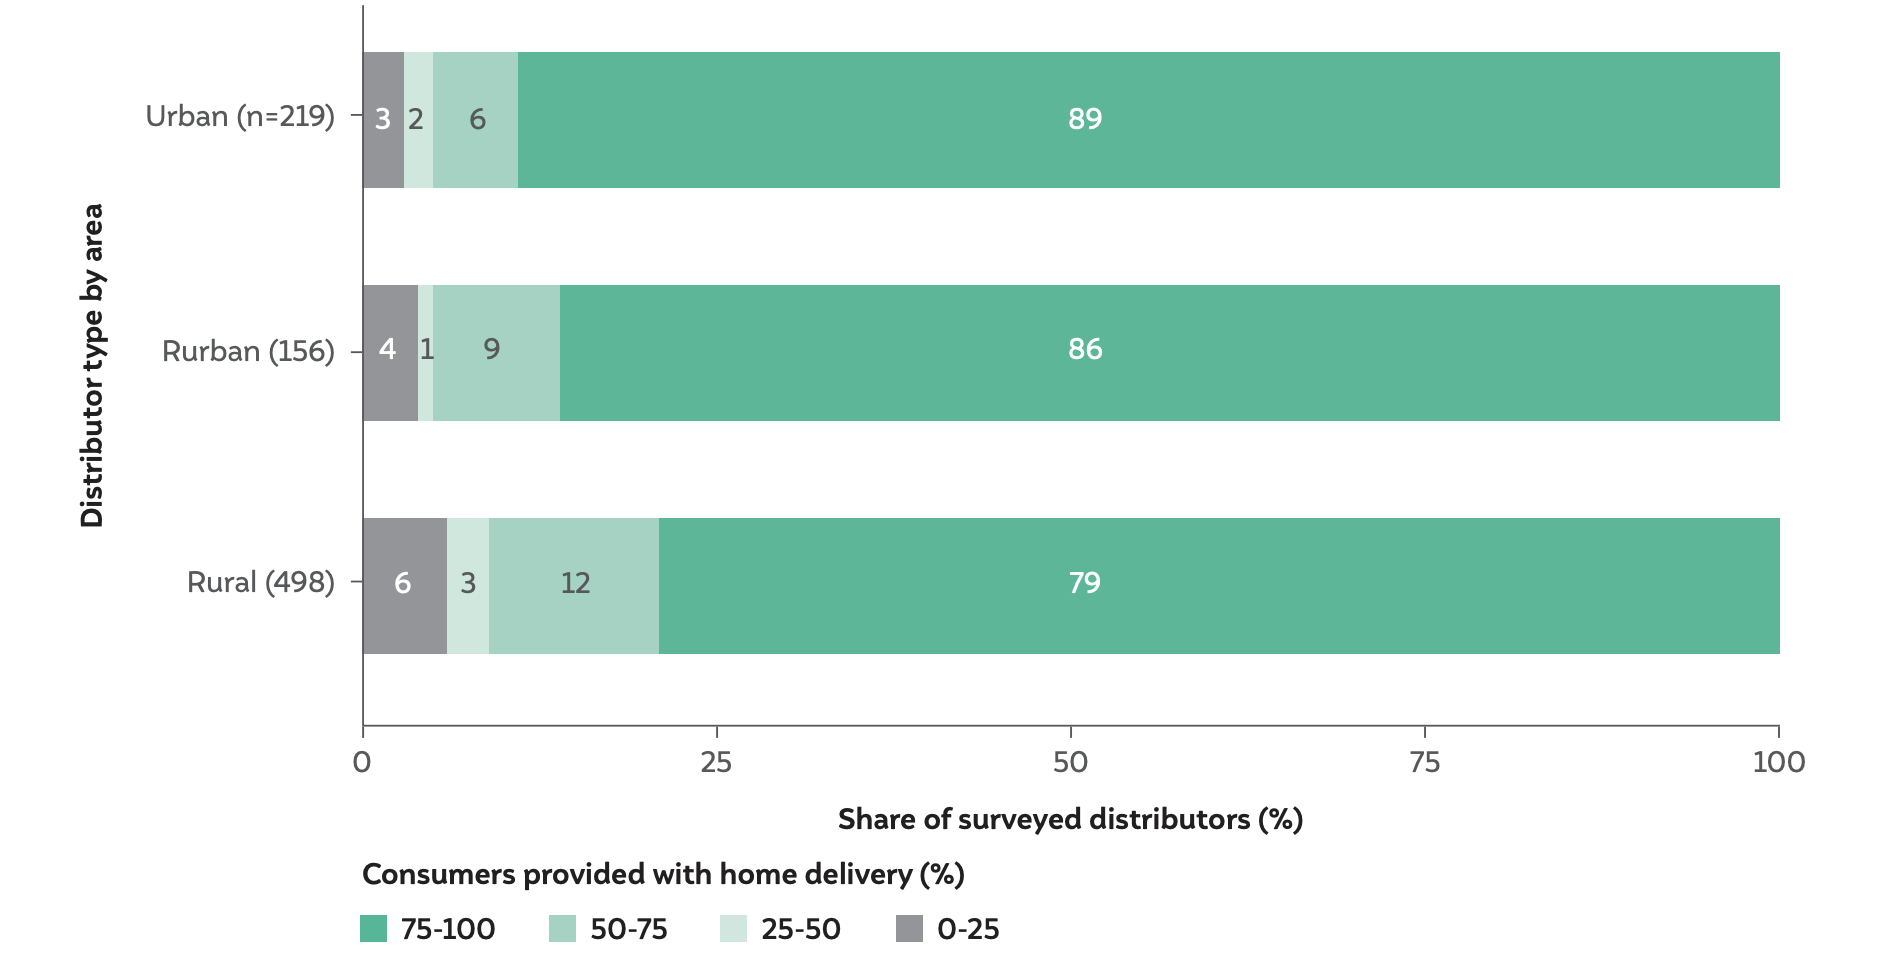
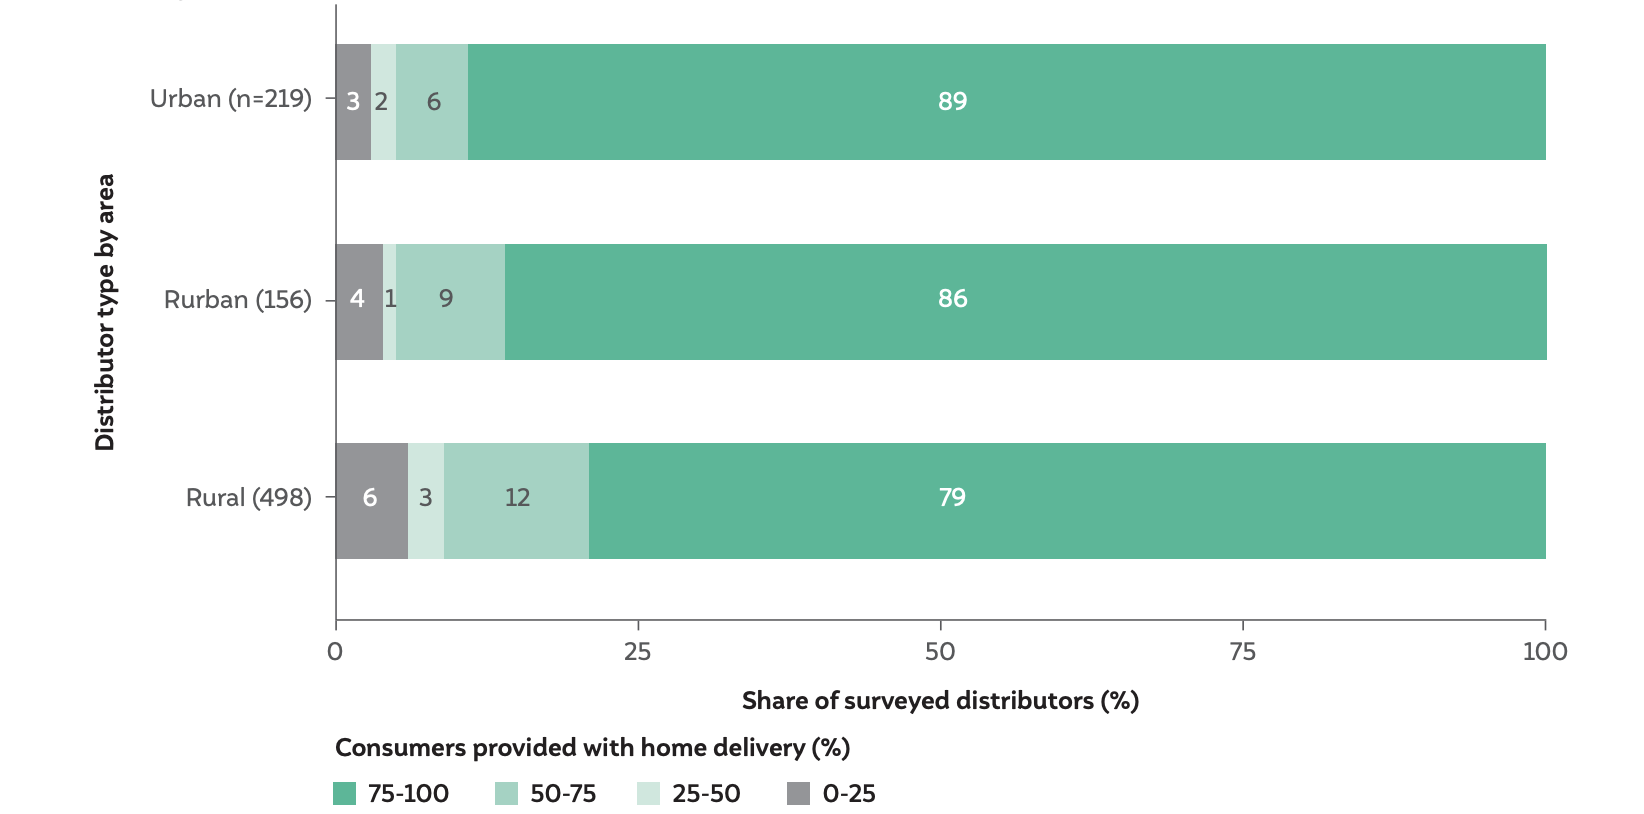
Self-reports from distributors indicate that, on average, a home delivery service was offered to ~87 per cent of their consumers in 2023 (Figure ES2). This is an improvement compared to 2019, where responses from consumers indicated that 64 per cent of Indian households are receiving home delivery of their refills (Mani et al. 2021). In urban areas, 72 per cent of sampled urban distributors reported providing home delivery to over 90 per cent of their consumers, while out of the sampled rural distributors, only 52 per cent reported the same. Notably, while twenty Durgam Kshetriya distributors were surveyed, they were not included in the detailed analyses for this study; these distributors account for only 8 per cent of distributors in India and are exempt from providing home delivery.
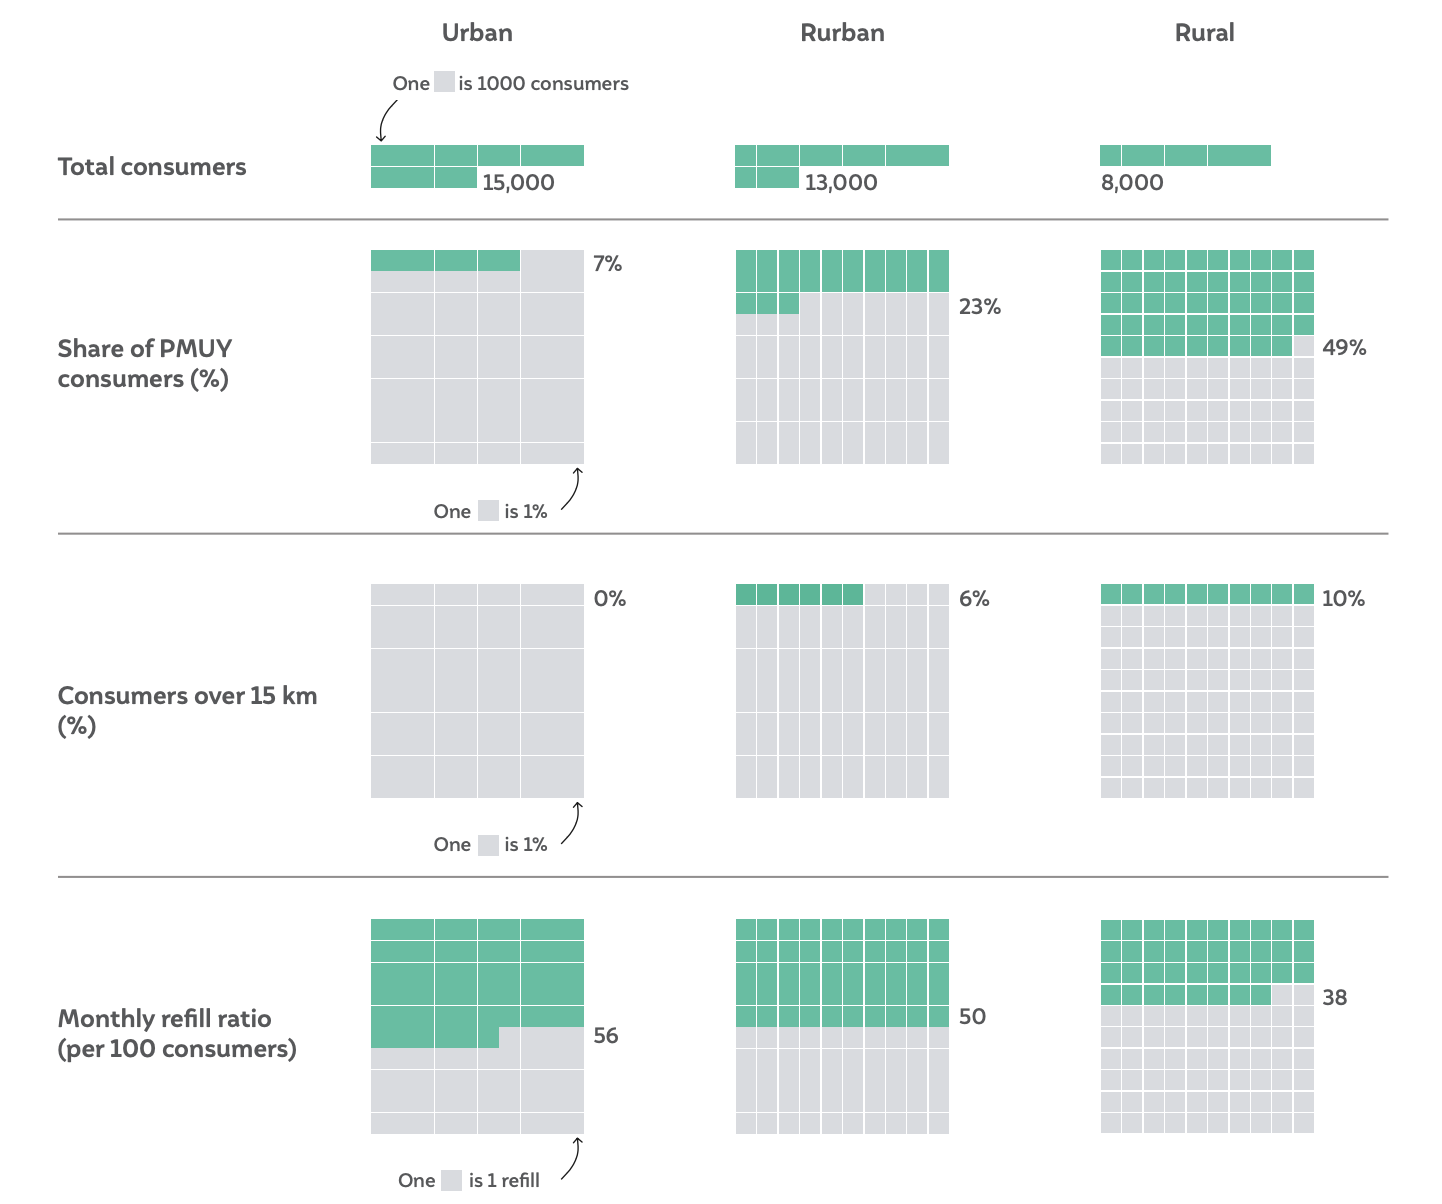
Based on self-reports from distributors, it was found that, compared to urban distributors rural distributors have a lower consumer base, lower average sales per 100 consumers, a higher proportion of PMUY consumers, and a larger share of consumers located beyond 15 km. These factors may explain the differences in their home delivery levels compared to urban distributors (Figure ES2). It was also found that the expenditure per refill sale increased for distributors as the share of consumers located beyond 15 km increased. This is likely due to higher fuel costs of travelling longer distances and lower number of deliveries per hour due to the spread and low density of consumers.
Figure ES2 Consumers catered to by urban distributors have the highest access to home delivery
Source: Authors’ analysis
Note: 10 entries were removed for this analysis because 10 responses for the share of consumers receiving home delivery were missing. Median values for the share of consumers provided with home delivery are 100 per cent for urban distributors and 95 per cent for rurban and rural distributors, whereas average values for the share of consumers provided with home delivery are 95 per cent for urban distributors, 88 per cent for rurban, and 84 for rural distributors.
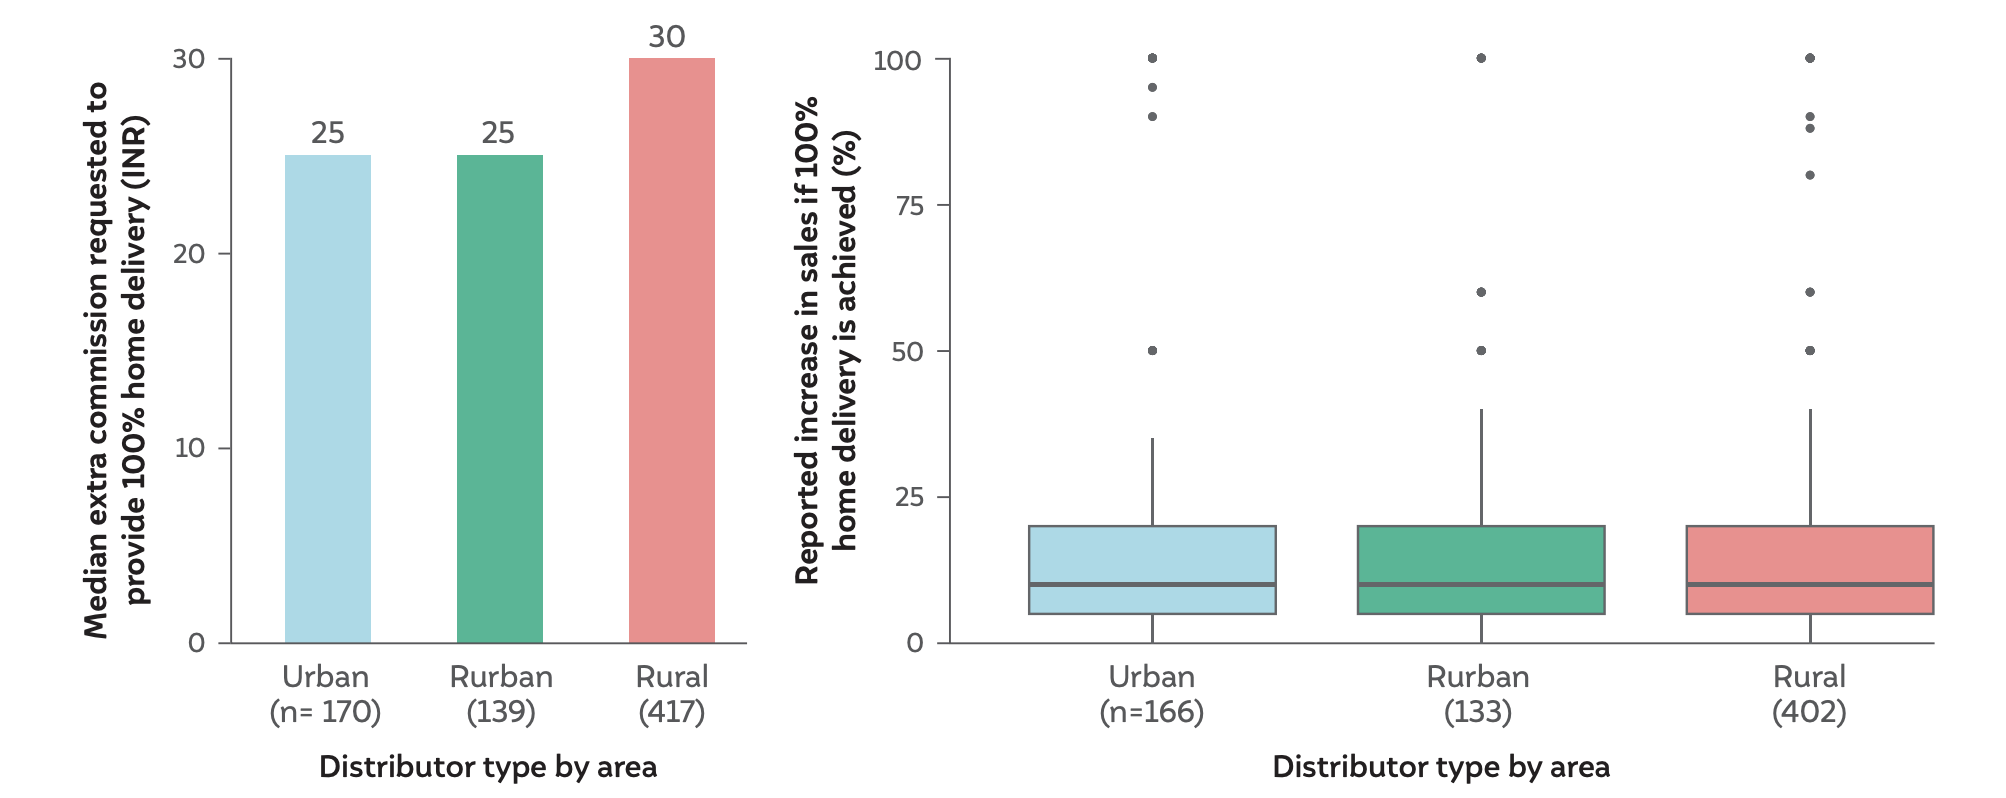
This could be one of the reasons why rural distributors are likely to have lower home delivery rates (as highlighted in Figure ES2). Distributors also requested a (median) increase of INR 25 (in the case of urban distributors) and an increase of INR 30 (in the case of rural distributors) from the prevailing commission rate of INR 64.84 (at the time of survey administration) to achieve 100 per cent home delivery. Notably, since survey administration, distributor commissions were revised to INR 73.081 (which includes a home delivery charge of INR 33.43) by MoPNG, which is an encouraging step in the right direction.
Figure ES3 Distributor factsheet: Statistics for a typical (median) distributor in the sample of 904 LPG distributors
Source: Authors’ analysis
It was found that some distributors across all categories self-report monthly sales below the feasibility limit as defined by MoPNG in the Unified Guidelines. 36 per cent of urban distributors and 43 per cent of rural distributors self-report refill sales per month below the minimum viable amount of 6,000 and 2,500 respectively. It is indicative of a need for a distributor support system that reflects the viability gap irrespective of their geographic location (rural or urban). Notably, as the sales figures are self-reports, hence there is a risk of bias in responses.
As evident in Figure ES3, LPG distributors are not a homogenous set of business entities though they are paid a uniform distributor commission. Hence, it may be necessary to customise policies and commissions to cater to the varied needs of different distributors (similar to how an exemption for home delivery is provided for durgam distributors).
During this study, several rounds of interactions were conducted with distributors, distributor federations, OMC officials, and MoPNG officials. Based on the survey findings and these engagements, preliminary solutions have emerged, which should be rigorously evaluated and field-tested before being formally adopted across India.
Need for a differentiated distributors’ commission model for 100 per cent home delivery
To address the significant variations in home delivery rates across distributor types, a differentiated commission model or performance-based incentives are proposed in contrast to the current uniform incentive structure (Prayas Energy Group 2020). This study has highlighted the difference in total consumer base (lower overall sales potential), the share of PMUY consumers (poor consumers are less likely to purchase frequently), average sales per 100 consumers (reflecting current business conditions) among distributor groups, and within distributor groups. Given the systemic disparity, such disadvantaged distributors - with a lower consumer base, a higher share of PMUY consumers, and lower average sales per consumer - need to be identified.
A distributor with 5,000 registered active consumers and 90 per cent PMUY beneficiaries should not be treated the same (uniform commission) as a distributor with 15,000 consumers and 10 per cent PMUY beneficiaries. Hence, there should be three categories of distributors based on their level of systemic disadvantage: normal, disadvantaged, and severely disadvantaged, and additional support should be designed accordingly. Based on this study, while a higher percentage of rural distributors are disadvantaged compared to urban distributors, a differentiated distributor commission system should be customer-category agnostic and solely focus on the disparity parameters.
Technological and supply chain innovations to complement the existing distribution model.
Given the systemic disparities, exploring innovative solutions towards 100 per cent home delivery is needed beyond the existing structure and system for distribution and verification. For example, currently, a truck from an IOCL distributor travelling to a far-off location cannot serve BPCL and HPCL consumers, though all three OMCs are public sector companies. Vehicle pooling at the OMC level may effectively mitigate the challenges faced by distributors covering long distances (sometimes up to 50 km) for home delivery of LPG refills. A new mechanism could involve sharing resources such as vehicles, resulting in substantial cost savings related to maintenance, fuel, and salaries. Beyond cost efficiency, it can also optimise logistics, improving delivery scheduling, and reducing transit times, ensuring timely and reliable LPG home delivery for consumers.
Micro-distributors may also be used as an extension of the present LPG distributor model where the topup support is directed to village-level entrepreneurs (VLEs) who can stock seven cylinders (<100 kg for fire safety purposes as per existing law (Petroleum and Explosives Safety Organization 2016)), thereby lowering transportation costs and enhancing on-demand LPG home delivery. While existing entrepreneurs manage ration shops or common service centres (CSCs), there is an opportunity to include women entrepreneurs as well. Women entrepreneurs can help boost demand for LPG. Notably, OMCs are already experimenting with models of Urja Devis and Ujjwala Sakhis. Moreover, members of SHGs can pool resources, access microcredit for LPG cylinders, and raise awareness about safe LPG usage in villages. Additionally, the conversion of connections from a single to a double-bottle cylinder approach has shown promising results in a recent trial in Maharashtra (Harrell 2019).
Mapping consumer homes and overlaying them with road networks can provide a consumer dispersion index for distributors. It could aid the rationalisation of consumer registration, i.e. shift consumers from one distributor to another who is better placed to deliver. Further, universal adoption of technological solutions such as GPS trackers on vehicles and cylinders could also be powerful tools. All of these measures entail careful consideration of implementation and monitoring costs and should be accompanied by a robust enforcement system to ensure that improved (differentiated home delivery incentive structure) translates into 100 per cent home delivery on the ground.
This nationwide LPG distributors’ survey is the first to explore accessibility constraints in India’s clean cooking energy transition. Serving as a foundational resource, it sheds light on LPG distributors, hitherto under-studied in the clean cooking domain. While the study lays the groundwork, certain context-specific variations such as consumer dispersion need to be independently corroborated. Phase II of the study will delve deeper through analyses of qualitative interviews with LPG distributors, OMC field officers, and other stakeholders, aiming to provide more nuanced insights and recommendations for enhancing the efficiency and service quality of the LPG distribution system. As this study is based on a cross-sectional self-reported survey by distributors, OMC records would also be analysed to ascertain biases, or the lack of them, in survey responses wherever possible. The design for categorisation for disadvantage levels and the top-up support amount would also require additional data and analyses. It would also benefit from the inclusion of additional parameters outside the scope of this study, such as consumer dispersion index, and road density.
This is the first of its kind in the Global South with implications extending beyond India. The findings, derived from a nationwide survey, offer valuable insights for designing/modifying the LPG supply chain ecosystem across developing economies facing similar challenges.
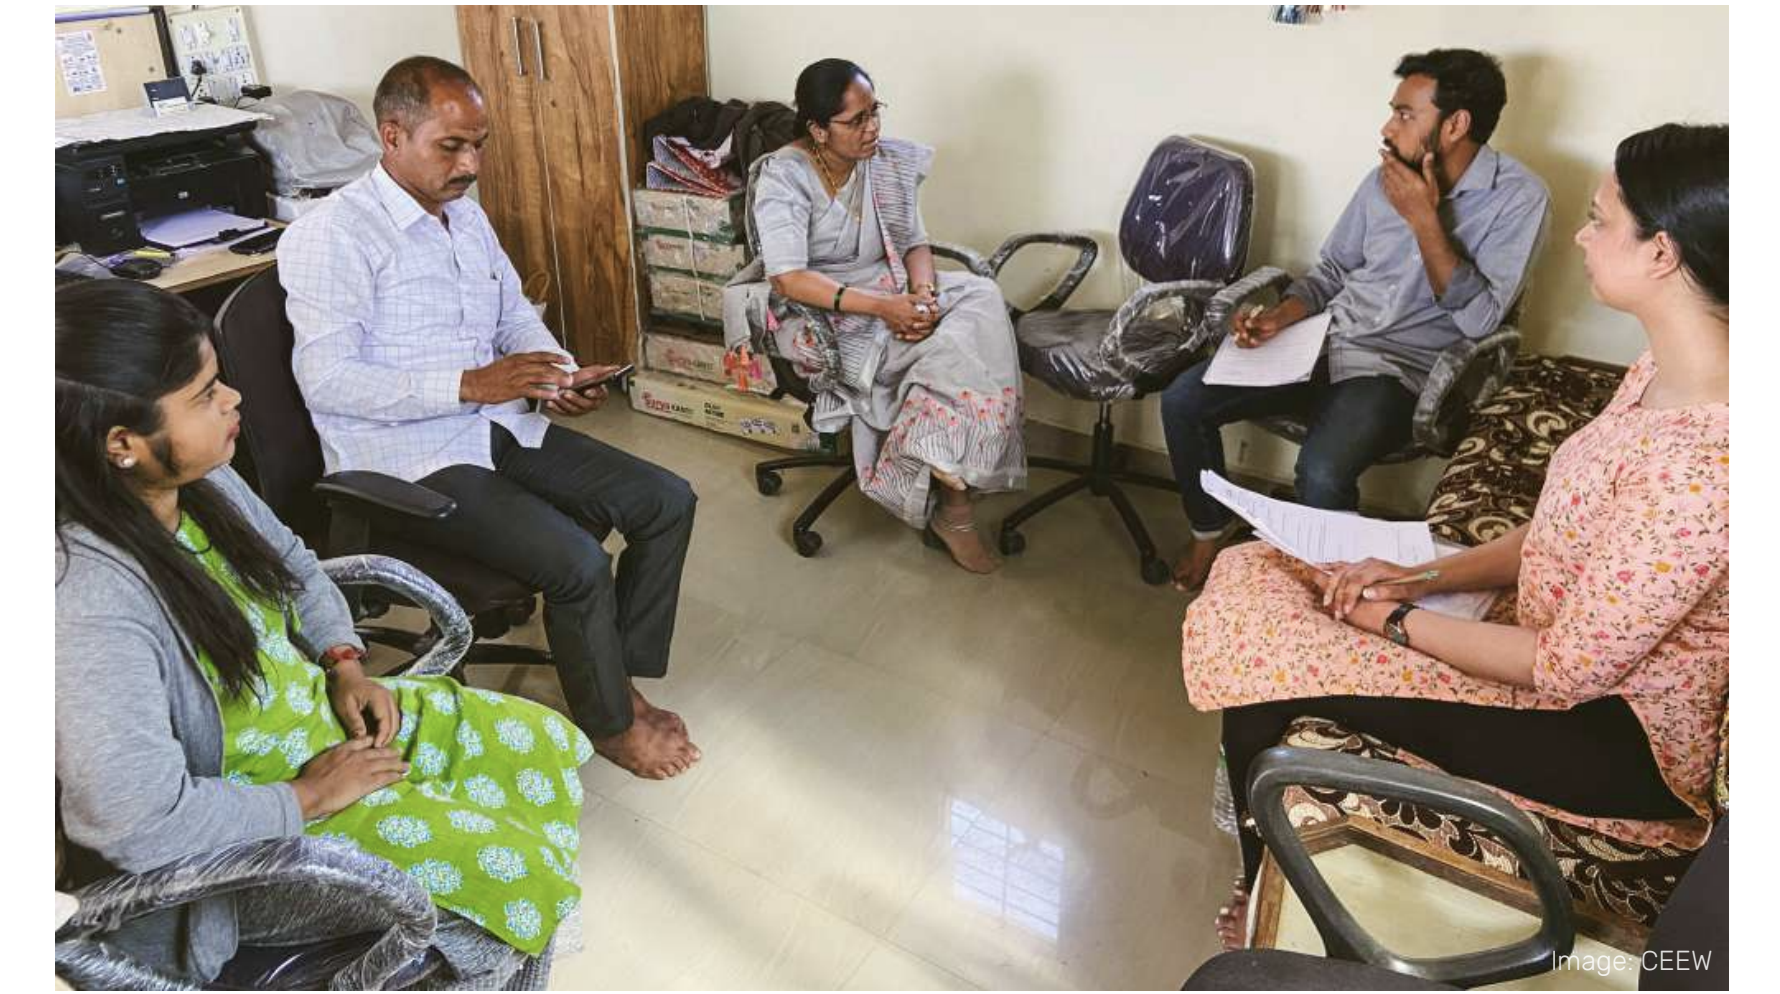
CEEW researchers (right) interacting with an LPG distributor as part of the survey, in Pargaon Tarf Khed, a village in rural Maharashtra.
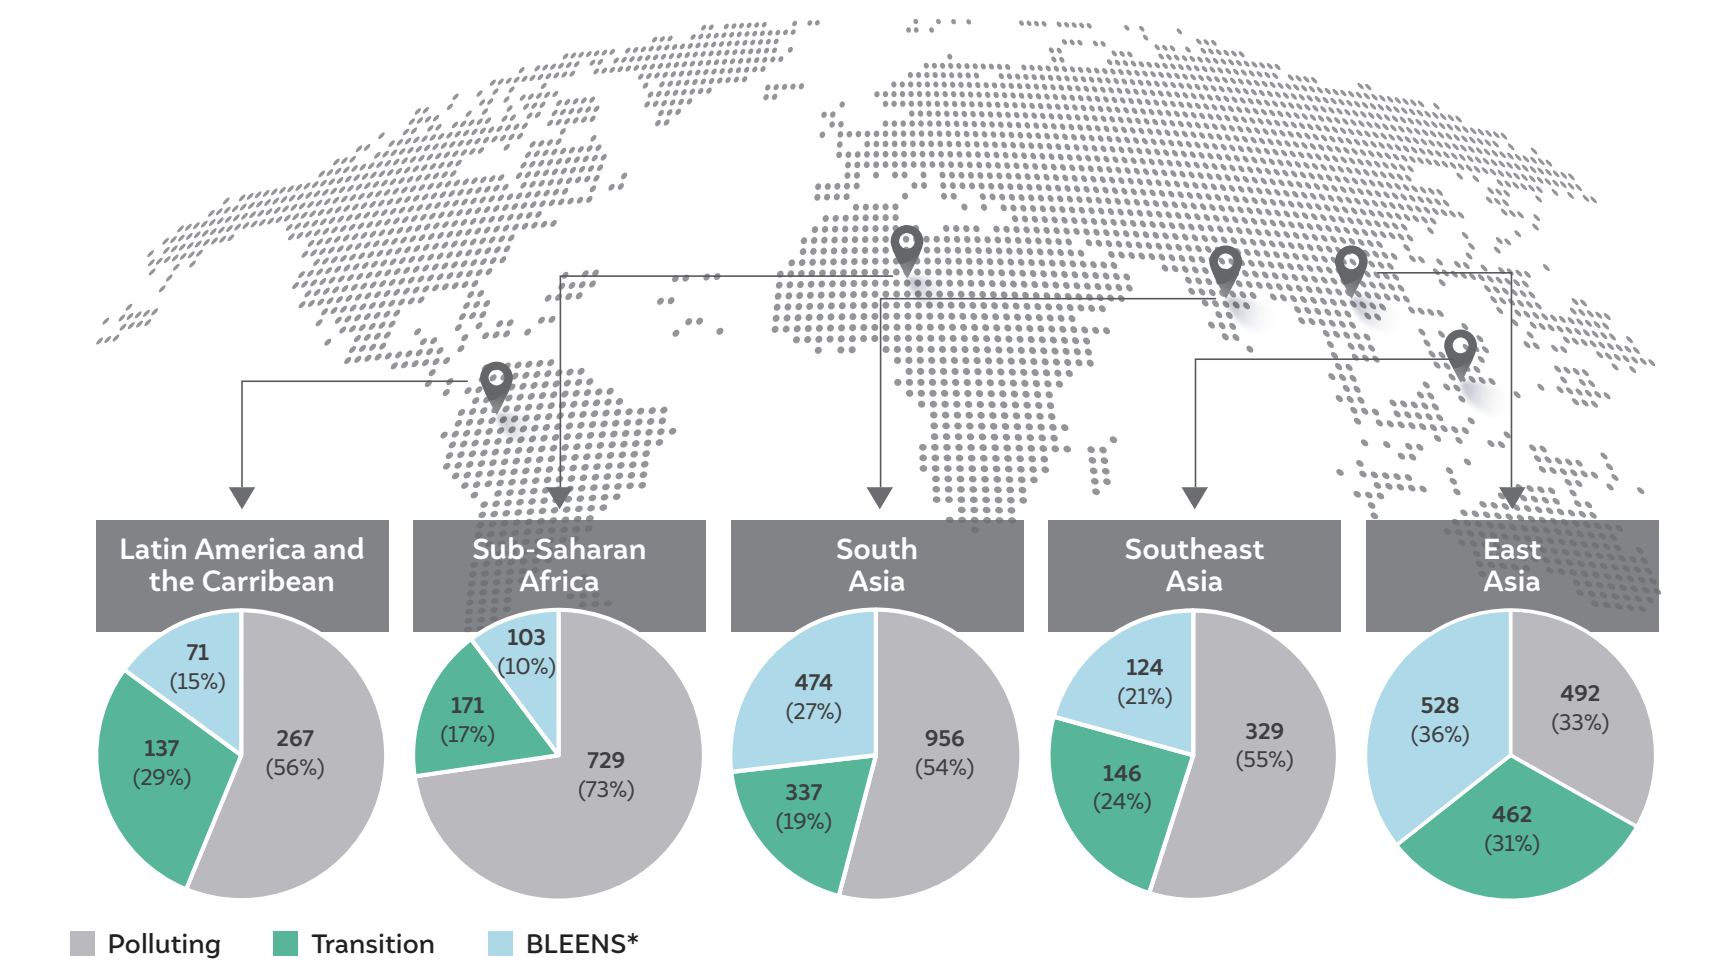
For centuries, the world has used firewood, coal, dung cakes, kerosene, and chaff derived from agricultural waste for cooking and heating. A majority of households in the Global South still rely on these polluting fuels as their primary fuel for cooking (Figure 1). However, the use of solid fuels for cooking poses a trifecta of challenges to human health, the environment, as well as gender equity. Progress towards primarily five UN Sustainable Development Goals (SDGs) –Goal 3 (Good health and well-being), Goal 5 (Gender equality), Goal 7 (Affordable and clean energy), Goal 13 (Climate action), and Goal 15 (Life on land) – is hampered by the different degrees of impact of cooking with solid fuels (Rosenthal et al. 2018, Gill-Wiehl et al. 2023). As a result, liquid petroleum gas (LPG) stands out as the leading solution for achieving clean cooking access, contributing to almost half of households reaching Goal 7 by 2030. Over the past decade, 70 per cent of those who gained access to clean cooking did so through LPG (IEA 2023), emphasising its crucial role in achieving the SDGs.
1.1 India's progress in expanding the clean cooking coverage via LPG
India has made significant progress over the past decade and a half in switching to clean cooking fuels, notably LPG. It started with the launch of the Rajiv Gandhi Gramin LPG Vitrak Yojana (RGGLVY) in October 2009, which was a major scheme in promoting LPG use in rural India. The RGGLVY was aimed at setting up LPG distribution agencies in rural and remote areas so that rural households could receive better access to LPG. The Government of India launched the Pradhan Mantri Ujjwala Yojana (PMUY) in May 2016 to expand LPG coverage2 among households.
Figure 1 Countries across the Global South continue to rely on polluting cooking fuels.
Source: Authors’ analysis
Note: Polluting here refers to households with no access to modern cooking energy services (MECS), transition refers to households that presently fulfill at least the Tier 2 multi-tier framework (MTF) standards for energy access as defined by World Bank for all six measurement attributes, namely, (i) exposure, (ii) efficiency, (iii) convenience, (iv) safety, (v) affordability, and (vi) fuel availability.
*BLEENS refers to households that have access to fuels that are in Tier 4 and above MTF standards, specifically, Biogas, LPG, Electricity, Ethanol, Natural Gas, and Solar.
It is important to highlight that between the launch of RGGLVY and PMUY, the number of LPG distributors almost doubled in India from 9,366 in 2009 to ~18,000 in April 2016 (PPAC 2016). Between May 2016 and July 2024, the Government of India has been able to provide LPG connections to over 103 million low-income households under the PMUY scheme (PPAC 2024) and increase the overall (estimated) LPG coverage to 99.8 per cent (PPAC 2024) from 62 per cent in 2016. Achieving a coverage rate of this magnitude with a consumer base of 326 million Indian households has been made possible by the existence of an extensive LPG distribution network across the country (PPAC 2024).
Yet, previous studies suggest that the figures for LPG connections are not indicative of its sustained use on account of barriers related to affordability, availability, and behavioural and cultural preferences (Jain et al. 2018, Kar et al. 2019, Mani et al. 2020). For instance, a recent study by Jeuland et al. (2023), conducted in India, demonstrated that household demand for LPG is sensitive to price, which has seen fluctuations in the recent past. The need for focused support for solutions such as LPG in the near to medium term is urgent as we await scalable renewable energy technologies for clean cooking, including solar energy, to become a long-term answer.
While there is enough literature on affordability and behavioural barriers related to access to clean cooking energy, very few studies have attempted to study the availability barrier in detail (Kumar et al. 2020), especially from the supply-side perspective. Even though the India Residential Energy Survey (IRES) 2020 highlighted that only about 83 per cent of urban consumers and 54 per cent of rural consumers receive home delivery of LPG (Mani et al. 2021), the findings were based on self-reported responses by the households (LPG consumers).
Before delving into the intricacies of the supply side perspective, it is important to provide a quick review of the LPG governance and market structure in India. This is particularly important as LPG is a controlled substance that is subsidised for household cooking purpose.
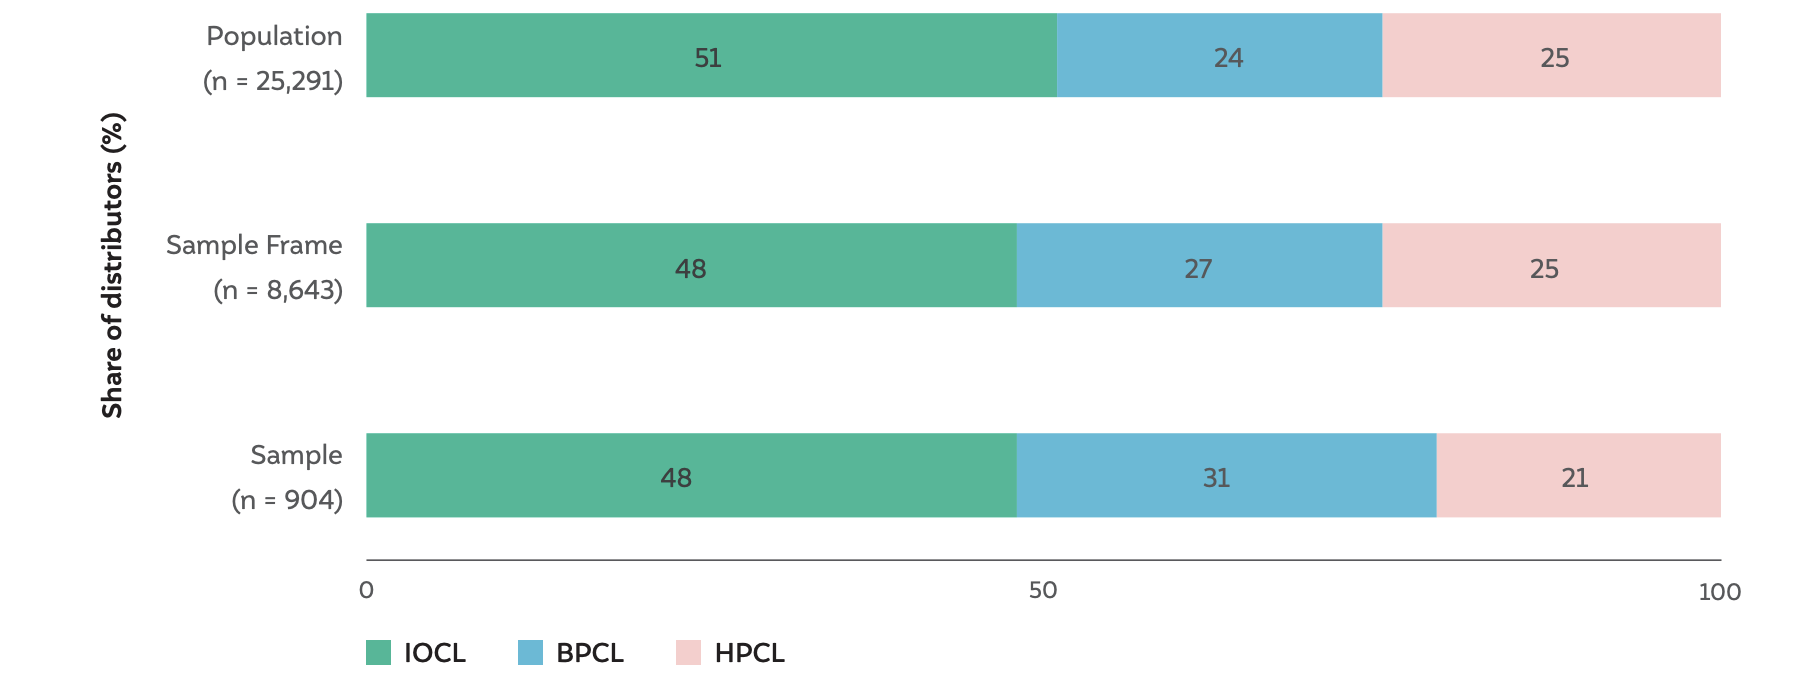
India has three public-sector oil marketing companies (OMCs) – Indian Oil Corporation Limited (IOCL), Bharat Petroleum Corporation Limited (BPCL), and Hindustan Petroleum Corporation Limited (HPCL) – that fall under the purview of the Ministry of Petroleum and Natural Gas (MoPNG). LPG distributors are responsible for providing home delivery and repair services of OMCs’ LPG cylinders to the consumers. Over 25,000 LPG distributors, currently appointed by the OMCs, are the customer-facing interface in the LPG supply chain. About 50 per cent of LPG distributors are with IOCL, while BPCL and HPCL have 25 per cent each (PPAC 2024) (Figure 2). Distributors are private entities and generally have to apply through a lottery system to gain access into the LPG distribution business.
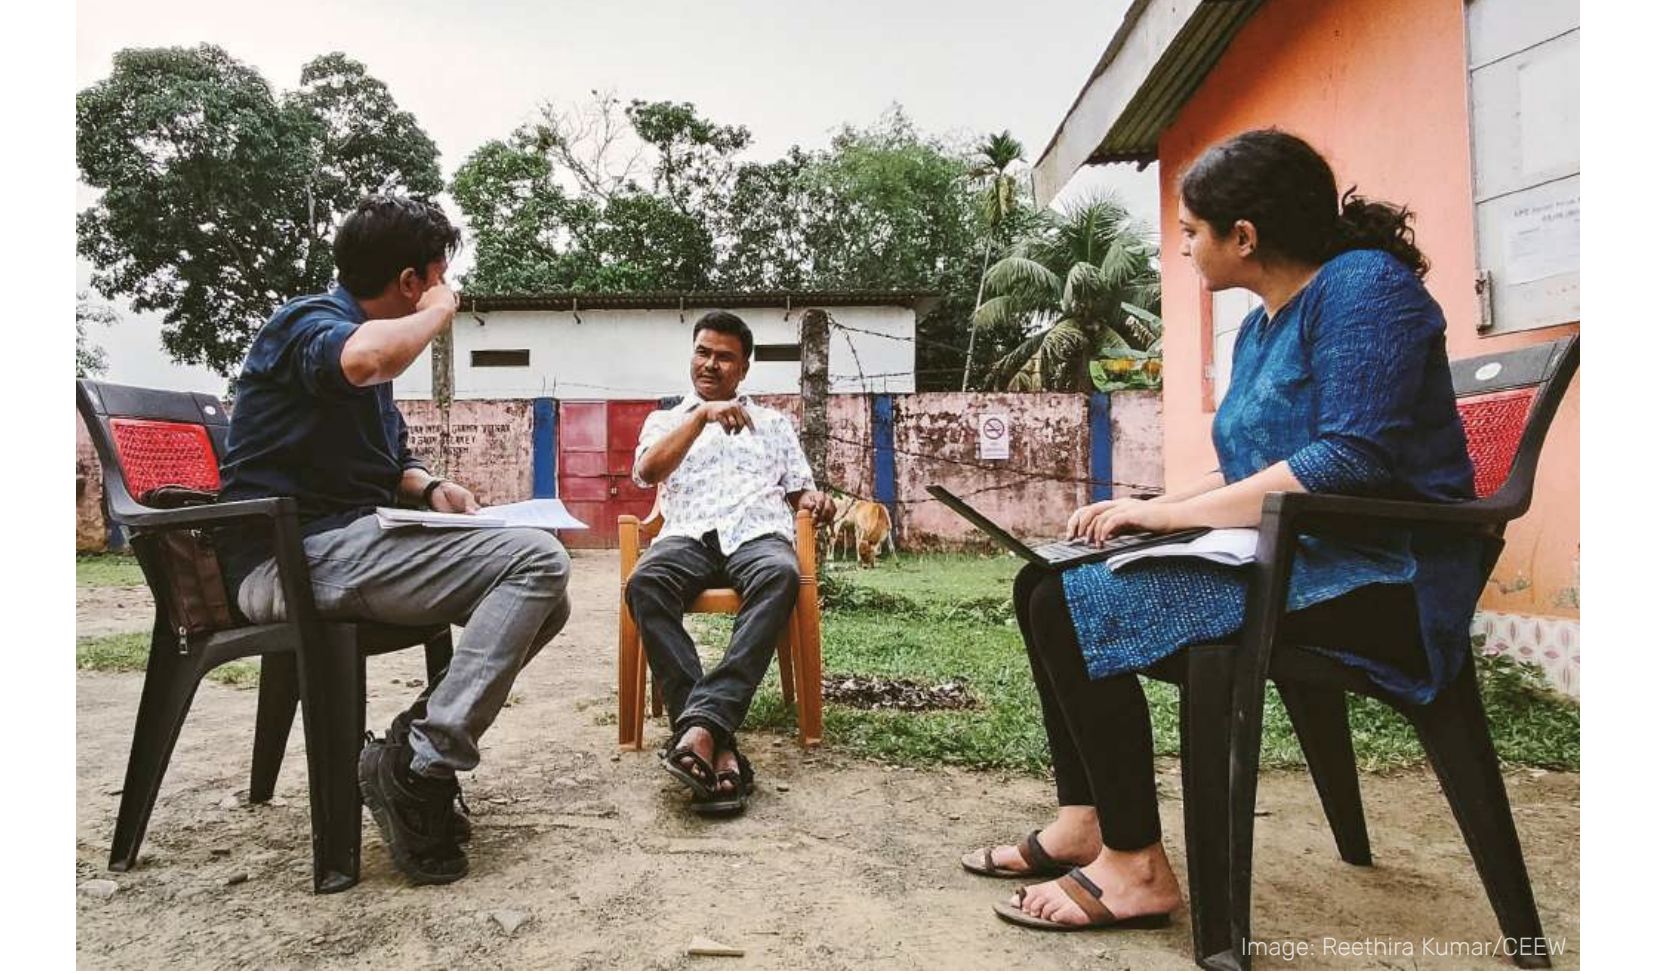
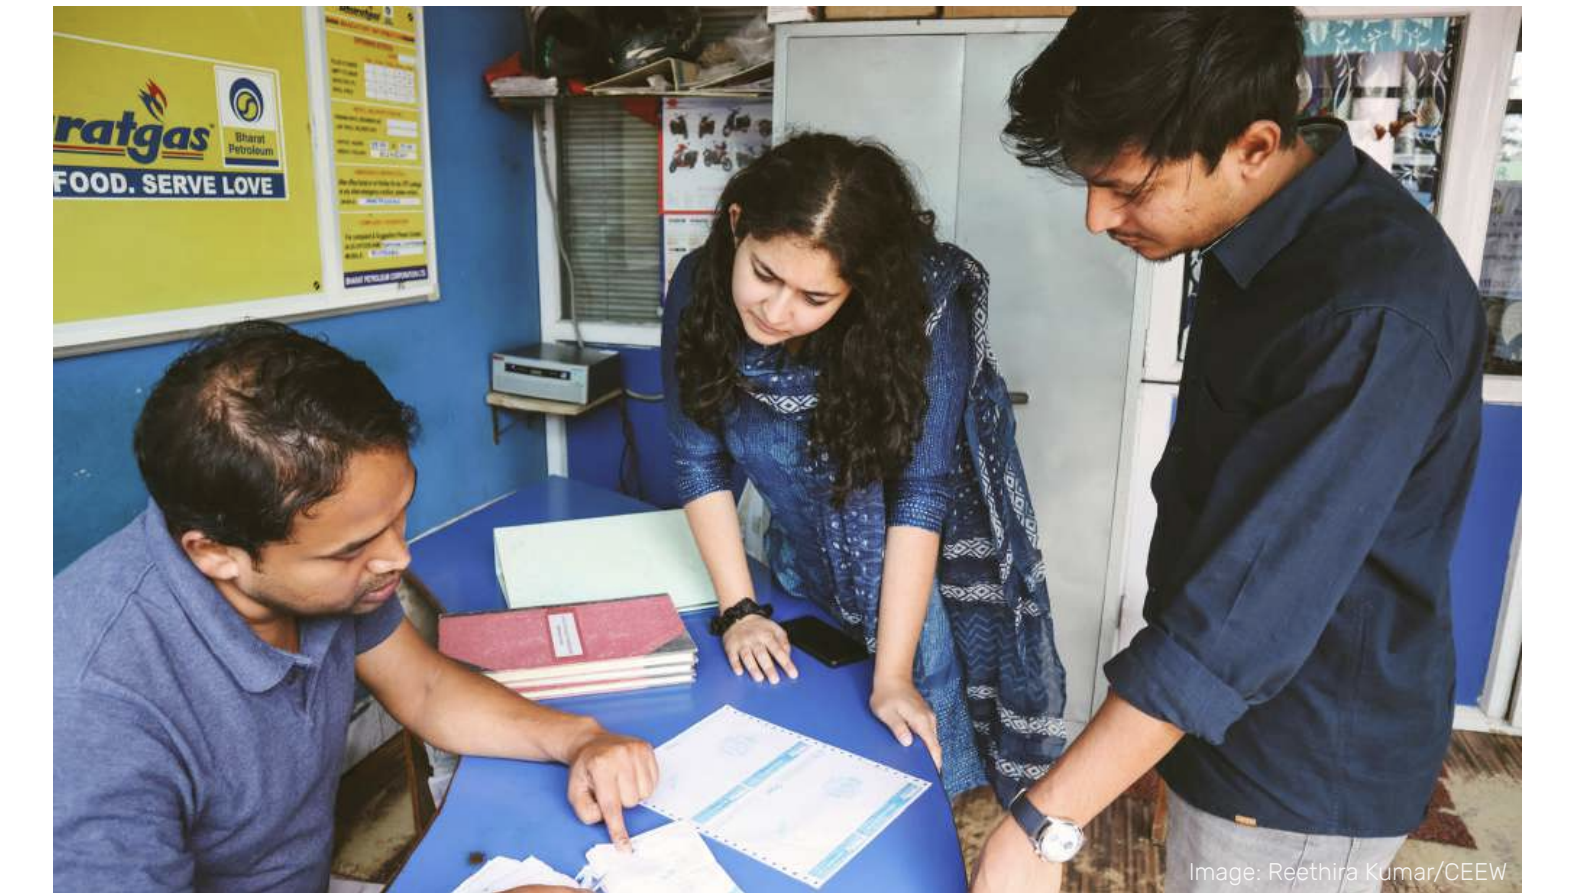
CEEW researchers (right and left) discussing the challenges faced by distributors during the monsoon season in Sivasagar, Assam.
The LPG distributorships are classified into the following four categories based on their geographical area: i) Shehri Vitrak (distributors who serve primarily urban LPG consumers); ii) Rurban Vitrak (distributors who serve a mix of urban and rural LPG consumers); iii) Gramin Vitrak (distributors who serve primarily rural LPG consumers), and; iv) Durgam Kshetriya Vitrak (LPG distributors who serve rural LPG consumers located in remote regions such as forested areas) (MoPNG 2016). In this report, they are referred to as urban, rurban, rural, and durgam distributors. Durgam distributors, who account for about 8 per cent of distributors in India, are exempt from home delivery requirements5 and are therefore not the focus of this analysis.
The LPG distributorships are classified into the following four categories based on their geographical area: i) Shehri Vitrak (distributors who serve primarily urban LPG consumers); ii) Rurban Vitrak (distributors who serve a mix of urban and rural LPG consumers); iii) Gramin Vitrak (distributors who serve primarily rural LPG consumers), and; iv) Durgam Kshetriya Vitrak (LPG distributors who serve rural LPG consumers located in remote regions such as forested areas) (MoPNG 2016). In this report, they are referred to as urban, rurban, rural, and durgam distributors. Durgam distributors, who account for about 8 per cent of distributors in India, are exempt from home delivery requirements5 and are therefore not the focus of this analysis.
This present study is part of a broader Council on Energy, Environment and Water (CEEW) led-initiative, the Cleaner Air and Better Health project (supported by USAID), which aims to strengthen air pollution mitigation and reduce exposure to air pollution in India by establishing evidence-based models for better air quality management. This study attempts to reflect on the challenges perceived by LPG distributors in providing home delivery across different types of distributorships and the support measures requested by distributors in order to boost LPG home delivery rates. According to a recent CEEW study, about 64 per cent of Indian households report receiving home delivery of their refills; the same study has also indicated that improved home delivery may increase LPG use (Mani 2021). Against the backdrop of vastly different geographies across rural and urban India, there could exist several challenges faced by the distributors in transporting LPG refills from their godown to the consumers’ doorstep. For instance, challenges related to poor road infrastructure in rural areas or difficult terrain in mountainous regions could have significant additional cost implications for distributors operating in such localities, as they would have lower deliveries per trip compared to urban distributors. Further, some distributors may be operating in economically backward areas, which could impact their overall refill sales.
This study answers the following questions:
• Why are some distributors unable to provide home delivery of refills to all consumers, even though all LPG distributors in India (except durgam distributors) are mandated to do so?
• What are the potential factors behind the difference in home delivery levels between urban and rural distributors?
• What could be the expected impact of 100 per cent home delivery of refills on LPG use, and how would it compare with the expected impact of change in LPG refill prices?
• What policy support mechanisms can improve the distributors’ ability to ensure home delivery of LPG refills?
Figure 2 LPG distributors in India fall under the purview of the Ministry of Petroleum and Natural Gas.
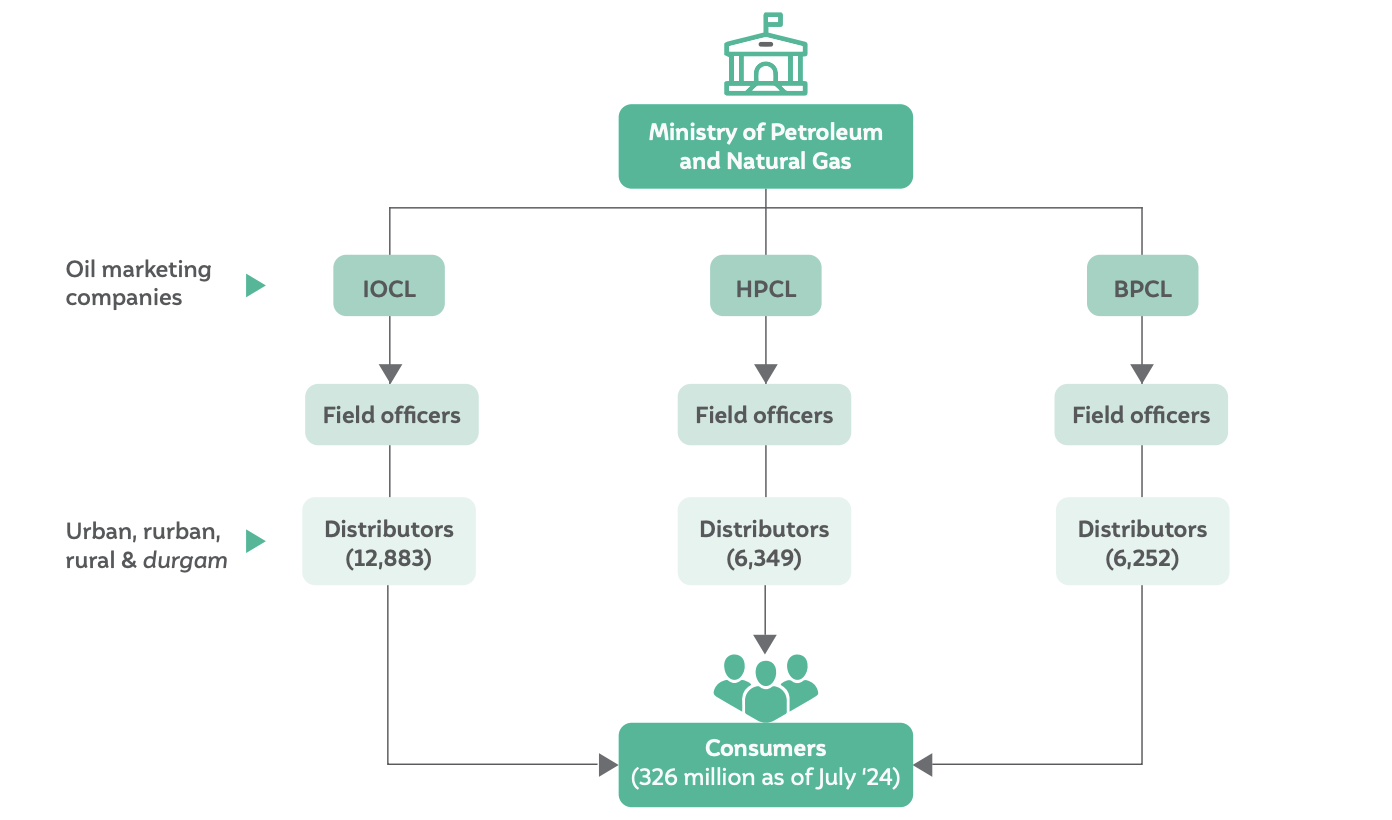
Source: Authors’ compilation based on Bharat Petroleum Corporation Limited, Hindustan Petroleum Corporation Limited 2024.
Note: Indian Oil Corporation Limited (IOCL), Bharat Petroleum Corporation Limited (BPCL), and Hindustan Petroleum Corporation Limited (HPCL).
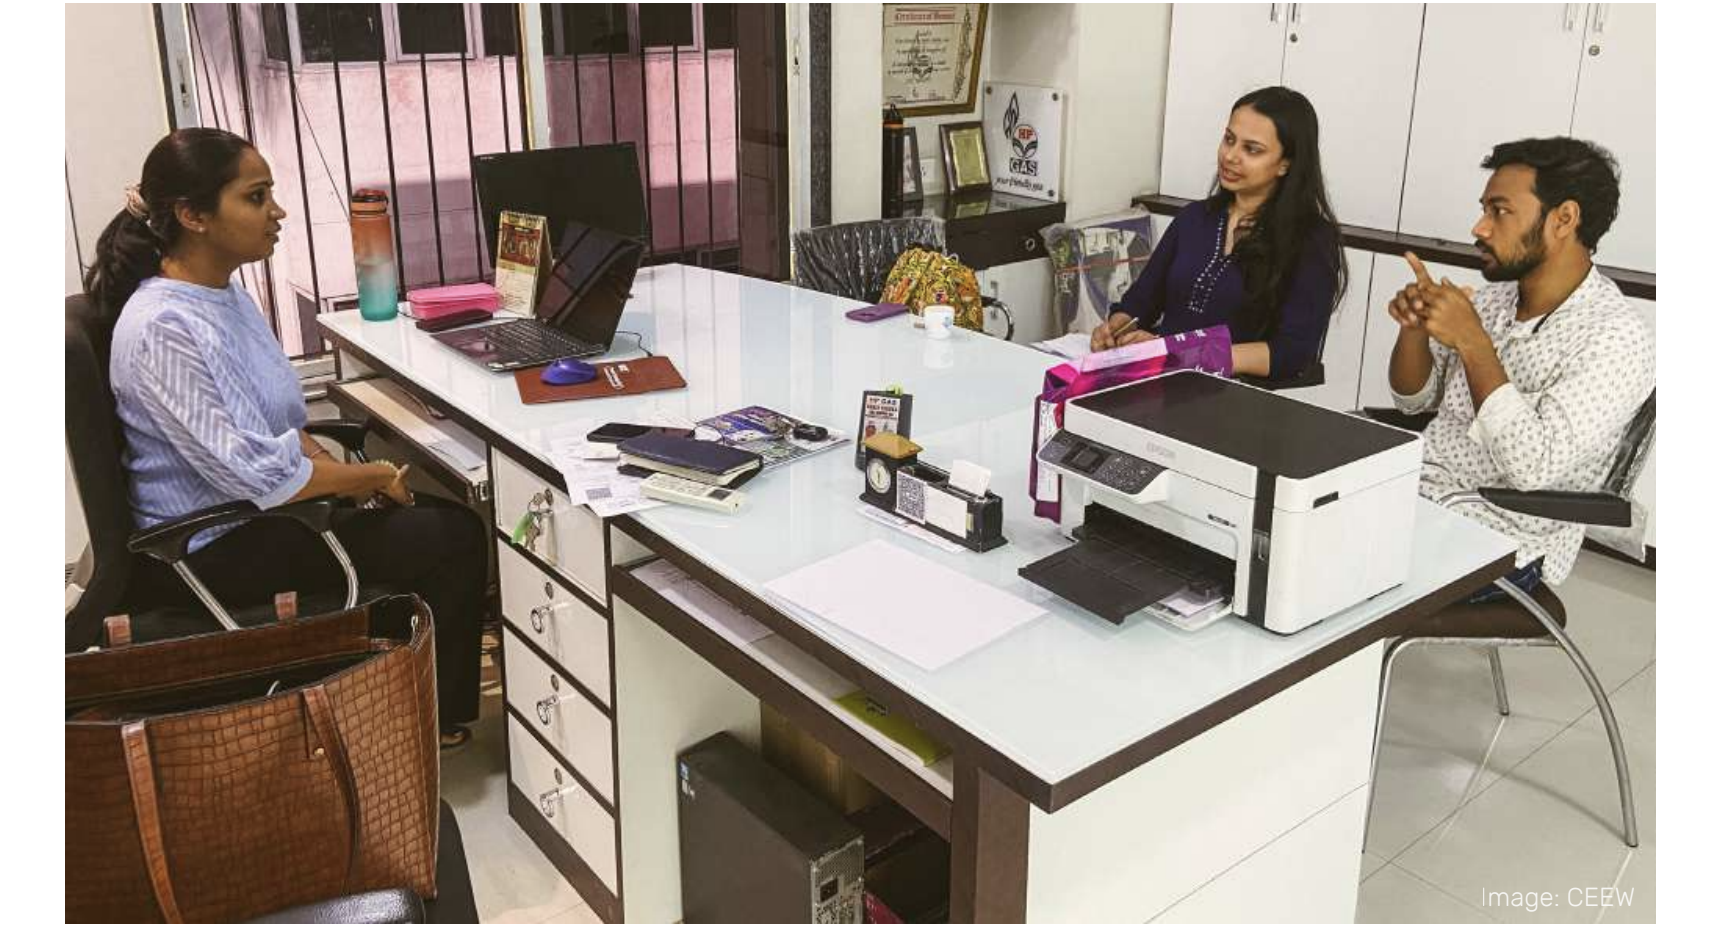
CEEW researchers discussing innovative marketing techniques adopted by a distributor in Mussoorie, Uttarakhand.
This survey is a nationwide self-reported telephonic survey of 904 LPG distributors spread across all 3 OMCs in the 6 Indian states of Assam, Jharkhand, Maharashtra, Telangana, Uttarakhand, and Uttar Pradesh. Six states at varying stages of transition to LPG (as a clean cooking fuel) were identified, which is reflected in the composite index derived from four key variables. A brief description of the survey design and data collection process is provided in this chapter.
The goal was to first select a few states that are diverse in terms of their potential to transition to exclusive use of LPG in the near-to-medium term. The literature was reviewed to identify sampling methodologies for a nationally representative survey for a vast and diverse country such as India, with 28 states and 8 union territories. The methodologies of two such surveys were partially adapted to design this survey. The two reference surveys were:
• State of the Nation Survey (Lokniti)
Lokniti, the Centre for the Study of Developing Societies (CSDS), in collaboration with the CNNIBN, surveyed the Indian family to understand the conditions of senior citizens, the status of family and money, attitudes toward parenting, perception of marriage and morals, and generational gaps. In this survey, urban areas of 18 states were selected if they contained more than 1 per cent of the urban population out of the total urban population of the country (Lokniti, CSDS, and CNN-IBN 2008).
• Time Use Survey to estimate the contribution of women to the national economy, National Statistical Organisation, NSO
The Time Use Survey by the NSO was conducted to measure the participation of men, women, and other groups of persons in paid and unpaid activities (Ministry of Statistics and Programme Implementation, 2020). Given the socioeconomic, demographic, geographic, and cultural diversities of India, this survey selected six sub-units to provide geographical representation to each region of the country.
Variables were shortlisted that could be used for the stratification of states. The survey being the first of its kind conducted in India, key parameters were identified that could be relevant in determining the average usage of LPG at a state level. These included the National Sample Survey Organisation (NSSO) 77th Survey – average expenditure, maximum educational qualification and biostatistics such as the life–death ratio and the wealth ratio from National Family Health Survey 5 (NFHS-5). These were then narrowed down to four parameters, which are listed as follows:
1. Alternate fuel availability
Share of area with above-ground biomass (AGB) : States with a higher AGB will have a higher availability of substitutes for clean cooking fuels (in the form of firewood or biomass) and hence may have households with a lower propensity towards the use of LPG as a clean cooking fuel. Therefore, 1 - percentage share of AGB at the state level was used as a variable. The data was obtained from the LULC (land use/land cover) data of the India State of Forest Report 2021 (Forest Survey of India 2021).
2. Affordability
Per capita net state domestic product: On average, households in states with higher per capita net state domestic product are likely to be richer and may have a higher inclination towards consumption of LPG. The data was obtained from the RBI Handbook of Statistics on Indian States 2020–21 data (RBI 2021).
3. Awareness
Share of households using clean fuels: Since there is no data on awareness levels for clean cooking benefits, the state-level share of households using clean fuels (as their primary source of cooking) was used as a proxy for the same. While the data is not directly linked to LPG consumption, the underlying assumption is that states with more households using clean fuels as primary cooking fuel are, on average, more likely to be aware of the benefits of clean cooking fuels. The data was obtained from the National Family Health Survey-5 (Ministry of Health and Family Welfare 2021).
4. Bandwagon effect
Average LPG consumption per person: The current average LPG consumption per person was used as the baseline from which states have to progress towards exclusive LPG use. States with already existing higher per capita LPG consumption are more likely to transition towards clean cooking in the near future due to the peer effect (Mani et al. 2020). The data on LPG consumption was obtained from the Petroleum Planning and Analysis Cell (PPAC) LPG Profile April 2022 data (PPAC 2022).
Using this information, a composite index was created representing each state’s propensity towards the adoption of clean cooking fuel and all the states were divided into six groups as per the increasing value of the index. The composite index was created after standardising the distribution of the four aforementioned variables to a normal distribution, with a mean of 0 and a standard deviation of 1. Then, the values were aggregated for each state by taking an equally weighted average of the four variables. Decile classes were subsequently defined using the aggregate value (rank) of the states.7 Following this, purposive sampling was used to select one state from each group based on their geographic diversity and traditional fuel (firewood, coal etc.) diversity (Annexure 1).
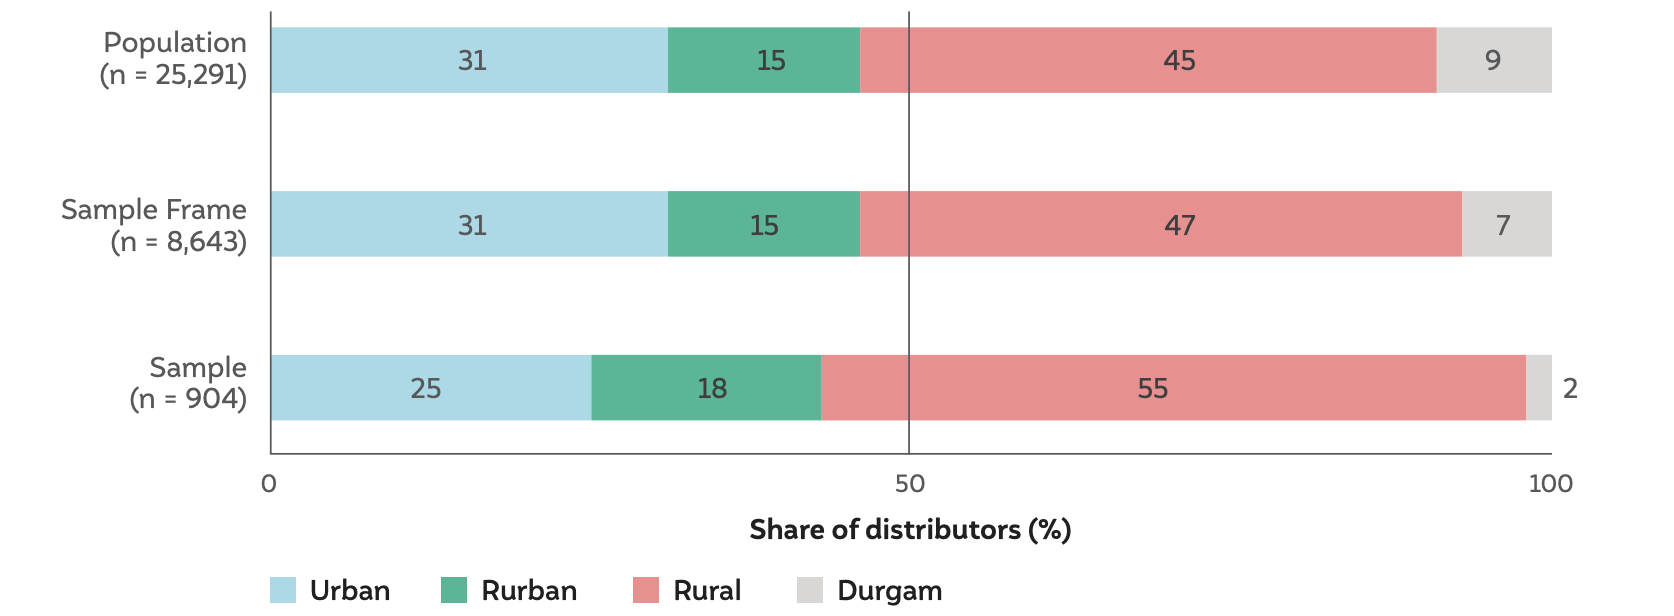
After shortlisting the states (Table 1), two conditions were used to determine the final sample size for each state. First, a minimum sample of 100 was taken from each state (condition 1) to ensure sufficient statistical power for a basic state-wise snapshot. Second, a minimum sample of 562 was needed for a nationwide survey of ~25,000 distributors, calculated using simple random sampling with a 4 per cent margin of error and a 95 per cent confidence interval (condition 2). 562 samples were distributed as per the proportion of the distributor population for each state. Subsequently, the sample size was determined to be 813 (as shown in Table 1) by selecting the maximum for each state across conditions 1 and 2. A total sample of 1,275 distributors8 were then selected to account for a 35 per cent non-response rate on a per-state basis. Details on sample size calculation can be found in Table 1. These 1,275 distributors were randomly selected from the sampling frame of all (8,643) distributors across the 6 states of Assam, Maharashtra, Jharkhand, Telangana, Uttarakhand, and Uttar Pradesh (it was established that these 6 states reasonably represent 28 states). A total of 904 sample surveys were completed against the target of 813 surveys while ensuring that the minimum sample size on a per-state basis (column E, Table 1) was satisfied by the final sampling numbers (column H, Table 1). Of the three OMCs, IOCL has the largest market share in India’s LPG distribution system; half of all distributors in India (~25,000) are from IOCL. It was observed that our sampling frame and surveyed sample closely resembled the population distribution (Figure 3). It was also observed that, in the surveyed sample of 904 LPG distributors, OMC-wise distribution closely resembled the population distribution, with a slight overrepresentation from BPCL in all six states, especially Jharkhand and Maharashtra (Annexure 4, Figures A9 and A10).
Figure 3 Sample proportions closely resemble the population distribution for LPG distributors
Source: Authors’ analysis
CEEW researchers (right) in conversation with a distributor who has been awarded for quality service on multiple occasions.
Table 1 1,275 LPG distributors were shortlisted and 904 were surveyed against the overall target of 813 distributors.
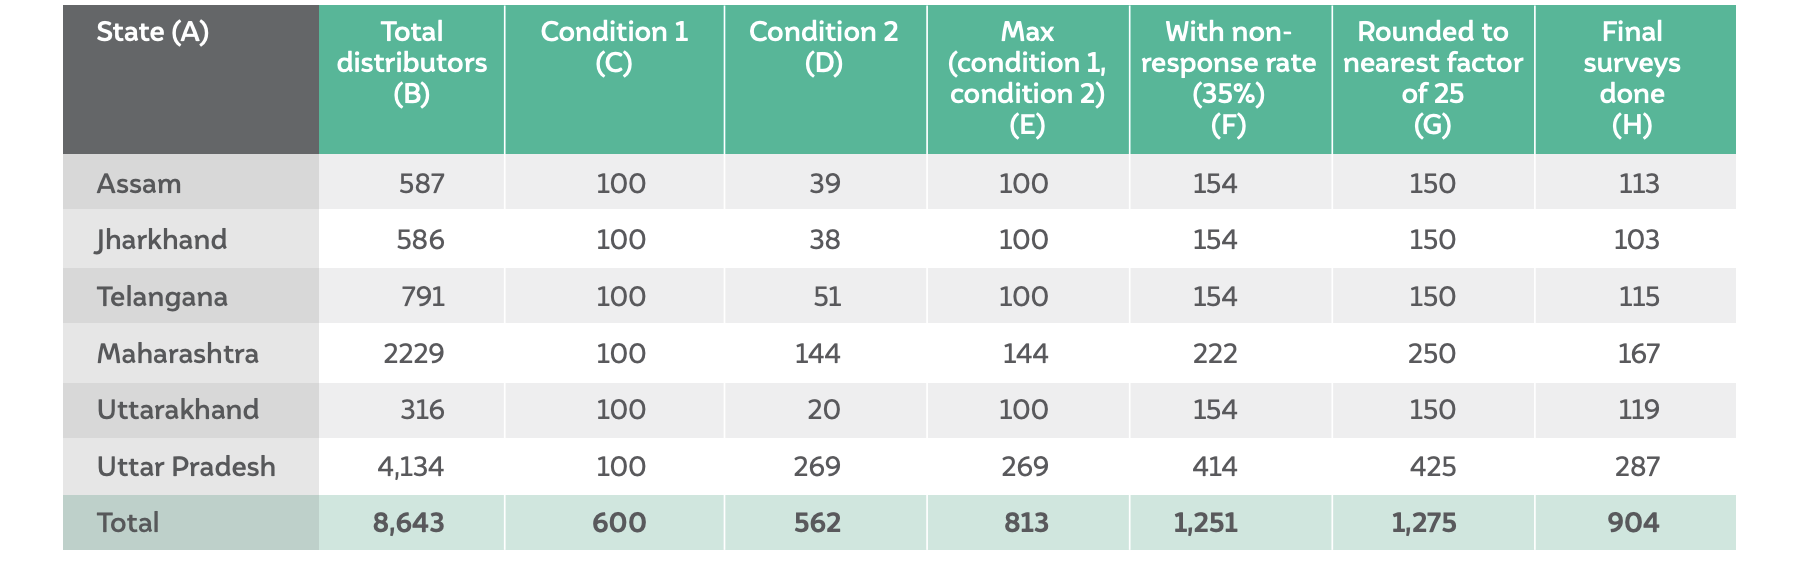
Source: Authors’ analysis
Note: Condition 1 was derived by taking a minimum sample of 100 whereas condition 2 is the minimum sample size required for a proportionately representative sample by state.
To design the survey questionnaire, approximately 25 qualitative interviews were conducted in Odisha with LPG distributors and sales officers, including 10 telephonic surveys, 15 field interviews, and focus group discussions to better understand the complexities and nuances within the LPG distribution system. The insights from these interviews and focus group discussions served as the genesis of this questionnaire and the report.
The final survey questionnaire was designed to capture information on distributor consumer base and spread, refill rates, extra commissions required, compliance/ non-compliance of Unified Guidelines, effects of price on refill sales, and support required from OMCs. The survey comprised 20 questions and was made available in 5 languages – Assamese, English, Hindi, Marathi, and Telugu.
Figure 4 A Study timeline
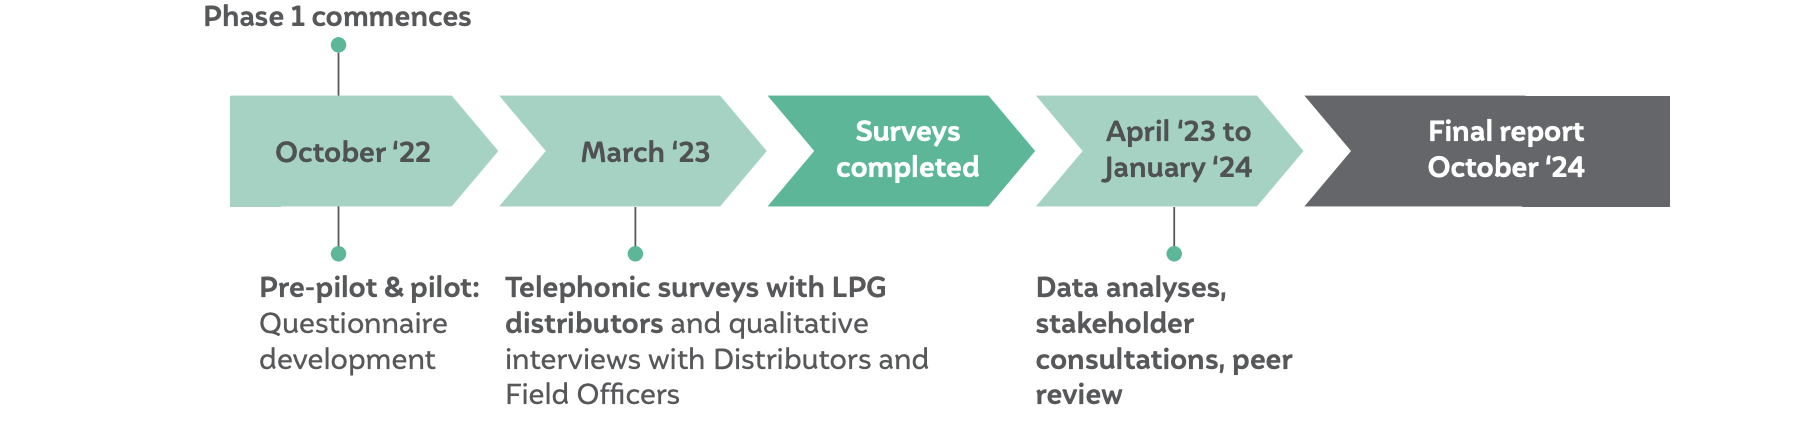
Source: Authors’ compilation
Figure 4 B A total of 904 surveys were completed between October 2022–March 2023.
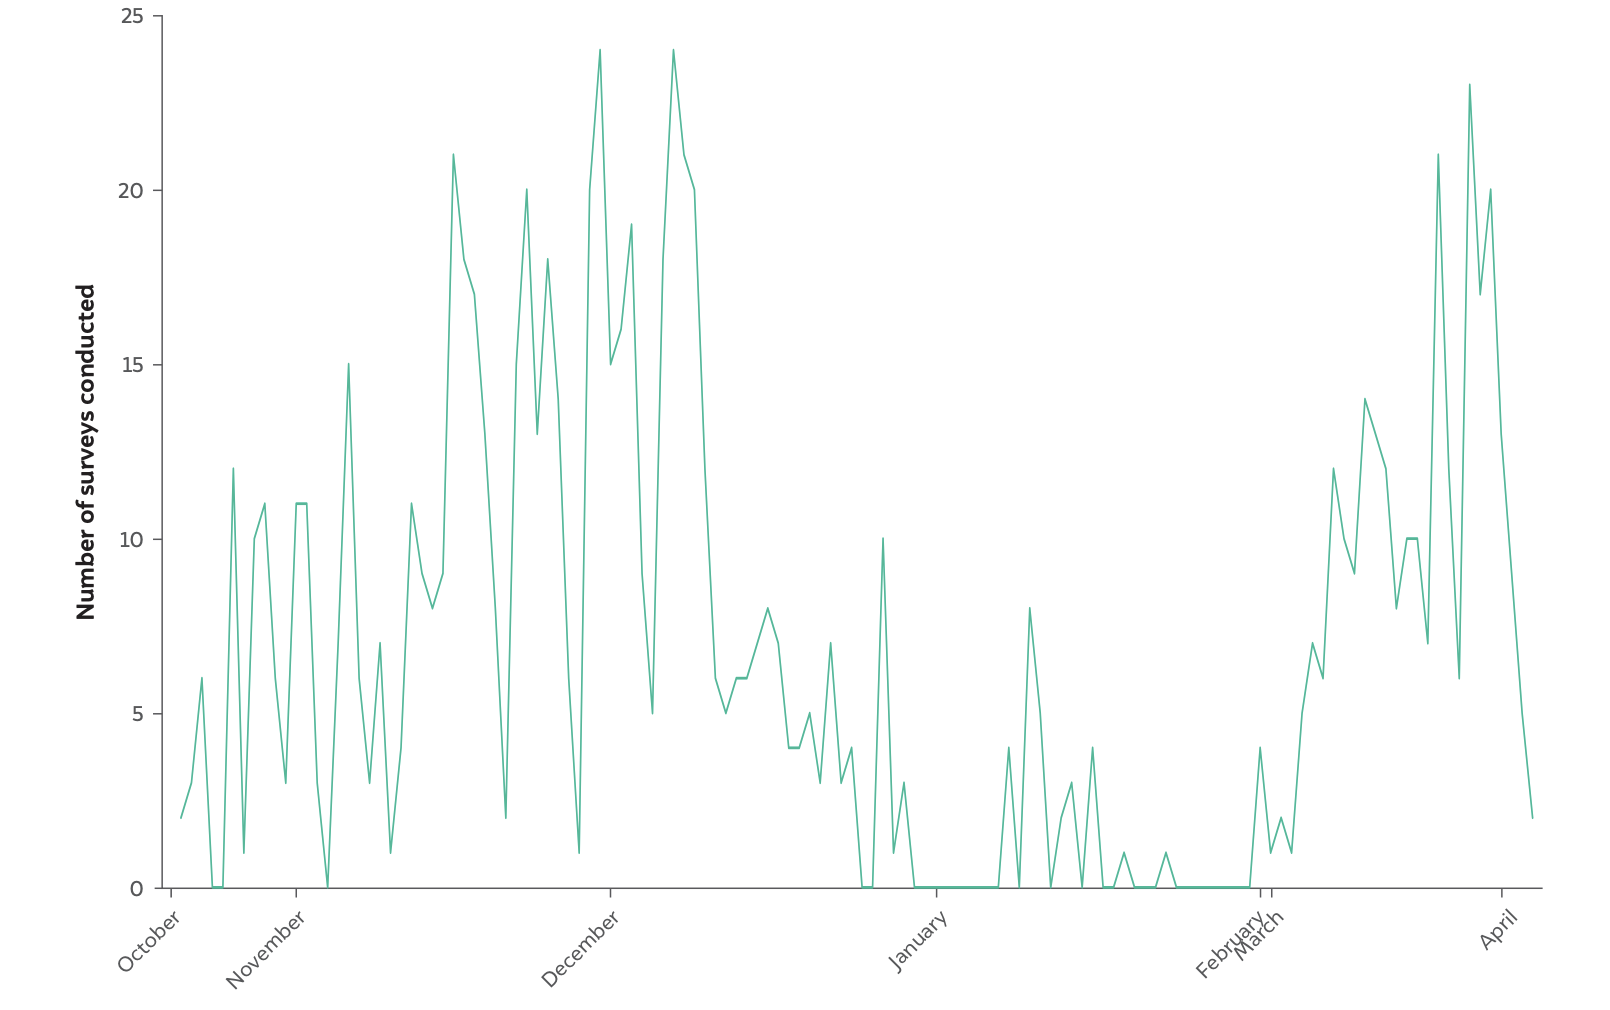
Source: Authors’ analysis
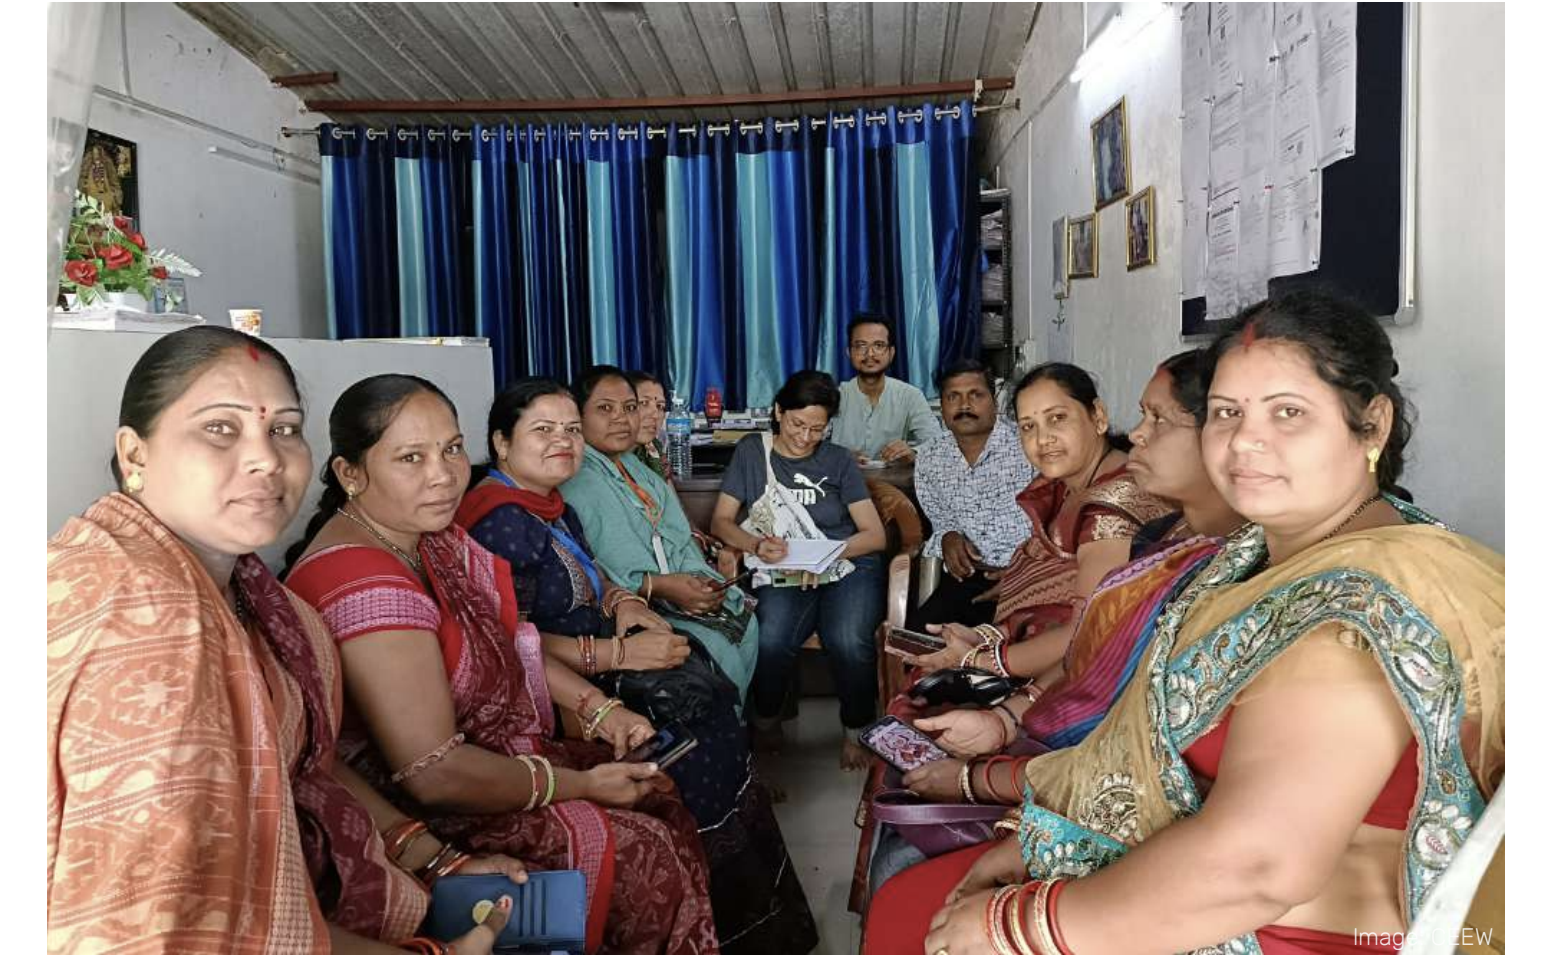
CEEW researchers with SHG members in Odisha who partner with local distributors for LPG refill purchase and home delivery.
There are several biases that survey data is vulnerable to, including but not limited to recall bias, enumerator bias, and social desirability bias. To minimise these errors, multiple rounds of data quality checks were conducted at all stages of survey completion. A key limitation of the data is that it is self-reported by the distributors; hence, there is a risk of survey response biases such as social desirability bias. Further, certain questions are linked to distributor compliance issues and may have evoked conservative replies. Besides, the survey findings may not comprehensively reflect the ground realities of the LPG refill delivery system. To offset this, an additional phase of qualitative interviews will be conducted with LPG distributors and other important stakeholders in the LPG ecosystem of India (such as field/sales officers, regional heads from the OMCs and distributor union representatives) findings from which will be shared in subsequent reports.
Additionally, for this analysis, median values were used for most of the important variables rather than averages, as there were many outliers due to the differences in distributor types and the consumer bases they service. In such cases, median values (which are relatively less affected by extreme values) give a better sense of the central tendency.
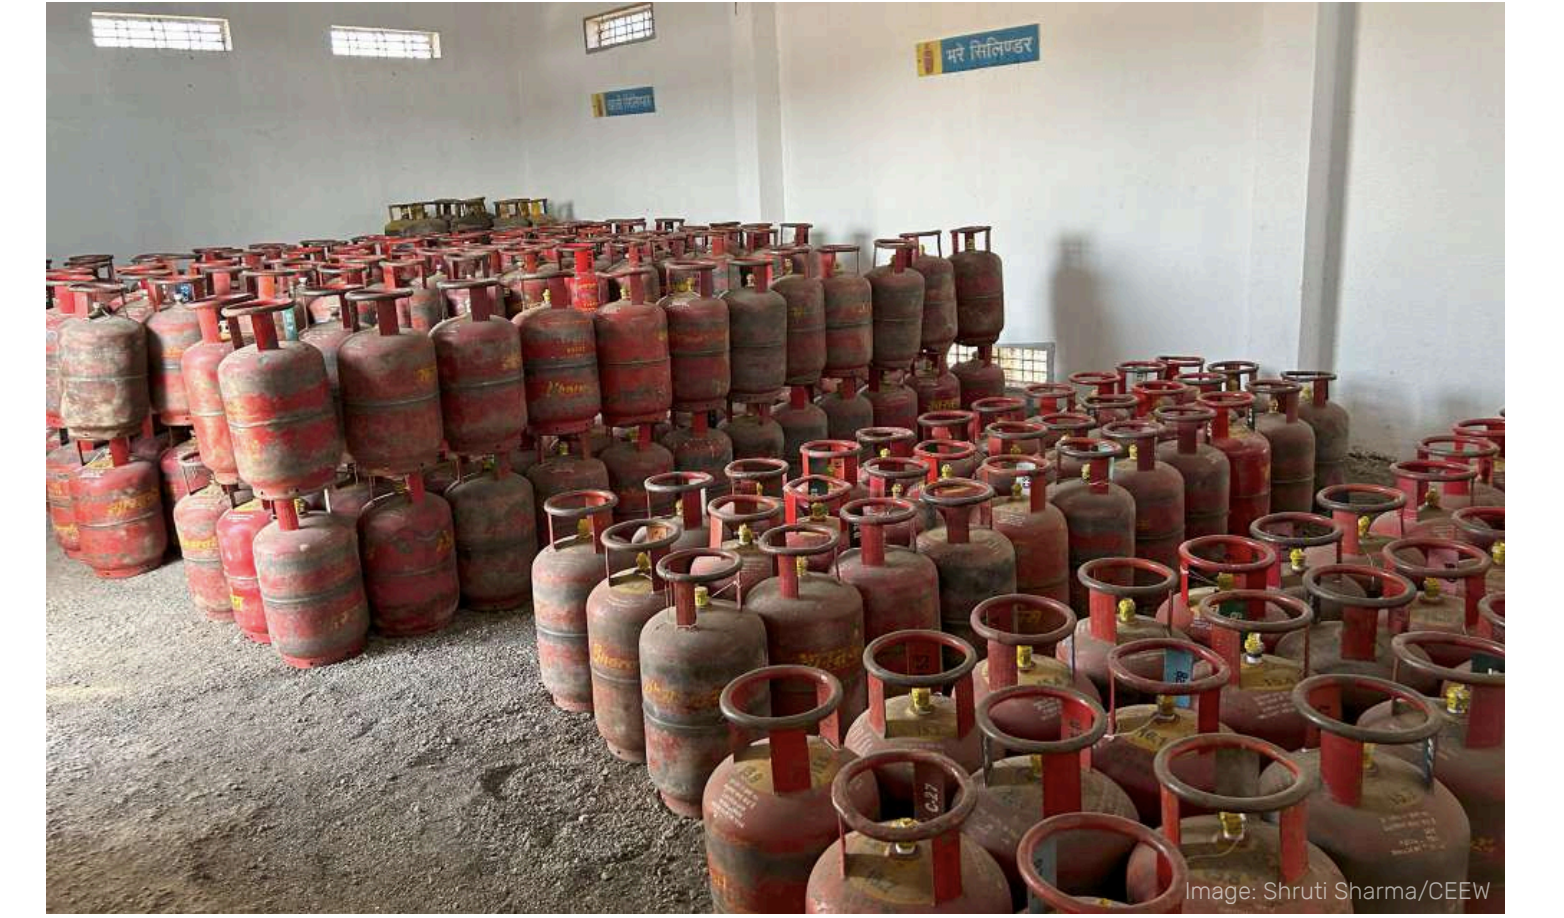
An LPG godown with safety protocols in place, ensuring secure storage and distribution.
In the sample, more than one-fourth of the surveyed LPG distribution agencies were opened after the launch of the PMUY scheme in 2016. However, more than 40 per cent of the surveyed distribution agencies were opened after the launch of RGGLVY in 2009 but before PMUY (Figure 6).10 We also found that over half (54 per cent) of the respondents owned these agencies or were related to the owners (24 per cent) (Figure 7). This suggests that distribution agencies are primarily small family-run enterprises. The majority of the agencies (94 per cent) surveyed were operated by men, which also indicates that this is a male-dominated business.
Figure 5 Randomly sampled LPG distributors classified by their area type follow a similar distribution to that of the population
Source: Authors’ analysis
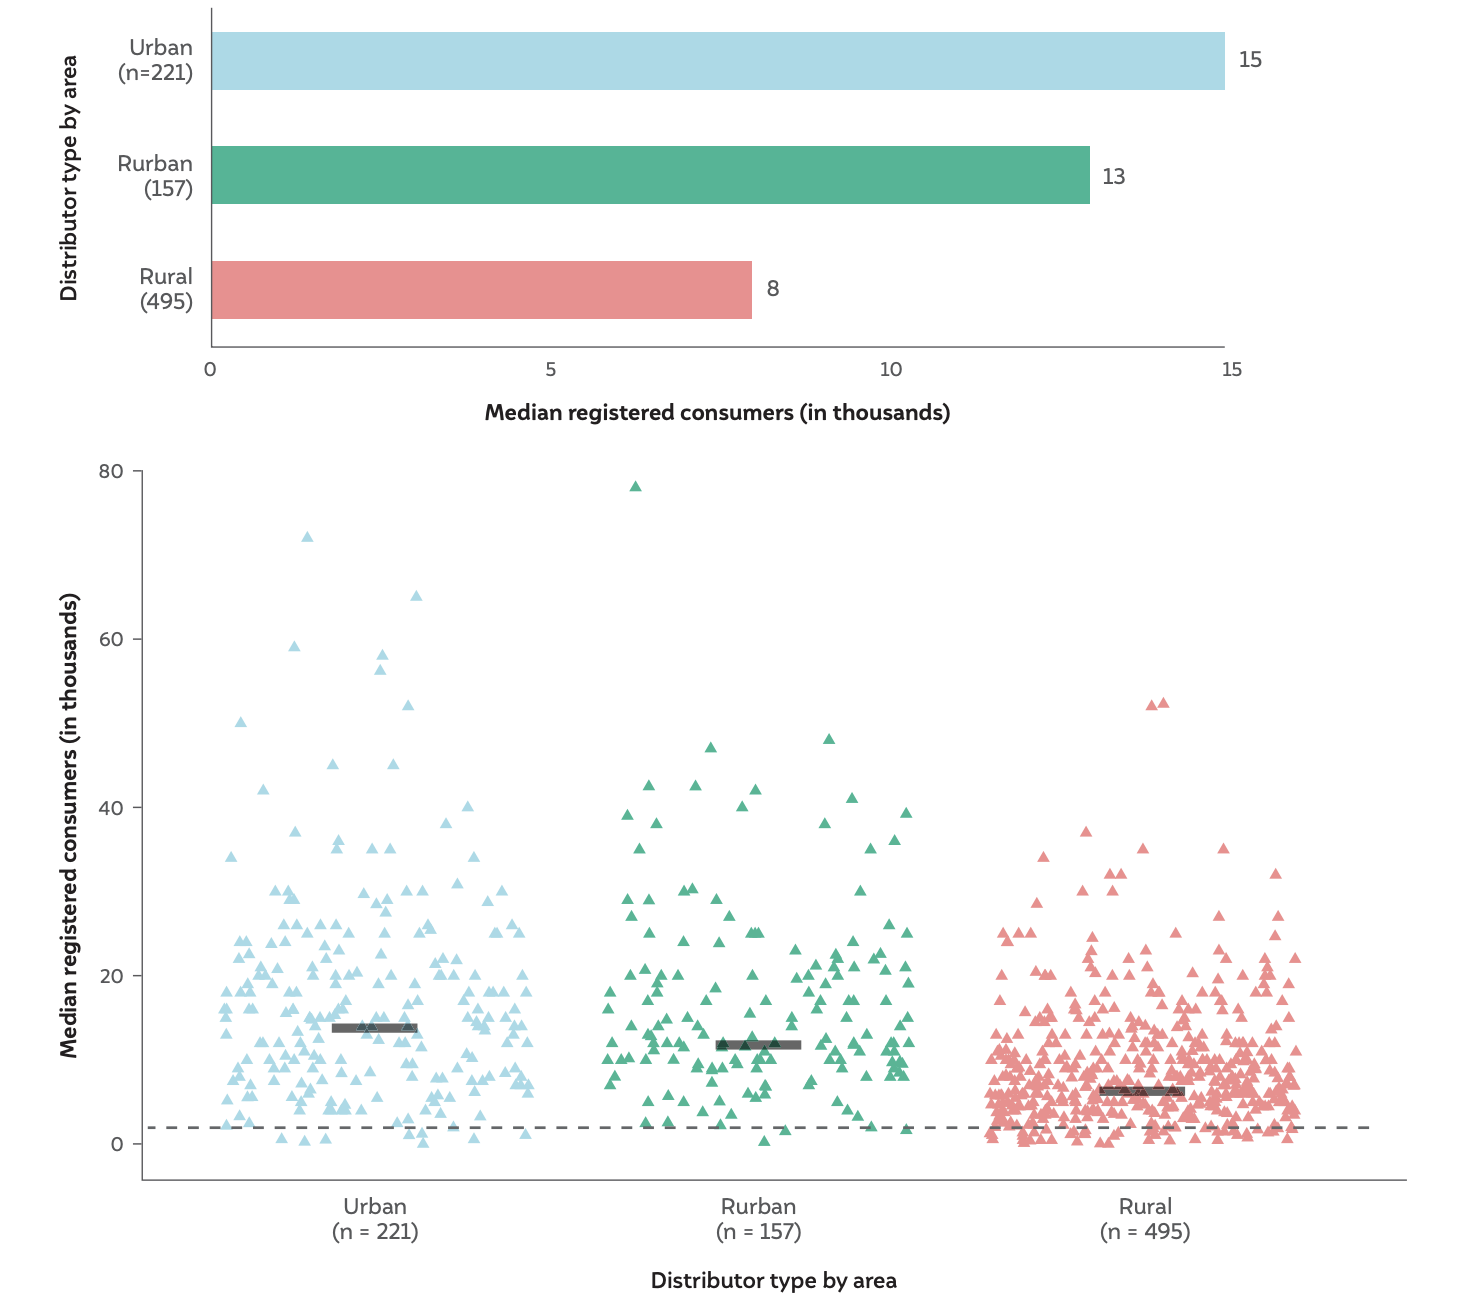
It was found that rural distributors have a median number of 8,000 consumers, which is significantly lower compared to urban and rurban distributors (15,000 and 13,000 consumers, respectively).11 Figure 8 also illustrates that a majority of rural distributors have a consumer base that is concentrated below 10,000 (about 64 per cent), which is not the case with urban and rurban distributors. Further, it was found that 7 per cent of the surveyed distributors reported a consumer base of less than 2,000 consumers. Such a low consumer base is bound to affect the viability of these distributors.
Figure 6 75% of surveyed LPG distributors were in business for more than five years
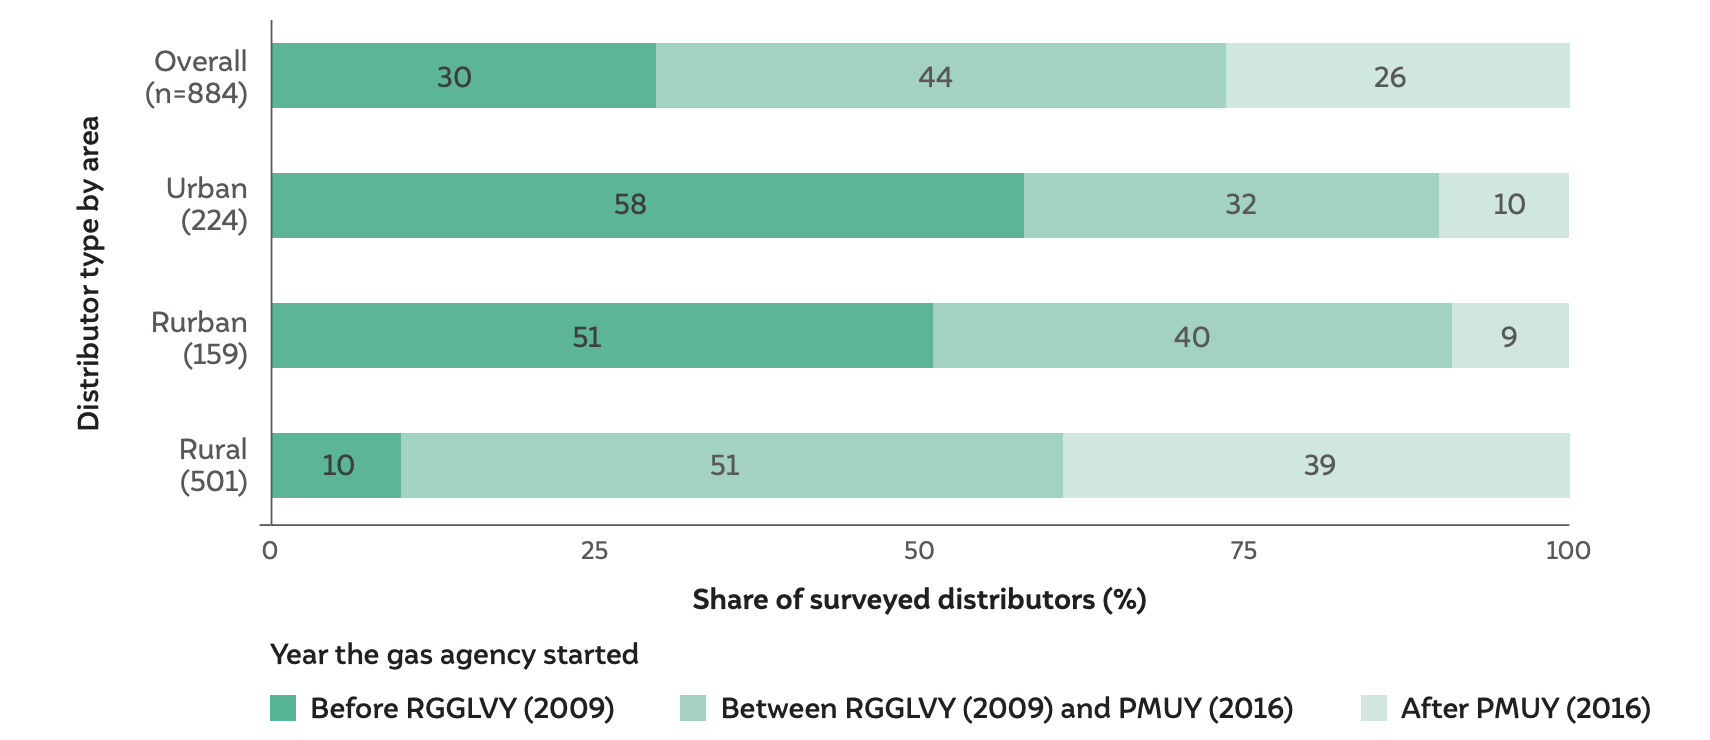
Source: Authors’ analysis
Figure 7 More than three-fourths of the surveyed agencies were self-managed or managed by relatives
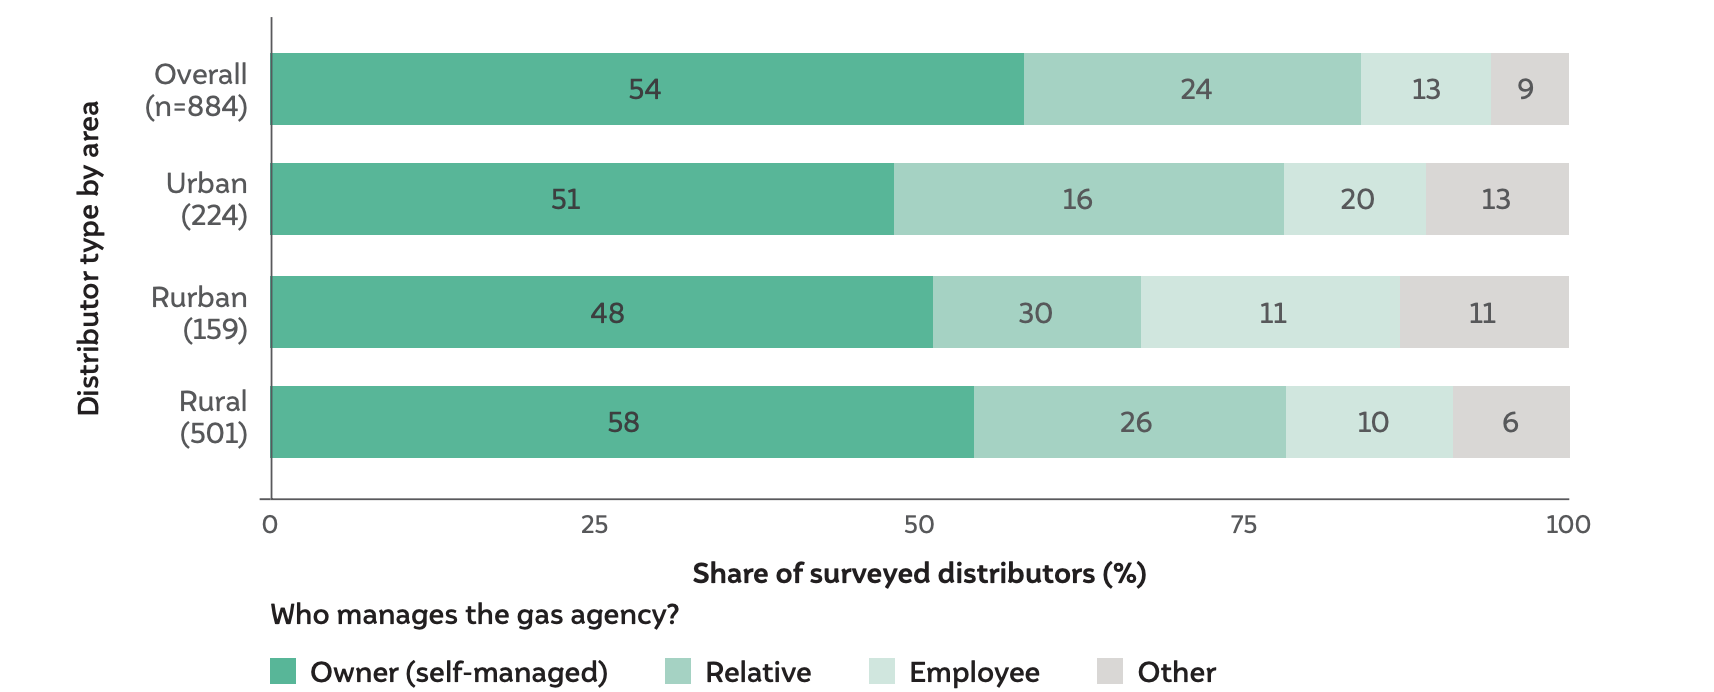
Source: Authors’ analysis
Figure 8 Rural distributors have a significantly lower consumer base as compared to urban and rurban distributors
Source: Authors’ analysis
 Source: Authors’ analysis
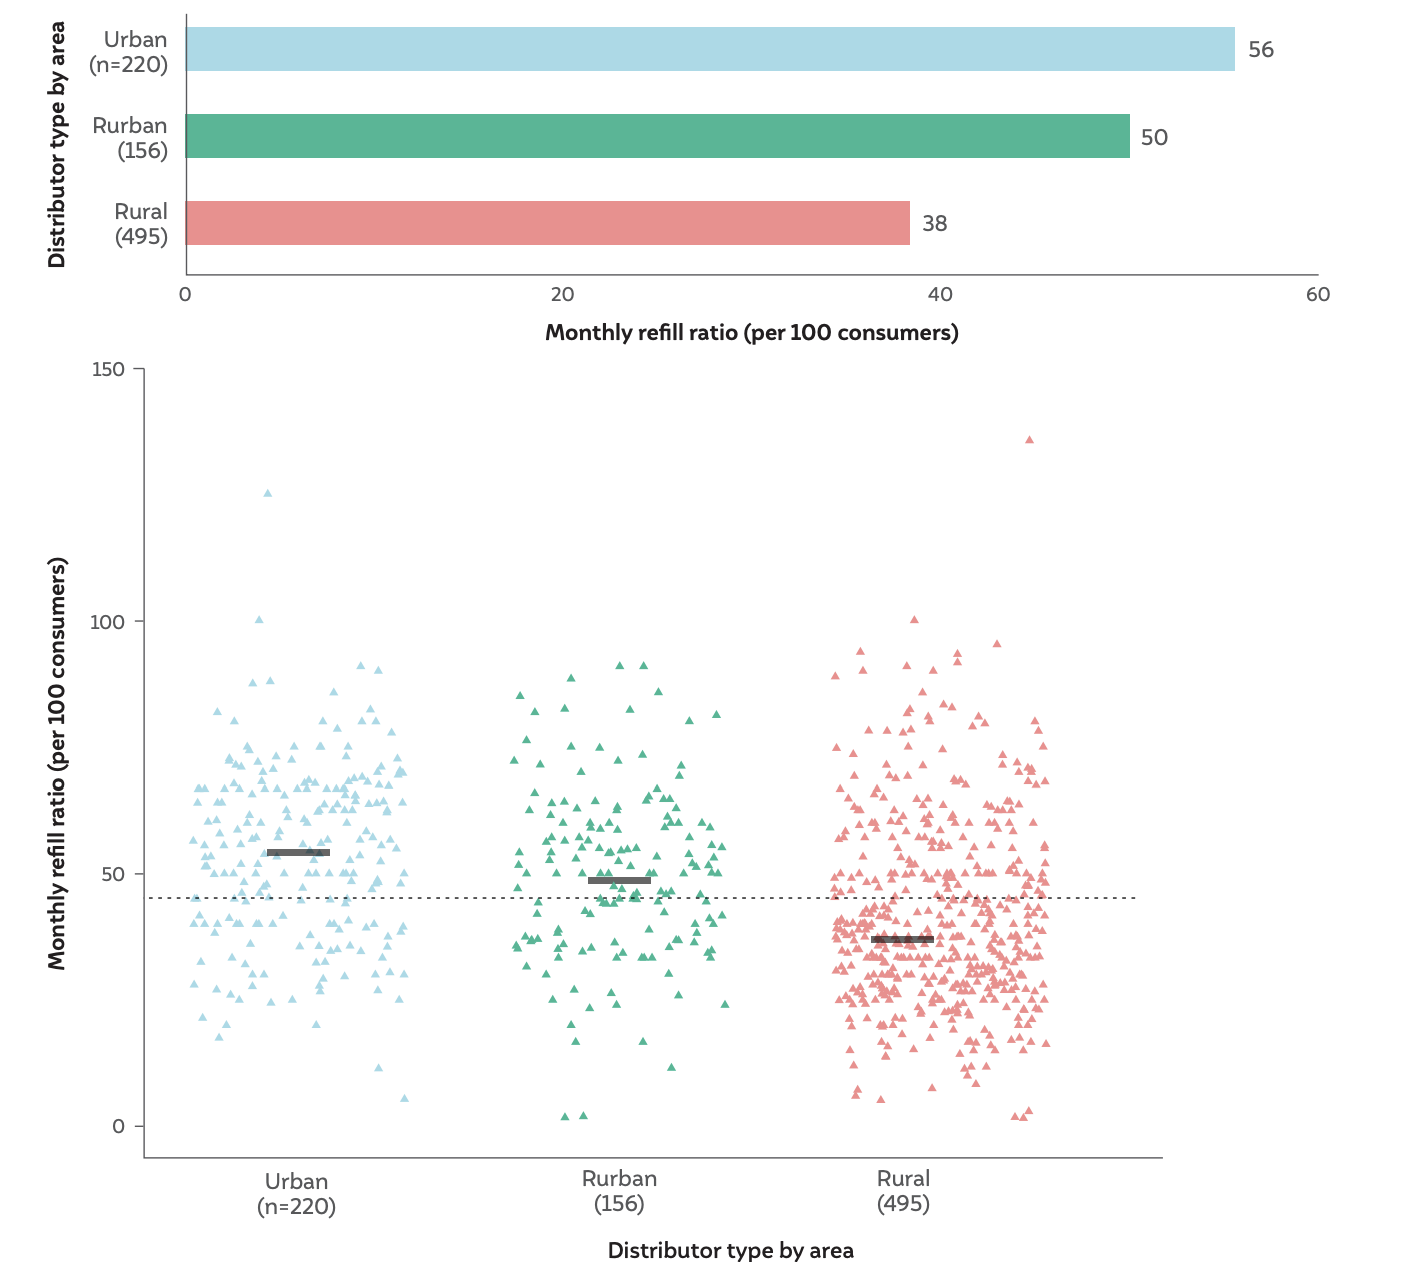
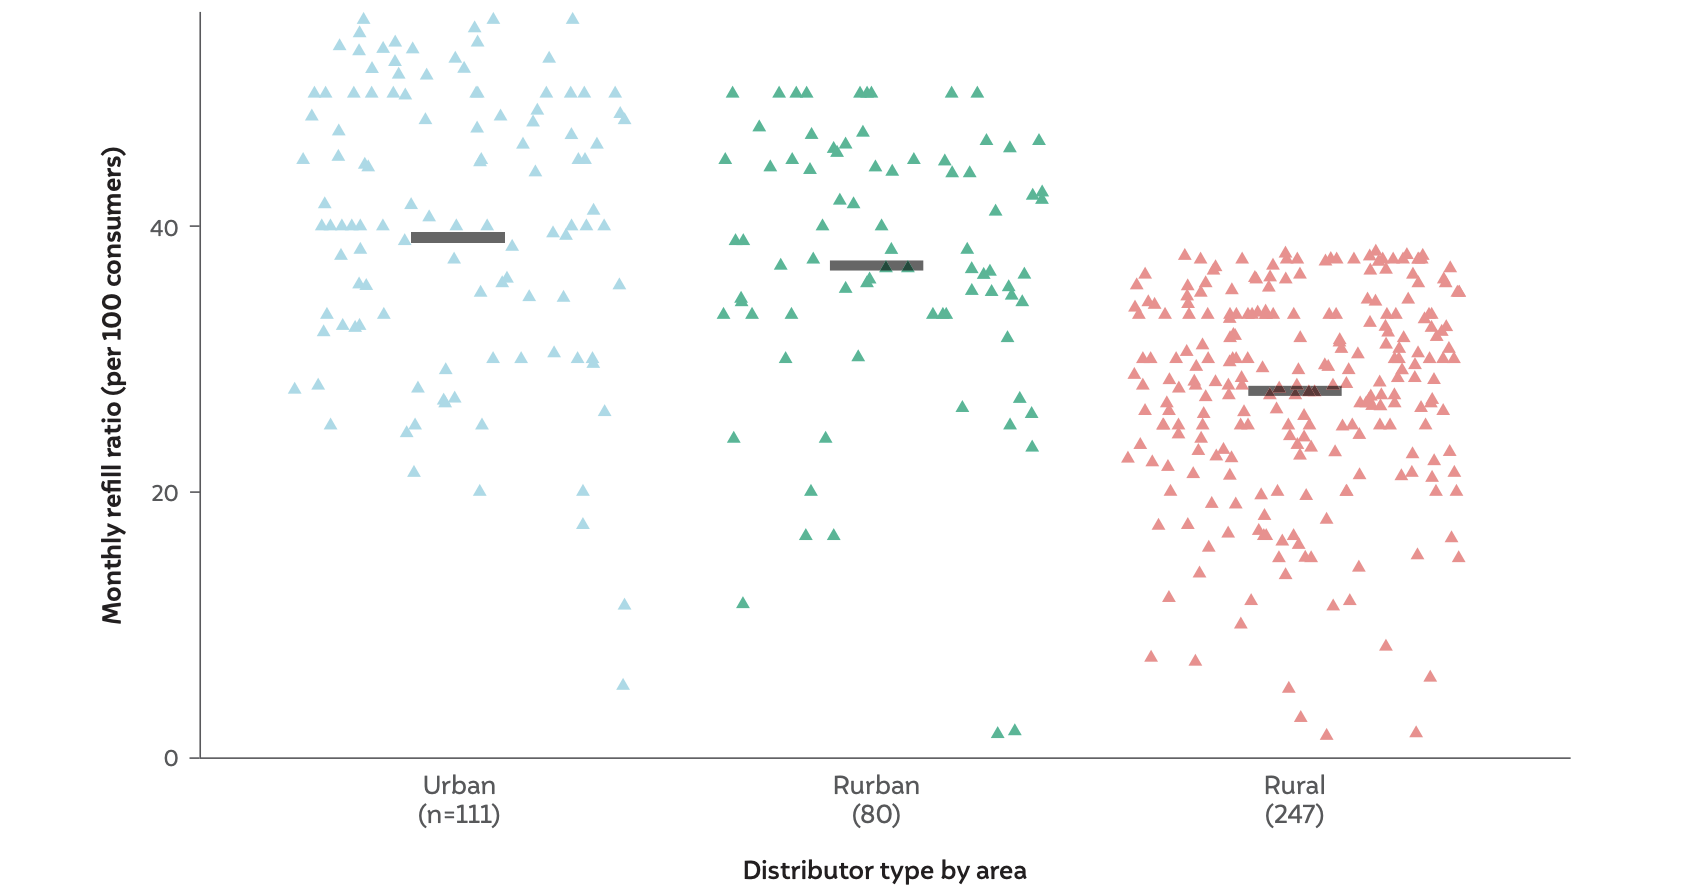
In addition to a lower consumer base, it was also found that rural distributors reported a median monthly refill ratio of 38 refills per 100 consumers, which is lower than the urban and rurban distributors (Figure 10A). This translates to a median of three refills consumed annually per connection for rural consumers, as reported by distributors.13 While a review of the data indicates a variance across distributor types for monthly refill ratios, there was no statistically significant difference (that is, the p-value was found to be >0.05) across distributor types (Figure 10A).
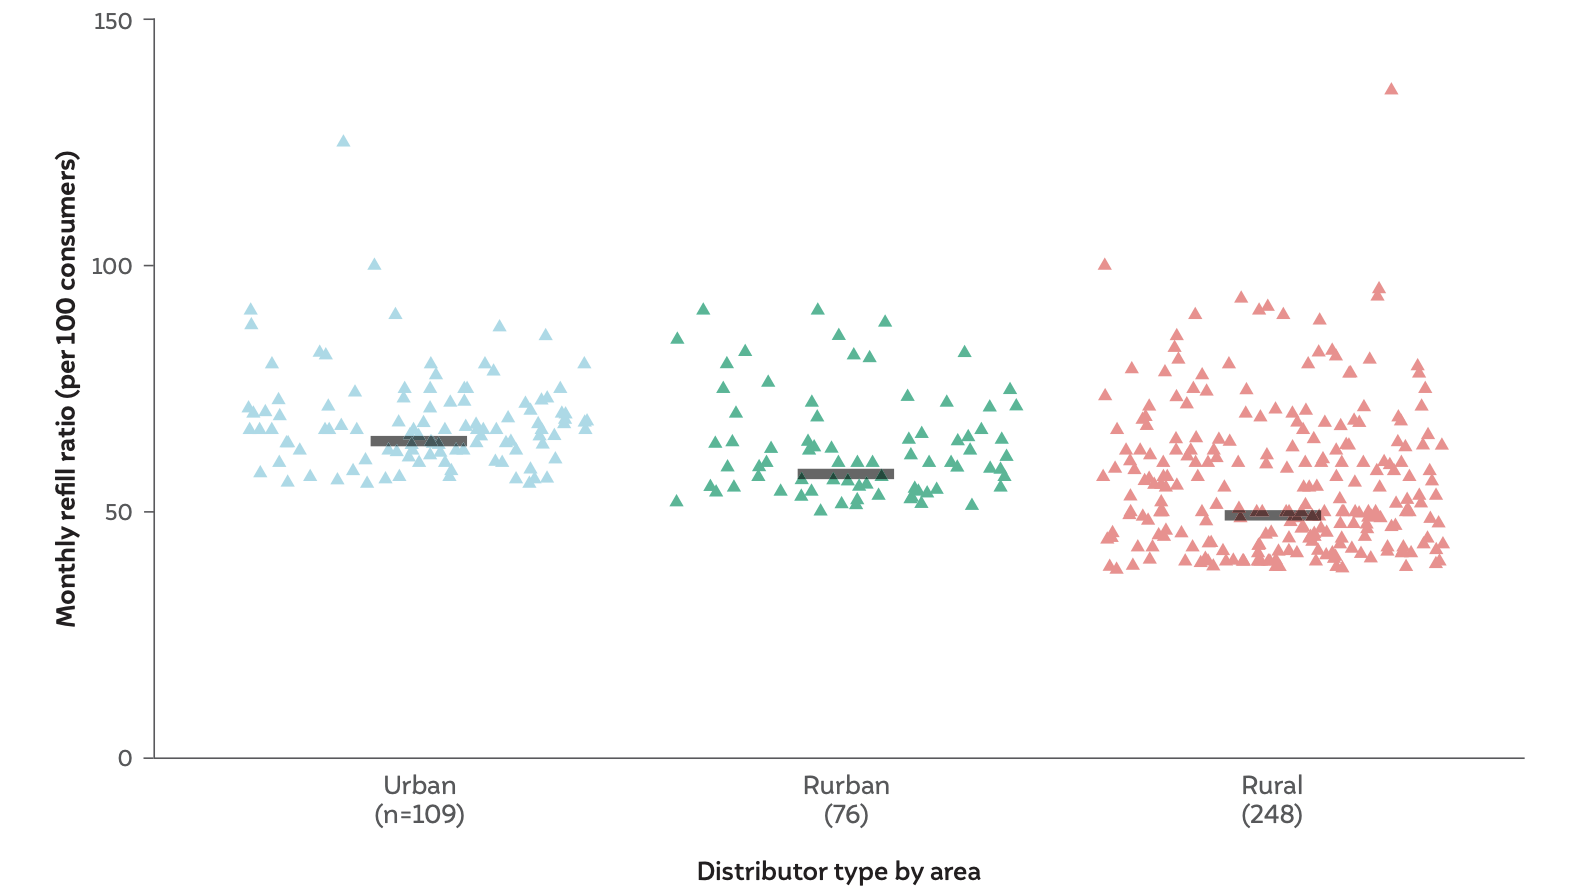
Additionally, no statistically significant difference was found in the monthly refill ratio per 100 consumers for the top performers across distributor types (defined as the top half of the monthly refill ratio per 100 consumers for each distributor type) (Figure 10B). However, when comparing the low performers (bottom half of the monthly refill ratio per 100 consumers for each distributor type), it was found that the average monthly refill ratio for rural distributors was significantly lower than that of urban and rurban distributors (Figure 10C). It is likely that some rural distributors are performing better than their peers, which reduced the overall differences in monthly refill ratio per 100 consumers between the distributor types. Hence, low performers were focused on for this indicator. The higher share of PMUY consumers is likely to be an important driver for this gap between low performers in urban and rural distributors (refer to Annexure 3 for additional analysis).
Figure 10 A Rural distributors have a lower monthly refill ratio than urban and rurban distributors
 Source: Authors’ analysis
Figure 10 B High-performing rural distributors do not have statistically significant lower monthly refill ratio when compared to high-performing urban and rurban distributors
 Source: Authors’ analysis
Notes: The thick horizontal black dash represents the median monthly refill ratio per 100 consumers. Two impossible values have been removed, and the y-axis has been truncated to 150 for visual clarity. This does not affect the calculation of medians.
Figure 10 C Low-performing rural distributors have a statistically significant lower monthly refill ratio when compared to low-performing urban and rurban distributors

Source: Authors’ analysis
Notes: The thick horizontal black dash represents the median monthly refill ratio per 100 consumers.
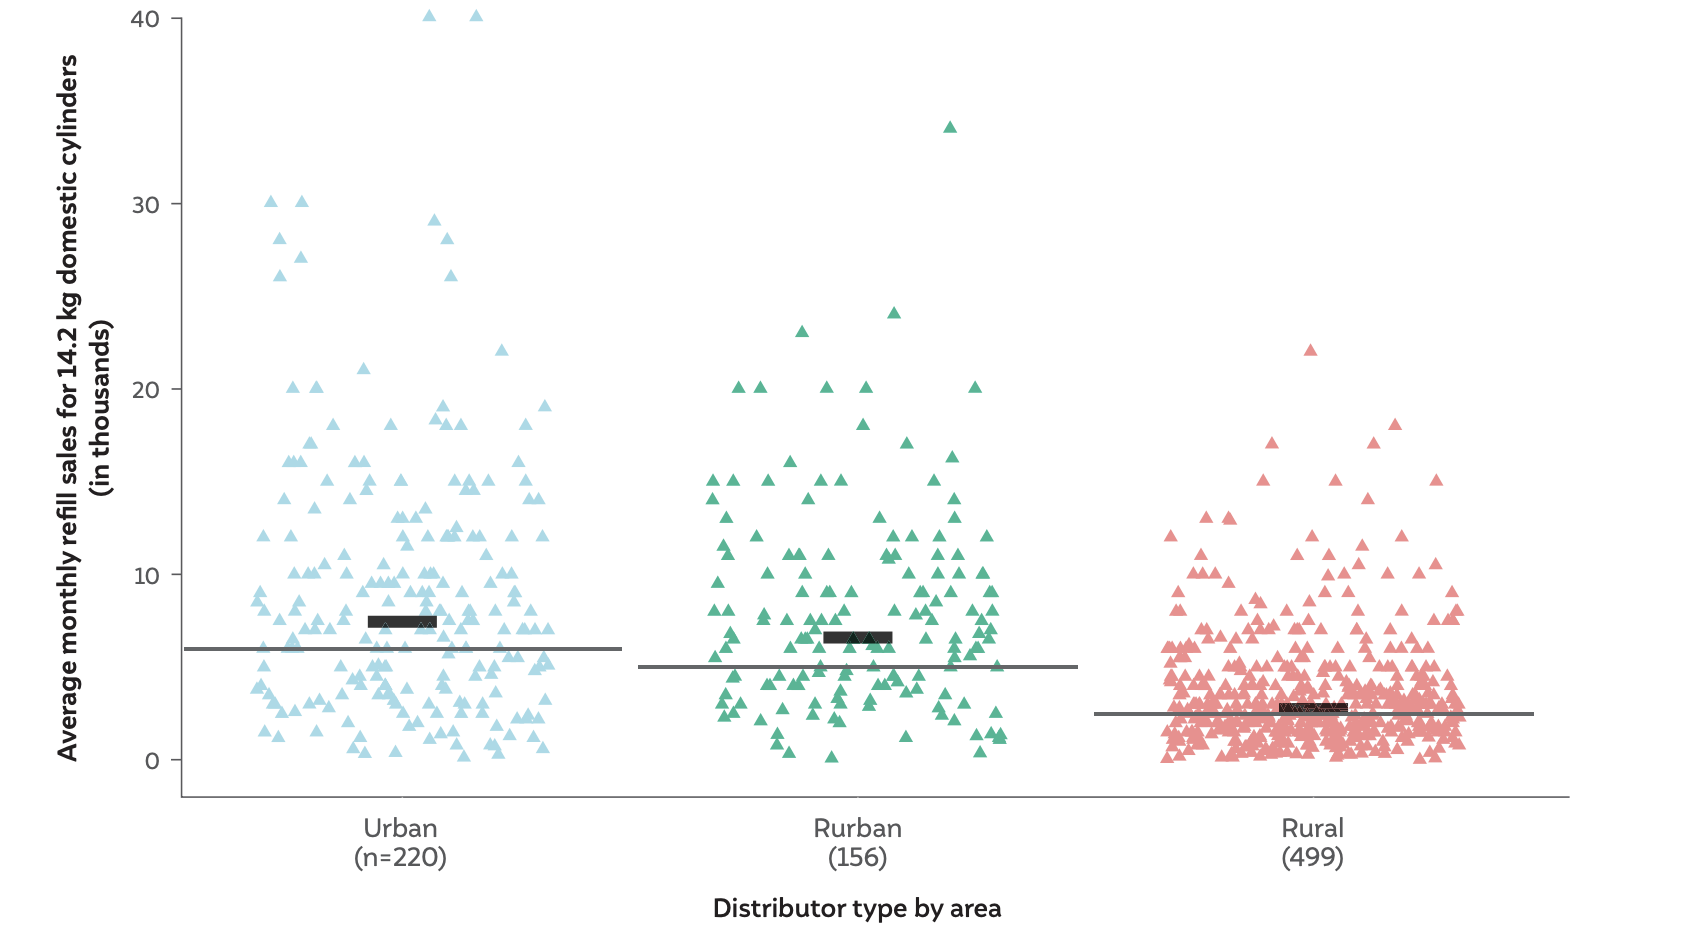
Furthermore, the MoPNG has established a monthly refill sales feasibility limit, which is described in the Unified Guidelines according to the minimum sales required for the viability of the different distributor types.16 The analysis reveals that 36 per cent of urban distributors, 33 per cent of rurban distributors, and 43 per cent of rural distributors reported refill sales below the feasibility limit, which is indicative of the lack of viability among a significant proportion of distributors across the country (Figure 11).
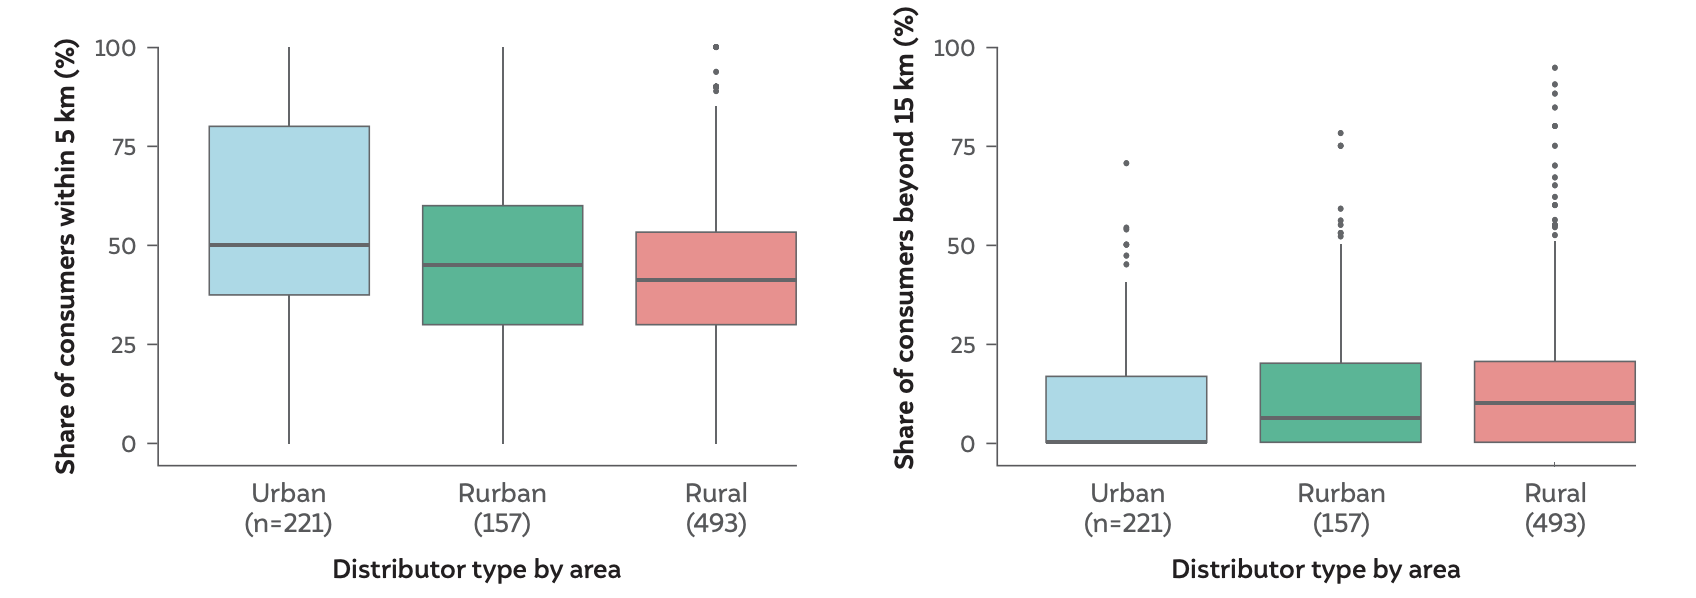
It was found that there exists a significant disparity in the distances between the distributors’ godowns and the consumers across different types of distributors. A majority of the urban distributors reported having their consumer base located within a delivery distance of 15 km. However, for half of the rural distributors, at least 10 per cent of their consumer base lives beyond 15 km (Figure 12).17 This implies that rural distributors need to travel longer distances to ensure 100 per cent home delivery of refills for their consumers, which can have significant cost implications. Thus, a lower consumer base, lower monthly refill ratio, and higher travel distances (and hence, potentially higher travel costs) could concurrently disincentivise rural distributors from providing home deliveries without any additional financial incentives.
Figure 11 A large share of distributors’ monthly refill sales fall under the feasibility limit for viability
 Source: Authors’ analysis
Notes: The thin horizontal black line represents the monthly refill sales feasibility limit for each distributor type by area, and the thick horizontal black dash represents the median monthly refill sales for each distributor type by area. 9 entries were removed for this analysis because 9 distributors had responded, ‘I don’t want to respond’ to the question on monthly refill sales.
Figure 12 Distributors in rural areas need to travel longer distances from their godowns to consumers to ensure 100 per cent home delivery
 Source: Authors’ analysis
Notes: In both panels, the thin horizontal line inside the boxplot represents the median share of consumers within 5 km/beyond 15 km for each distributor type by area. In both panels, 13 entries were removed for this analysis because 1 distributor had responded ‘I don’t know’ for the question on the spread of consumers, and 12 ‘NA’ values have been removed.
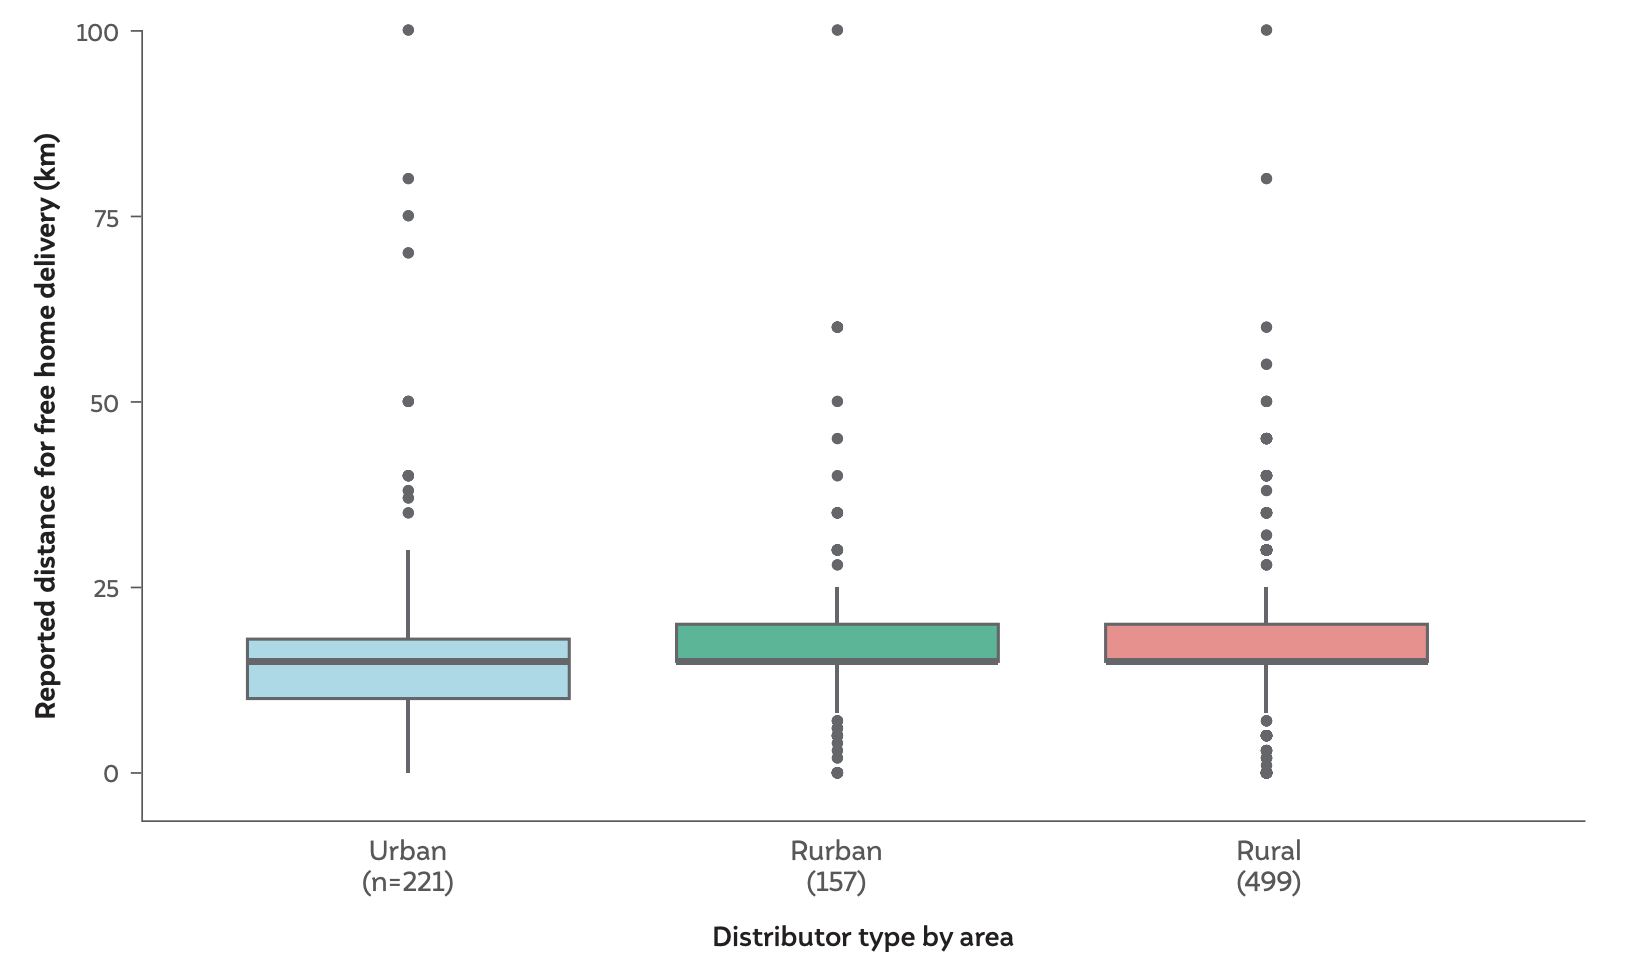
All LPG distributors in India earn a flat commission of INR 73.08 for providing home delivery of a 14.2 kg domestic cylinder, comprising two components – an establishment charge of INR 39.65 and a home delivery charge of INR 33.43 (Baruah 2023). The Unified Guidelines emphasise that, in general (barring durgam distributors), the distributors’ area of operation must cover all villages within a 15 km radius and have adequate infrastructure to provide home delivery services (MoPNG 2023: 3, 8). In some special cases, distributors have the flexibility to charge extra for home delivery based on their market size and terrain, subject to approval by their local OMC office and districtlevel committee. The data confirmed that all types of distributors had a median value of 15 km for free home delivery Among those offering home delivery at no additional cost within a 15 km radius, a difference in the proportion of distributors was observed - 86 per cent urban, 84 per cent rurban, and 81 per cent rural. It is likely that the percentage of urban distributors is higher than rural distributors due to the higher population (consumer) density in their jurisdiction (Figure 13). It was also observed that a notable share of distributors reported charging extra for home delivery, even within 15 km (12 per cent of urban, 13 per cent of rurban, and 16 per cent of rural). In addition to this, significantly shorter distances for free home delivery were reported across states by relatives (of the primary licensee) and employees compared to those reported by the owners of the agencies.18 This potentially suggests the existence of survey bias in our data and has been discussed in Annexure 2.
Figure 13 Approximately one-fourth of all distributors do not report providing free home delivery up to 15 km
 Source: Authors’ analysis
Note: The thick horizontal black dash represents the median reported distance for free home delivery for each distributor type by area. 7 entries were removed for this analysis because 7 distributors had responded, ‘I don’t want to respond’ to the question on distance for free home delivery.
Within distributors offering home delivery (whether free or at an extra cost), a downward trend was observed moving from urban to rural areas. Figure 14 illustrates that the share of consumers receiving home delivery is significantly lower for rural distributors compared to urban distributors.19 For instance, 72 per cent of urban distributors report providing home delivery to more than 90 per cent of their consumers. However, only 52 per cent of rural distributors report providing home delivery to more than 90 per cent of their consumers. Additionally, our analysis revealed that the share of distributors not providing home delivery to half their consumers is much higher among rural distributors (10 per cent vs 5 per cent each for urban and rurban distributors). This is because of the reported low consumer density for rural distributors, as highlighted previously in this chapter.
Keeping in mind the differences in consumer bases, consumer spread, and percentage of home deliveries reported, distributors were asked whether an additional commission would incentivise them to service consumers who are spread unevenly or further away. Half of the distributors in the sample reported that they would need INR 30 or less in extra commissions, over and above the INR 64.84 commission (at the time of survey administration) (Figure 15). Distributors also reported that the increased commission could lead to 100 per cent home delivery, and they perceive an increase in their annual refill sales by an average of 16 per cent. While the increase in commission by INR 8 (~13 per cent) in October 2023 is a positive step, it could be further tailored to address the diverse needs of different distributor types.
Figure 14 The reported share of consumers that are provided home delivery varies significantly across different area types
Source: Authors’ analysis
Note: 10 entries were removed for this analysis because 10 responses for the share of consumers receiving home delivery were missing. Median values for the share of consumers provided with home delivery are 100 per cent for urban distributors and 95 per cent for rurban and rural distributors, whereas average values for the share of consumers provided with home delivery are 95 per cent for urban distributors, 88 per cent for rurban, and 84 for rural distributors.
Figure 15 Providing additional commission will incentivise the distributors to provide 100 per cent home delivery which could lead to an increase in refill sales
Source: Authors’ analysis
Note: In the left panel, 158 entries were removed for this analysis because 47 distributors had responded ‘I don’t want to respond’ and 13 had responded ‘I don’t know’ for the question on extra commission needed to ensure 100 per cent home delivery. There were 98 missing responses. In the right panel, the thick horizontal black dash represents the median reported increase in sales if 100 per cent home delivery is achieved for each distributor type by area. In the right panel, 183 entries were removed for this analysis because 20 distributors had responded ‘I don’t want to respond’ and 6 distributors had responded ‘I don’t know’ for the question on the increase in sales if 100 per cent home delivery was achieved. There were 157 missing responses to the question on the increase in sales if 100 per cent home delivery is achieved.
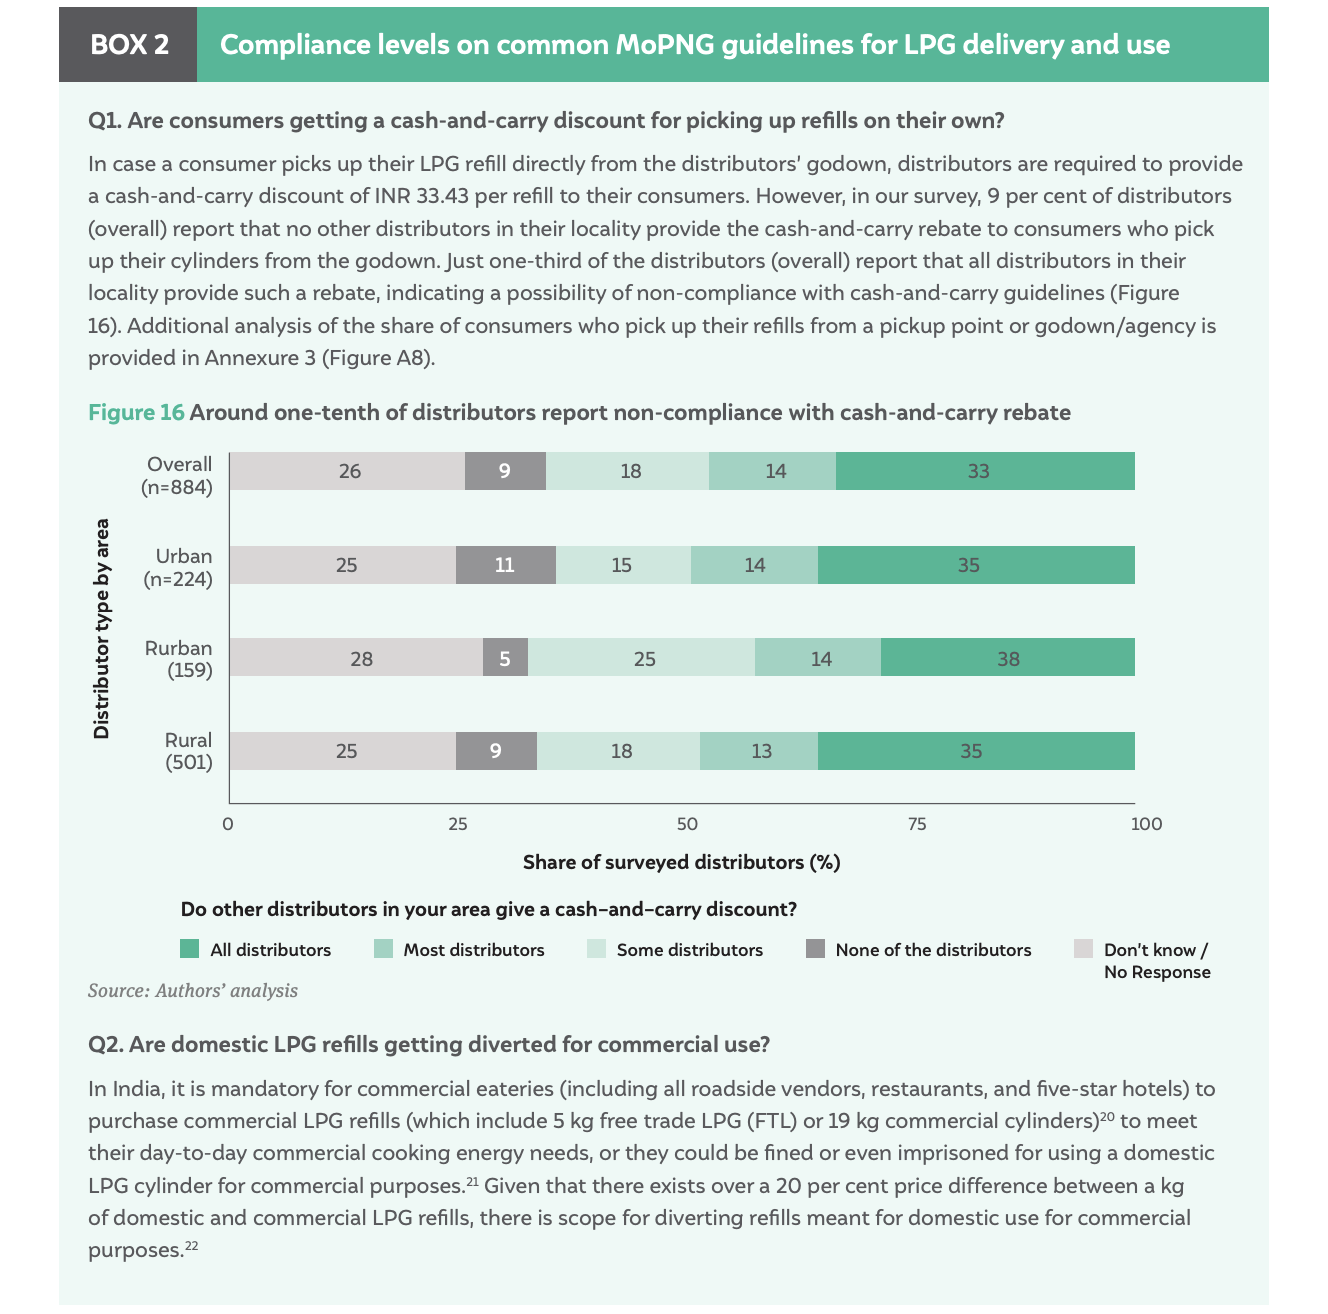
The survey also assessed compliance levels as stipulated by the MoPNG regarding guidelines for cash-and-carry discounts for consumer pickup of refills. Additionally, the survey also captured perceived rates of domestic LPG cylinder diversion for commercial use (Box 2).
 Source: Authors’ analysis
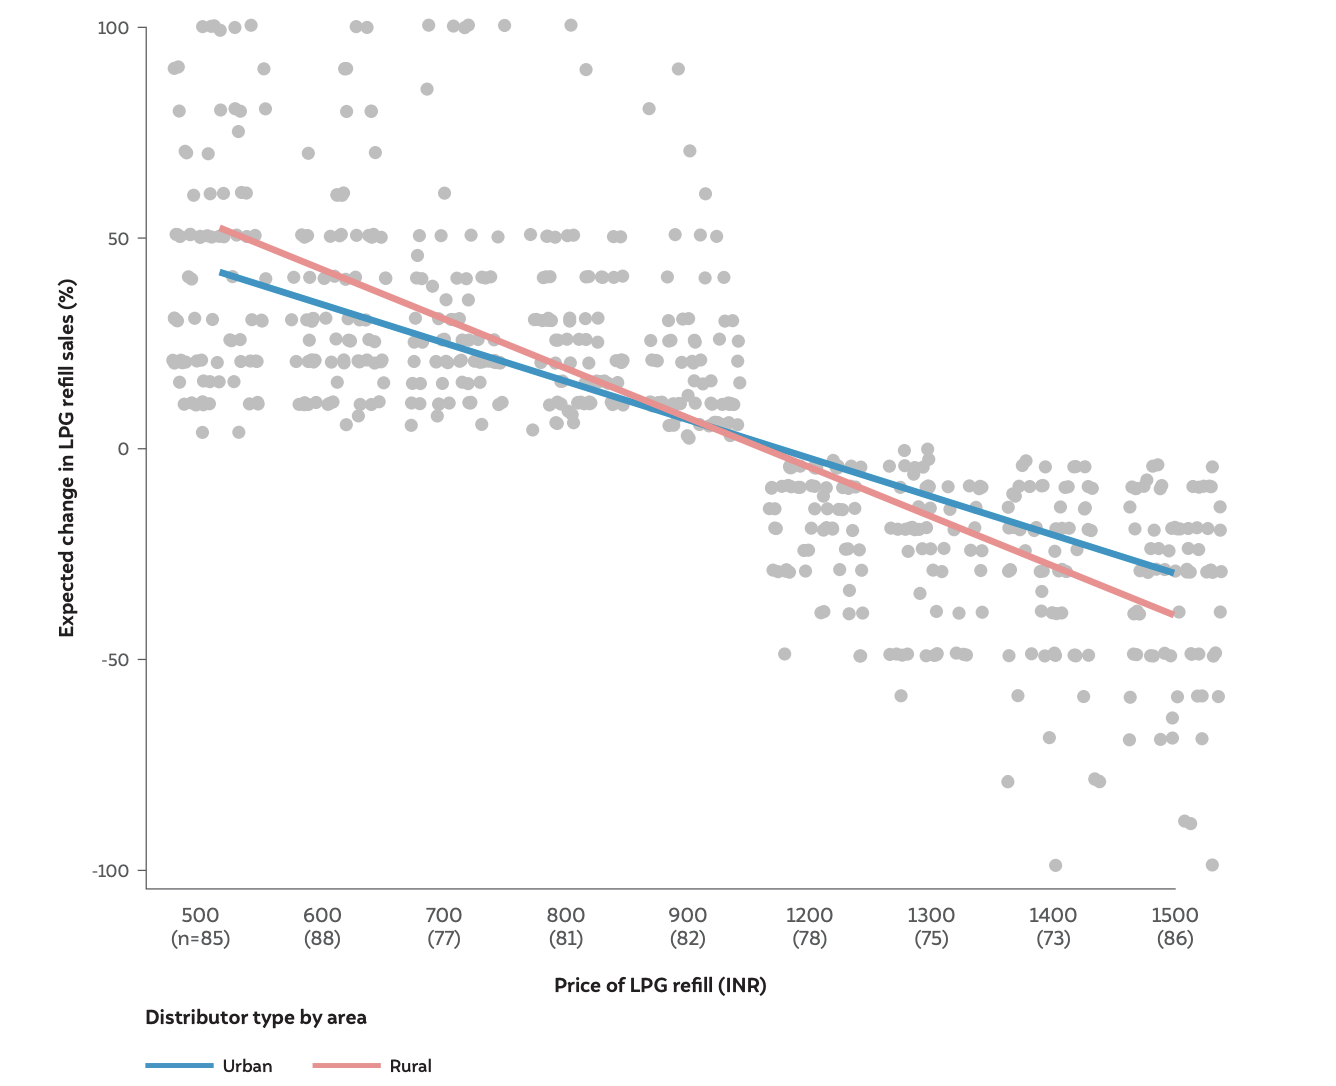
Over the past two and a half years, LPG refill prices for domestic consumers have increased from INR 580 in November 2020 to ~INR 1,100 as of March 2023,24 making it increasingly unaffordable for a significant proportion of the population, especially for households with low income. However, India imported ~57 per cent of the LPG consumed in the country in 2023-24 (Petroleum Planning & Analysis Cell 2024), which causes fluctuations in the domestic price of LPG refills. In the survey, one (out of nine) randomly generated hypothetical value for domestic (14.2 kg) LPG refill price (retail selling price) was provided to each surveyed LPG distributor, which could either indicate a decrease (INR 500, INR 600, INR 700, INR 800, and INR 900) or an increase (INR 1,200, INR 1,300, INR 1,400, and INR 1,500) in LPG refill prices from the base level price of INR 1,100 (at time of survey administration), and recorded the distributors’ expected increase or decrease (whichever is applicable) in refill sales. The analysis revealed that urban distributors expect an incremental change in LPG refill sales or that their consumers have relatively inelastic demand, whereas rural distributors expect a much larger change (Figure 18). This could be because rural distributors are aware of the presence of cheaper alternatives for rural consumers, as compared to a quasithere-is-no-alternative scenario for urban consumers (e.g., piped natural gas, electric induction).
There exist differences between the different types of distributors in terms of their consumer base, monthly refill ratio and distances travelled by them to provide free home delivery. For instance, rural distributors report facing the triple blow of a low and sparse consumer base, low monthly refill ratios (due to a higher share of PMUY consumers), and longer distances required to travel for the delivery of LPG refills. Variations in these factors may significantly influence the operating expenses for different types of distribution agencies; therefore, providing a flat commission of INR 73.08 per refill delivery to all types of distributors may not be the optimal solution (as it may make 100 per cent home delivery unviable for some). The analysis also indicates the possibility of non-compliance from the distributors’ side on delivery guidelines.
Figure 18 There is a varied effect of LPG price on expected changes in refill sales for distributors
Source: Authors’ analysis
Note: The analysis above was not carried out for each state as the sample size for each randomly generated hypothetical price level was significantly smaller (n < 30, in most cases) for each type of distributor.
In this chapter, distributors’ perception of the impact of 100 per cent home delivery versus a reduction in LPG refill prices on LPG refill sales is analysed. The influence of different factors at the LPG distributor level (consumer spread, monthly refill ratio, and distances travelled to provide home delivery) on operational expenditure is explored, along with support measures that can make the overall operations more efficient.
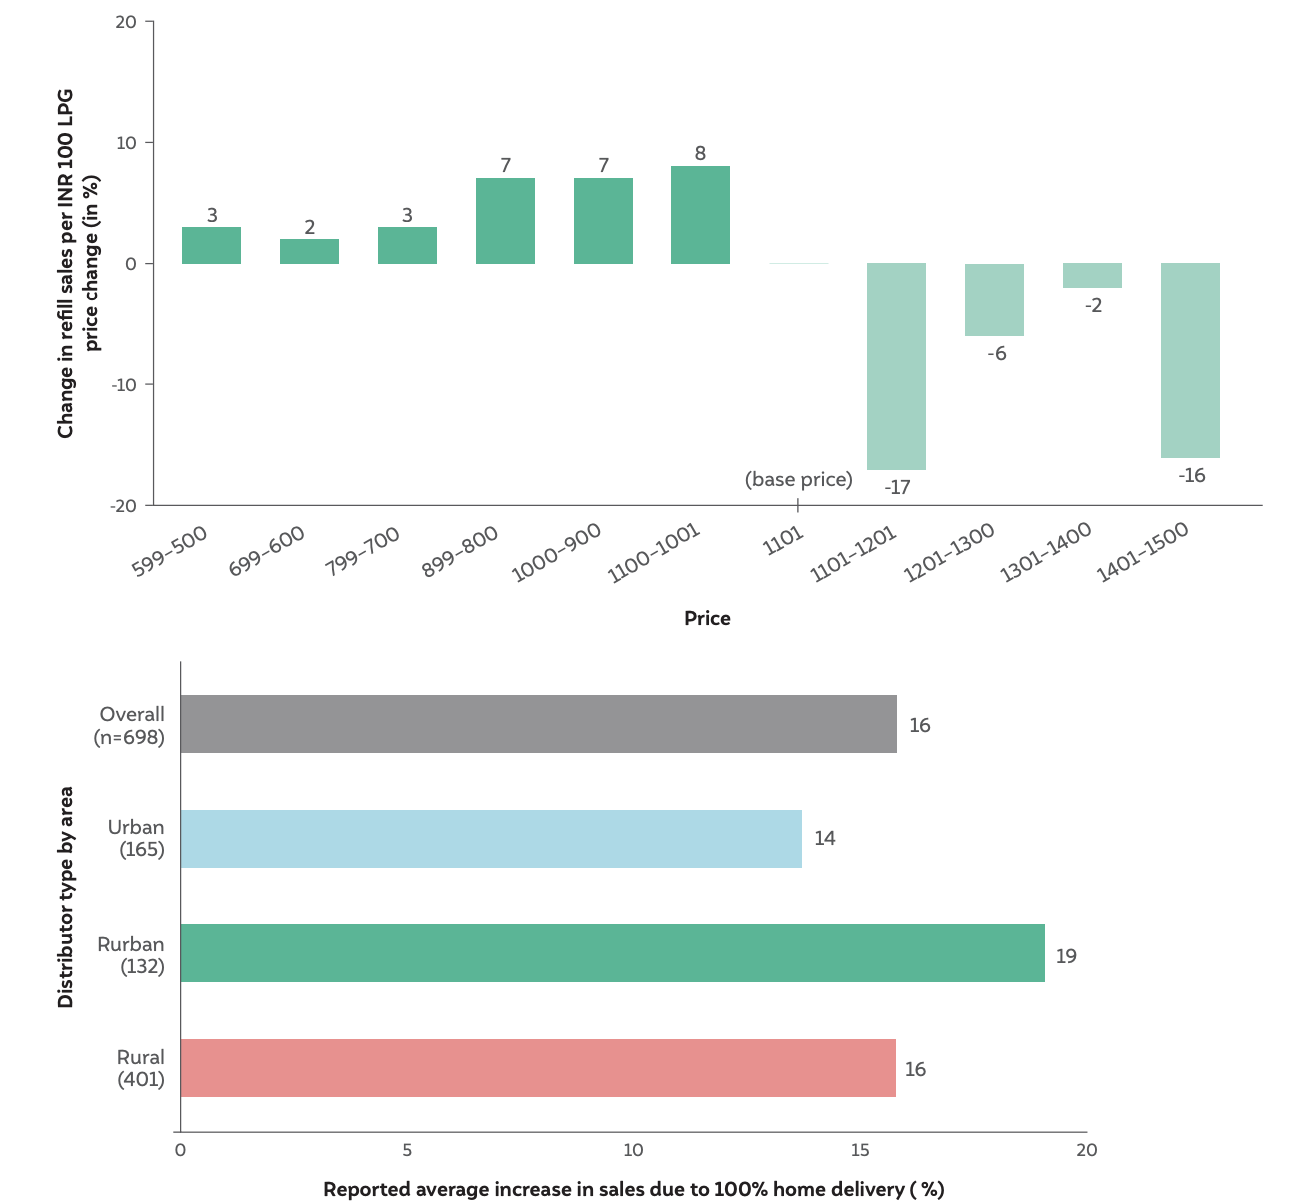
As established in Chapter 3, LPG consumption is strongly linked to the prices of LPG refills (Figure 18) and its home delivery to consumers (Figure 15). Therefore, the surveyed distributors were asked about the expected impact of change in domestic LPG prices and 100 per cent home delivery on their refill sales. However, since the values of expected changes in refill sales (concerning change in refill prices) are across various price points (with INR 1,100 as the base price), the overall cumulative change in refill sales was first converted to an incremental change per INR 100 change in LPG refill prices.25 Figure 19 shows the distributors’ perceptions of the percentage change in refill sales for every INR 100 price change with different base prices (in both directions) and due to improvement in home delivery (to 100 per cent).
It was found that, at different price levels, a change of INR 100 in the price of domestic LPG refills could have a differential impact on distributors’ sales (Figure 19, top panel). For instance, if the price of LPG refills decreases from INR 1,100 to INR 1,000, the LPG refill sales are expected to increase by 8 per cent on average (which is also the maximum expected average increase in sales for any INR 100 reduction in domestic LPG refill price). On the contrary, an increase of INR 100 in the price of the domestic LPG refill (at a base price of INR 1,100) would reduce refill sales by about 2 per cent on average which is also the minimum expected average decrease in sales for any INR 100 increase in domestic refill price). However, approximately 9 per cent of the distributors (the majority of whom were urban and rurban distributors) indicated that there would be no change in refill sales with a decrease or increase in LPG refill prices (indicating an assumption of inelastic demand for some non-rural distributors).
Distributors were also of the perception that improvement in home delivery from the respective current levels to 100 per cent could increase refill sales by 16 per cent on average (Figure 19, lower panel). However, as discussed in Chapter 3 (Figure 15), in order to provide 100 per cent home delivery of LPG refills to their consumers, distributors across all regions expect an increase in refill delivery commissions (the median demand ranged from INR 25 for urban distributors to INR 30 for rural distributors). Approximately 90 per cent of the distributors in the sample reported that they would require INR 100 or less, in addition to the distributor commission of INR 64.84 (during the time of survey administration) per refill delivery, to provide 100 per cent home delivery to their consumers. Therefore, at the current price levels, ensuring 100 per cent home delivery through the provision of extra commission per refill delivery may be more impactful in terms of promoting LPG consumption in India compared to reducing the LPG refill prices. This can be further corroborated through a similar assessment (on the impact of LPG refill price reduction as compared to 100 per cent home delivery) of consumer perception. It is also important to highlight that just providing the required amount of extra commission to the LPG distributors may not always result in 100 per cent home delivery to the consumers; it will need to be accompanied by robust monitoring mechanisms, which will have their own additional cost implications.
Figure 19 Distributors perceive that 100% home delivery of LPG refills would be more impactful in increasing sales compared to changes in LPG price
 Source: Authors’ analysis
Notes: In the upper panel, 2 ‘I don’t want to respond’ and 9 ‘I don’t know’ values have been removed. In the lower panel, 9 blank values, 101 ‘I don’t want to answer‘, and 80 ‘I don’t know’ values have been removed. Weighted averages were used in both panels because different distributors have different reported values of refill sales to account for uniformity. In the upper panel, distributors were not categorized by distributor type by area as the sample size for each distributor type at each price point (INR 500-1,500) was not statistically significant (n<30) for any further analysis.
In order to better understand the financial viability of LPG distributors, they were asked to provide their annual expenditure and profit figures during the survey.
A typical LPG distributor reportedly spends a median of INR 12.5 lakh annually on their overall operations. Urban distributors spend a median of INR 20 lakh annually, which is 0.2 times lower than rurban distributors (INR 24.5 lakh annually) and 2 times higher than rural distributors (INR 10 lakh annually). There were also notable differences between the reported profit figures; while the median profit reported by urban distributors was INR 4.4 lakh, it was INR 3 lakh for rural distributors. It is also important to highlight that almost 40 per cent of the distributors in the survey chose not to respond to the questions on annual expenditure and profit. Nonresponses to certain questions provided in telephonic surveys are the most common form of survey response bias. The analysis revealed that the non-response rate for sensitive questions was much higher than for less-sensitive questions; therefore, the results may not be indicative of the ground reality. The interpretation of this high non-response rate as compared to other questions in the survey has been detailed in Annexure 2.
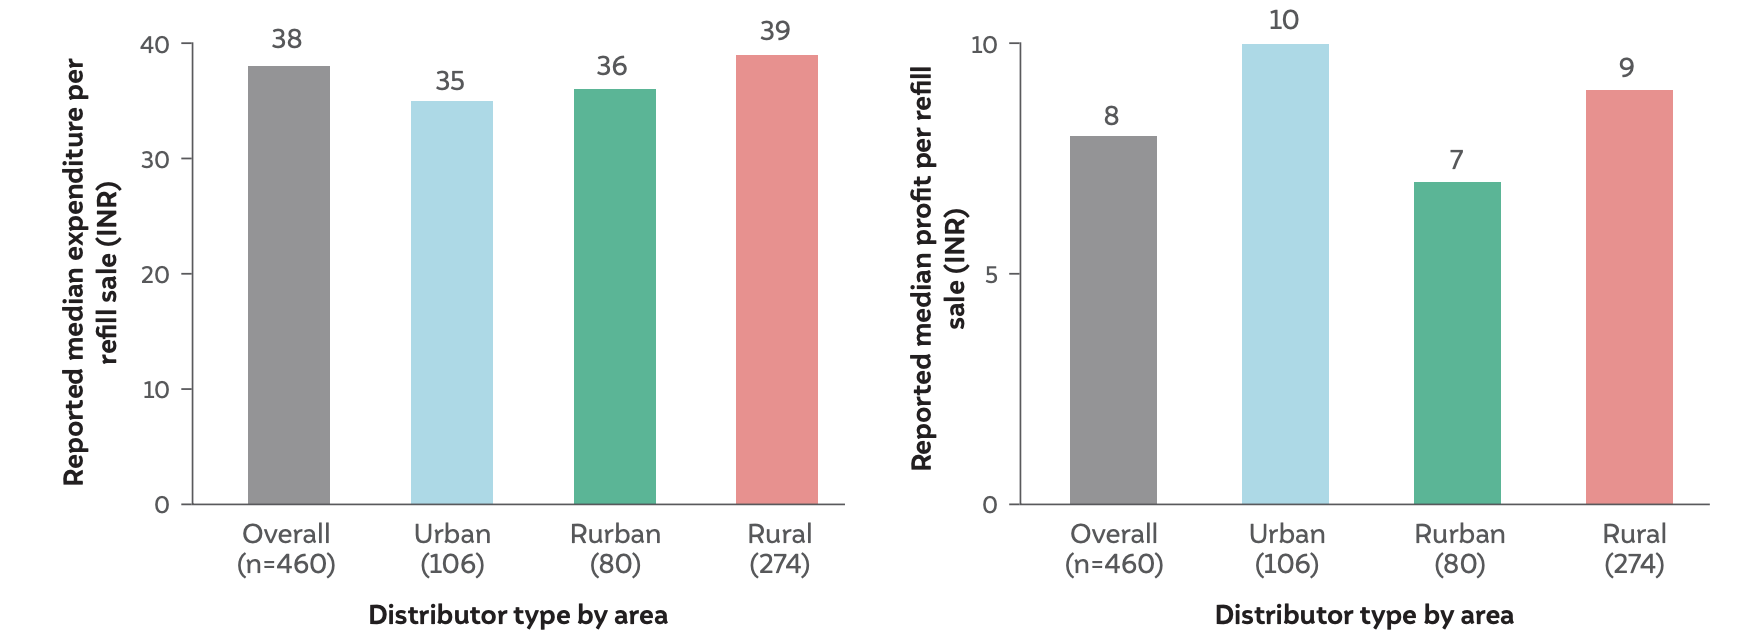
The distributors’ annual expenditure and profit were also divided by their annual refill sales to understand whether the commission received per refill sold (at a rate of INR 64.84) was sufficient to meet their reported expenditure. It was found that rural distributors report incurring ~10 per cent higher expenditure per refill sale (median INR 39 per refill sale) compared to their urban counterparts (median INR 35 per refill sale). This could be due to multiple reasons – such as lower refill sales per 100 consumers, longer distances of travel, and poor road infrastructure – some of which are also highlighted in Chapter 3. A measure that can be taken to address concerns over low refill sales is to improve the affordability of LPG refills for consumers via decentralised grassroots efforts, such as the SHG model, wherein SHGs, village-level entrepreneurs (VLEs) and other women entrepreneurs play the role of microdistributors/stockists/microfinanciers. This is elucidated in Chapter 5.
Further, based on the distributors’ responses, it was found that approximately 25 per cent of the rural distributors reported incurring expenses of more than INR 50 per refill, and 11 per cent of rural distributors reported incurring expenses of more than INR 80 per refill. In contrast, only 3 per cent of urban distributors incur expenses of more than INR 80 per refill. It was also found that the median self-reported profit per refill sale was higher for urban distributors (at INR 10 per refill sale) as compared to rurban and rural distributors (Figure 20).
Figure 20 Rural distributors report that they face the double burden of higher median expenditure and lower median profit per refill sale
 Source: Authors’ analysis
Notes: In both panels, 424 entries were removed from this analysis because 9 distributors had responded, ‘I don’t want to respond’, and there were 46 ‘zero’ and 369 ‘NA’ values.
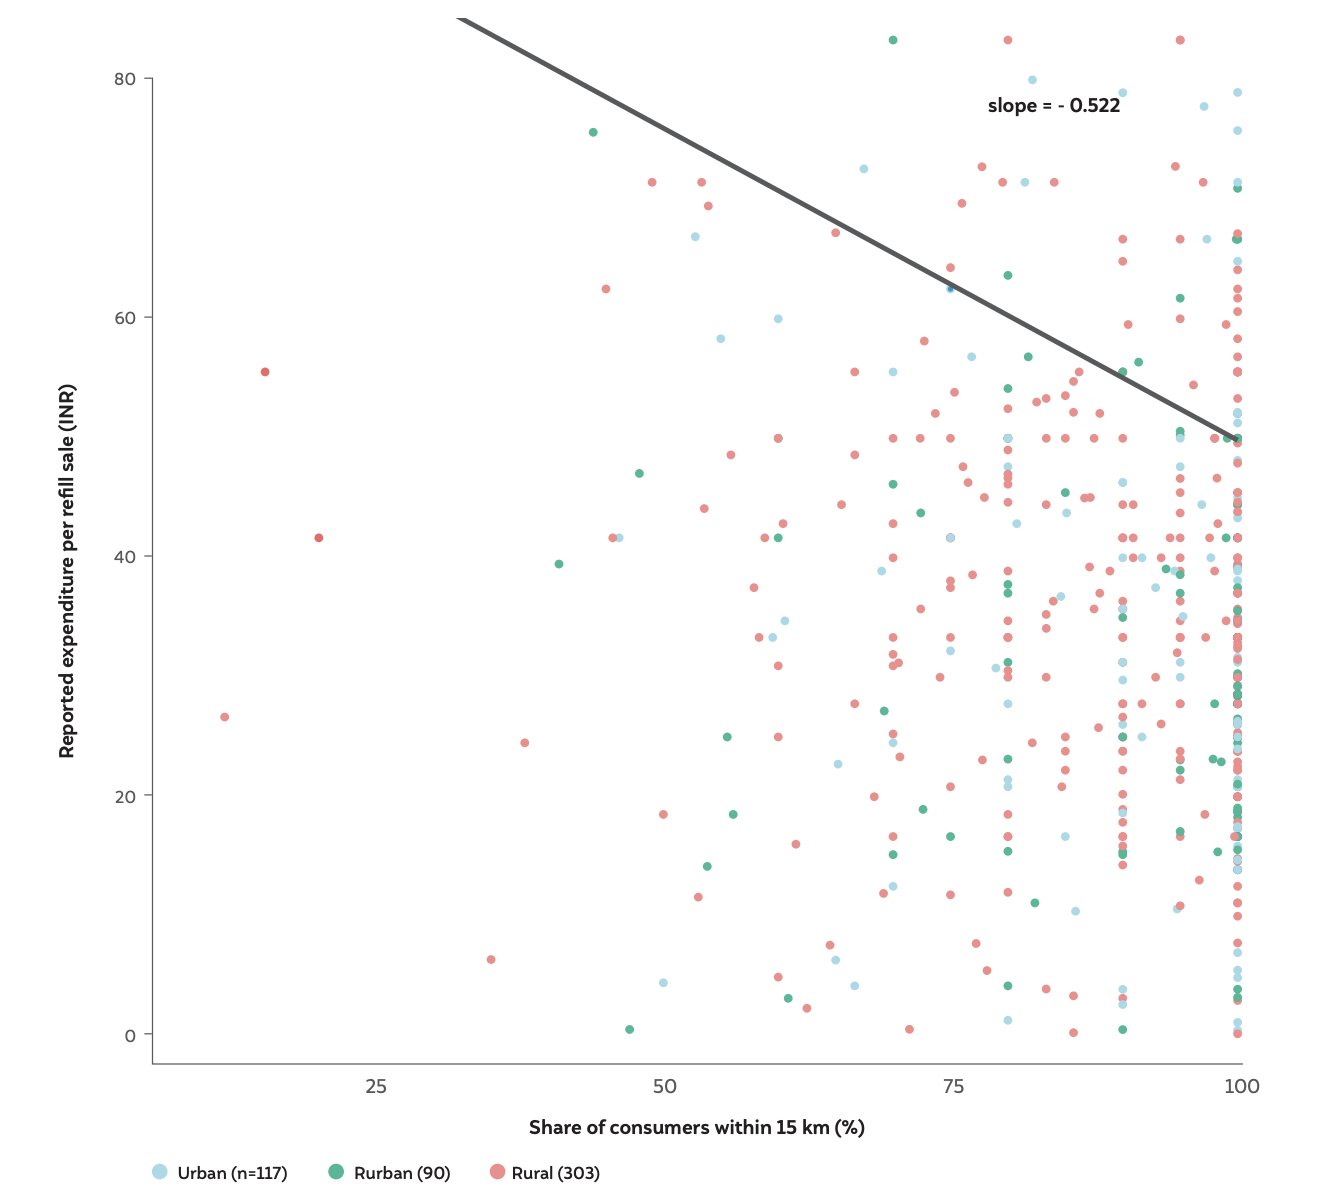
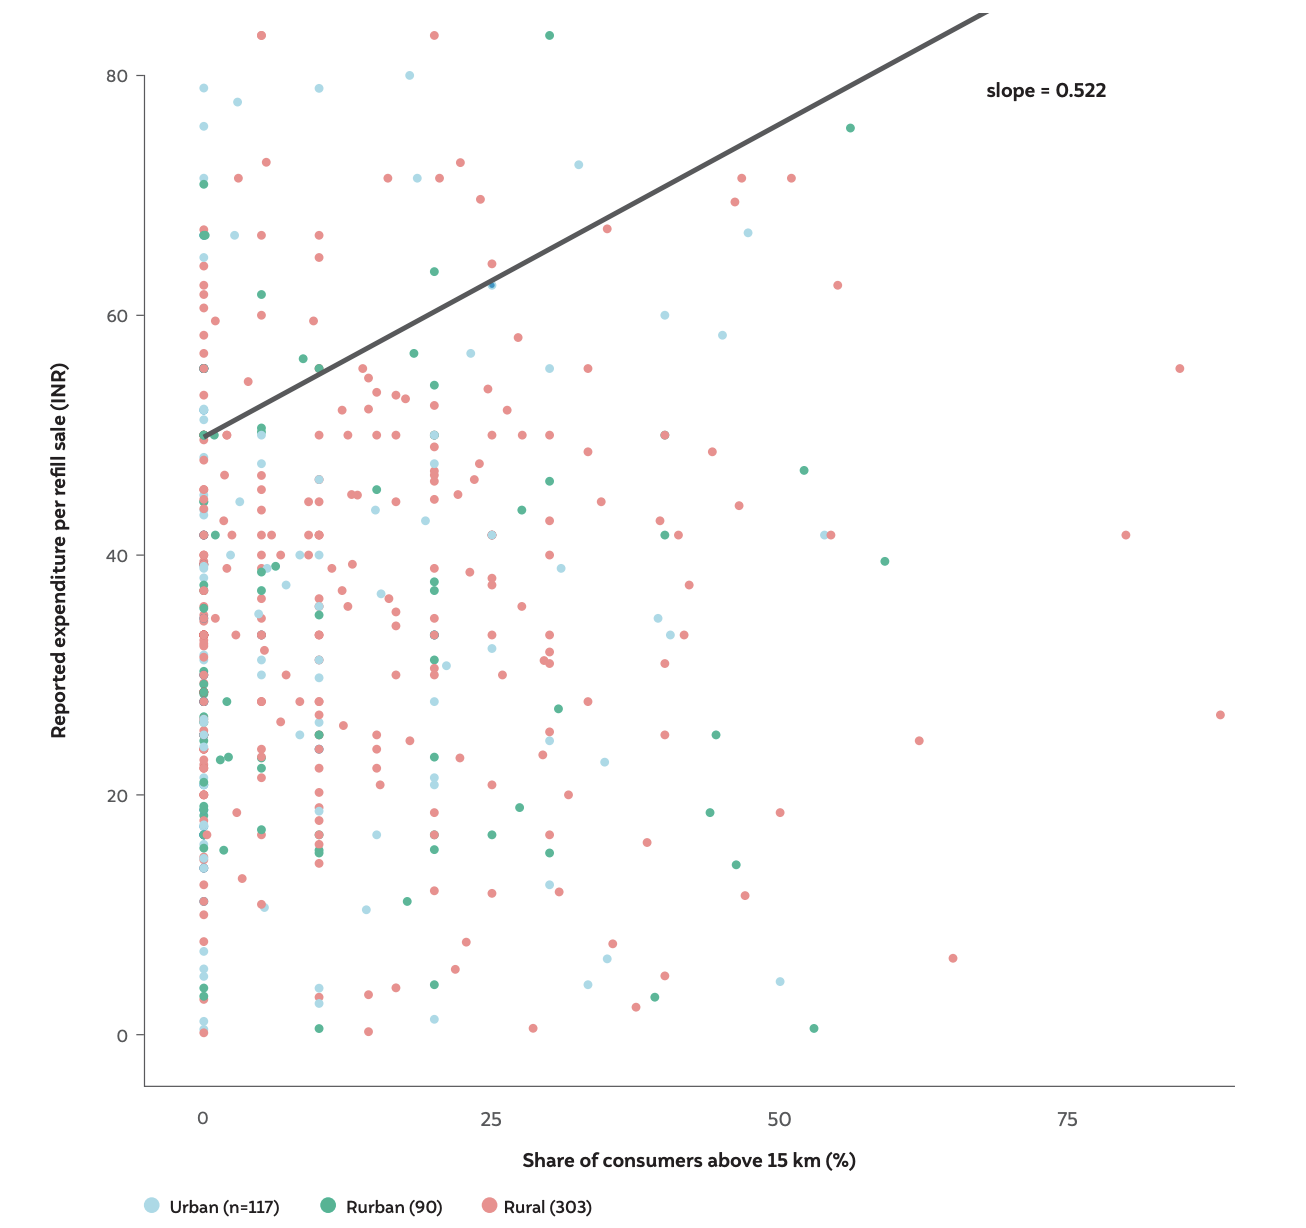
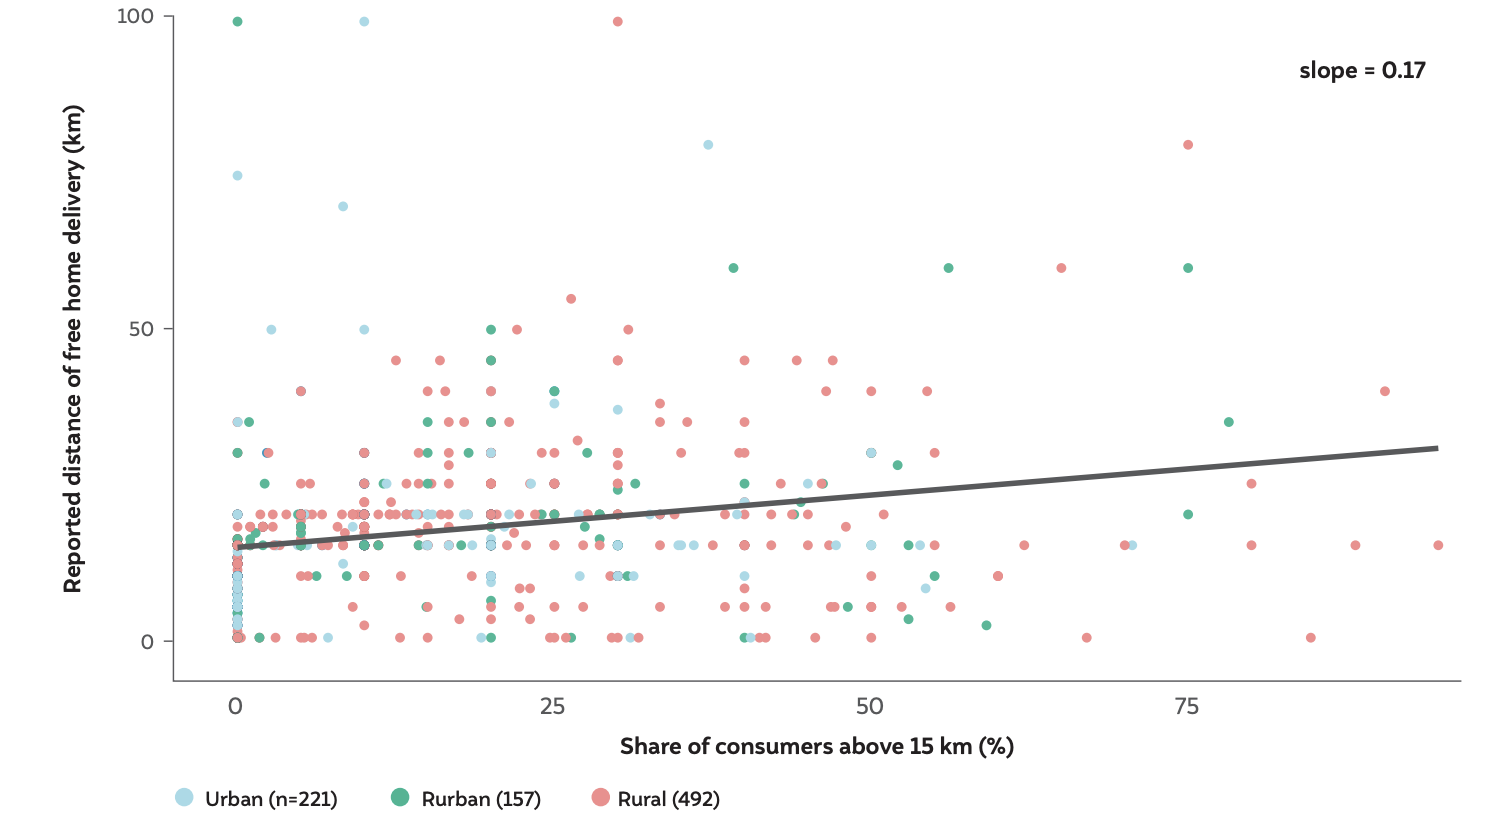
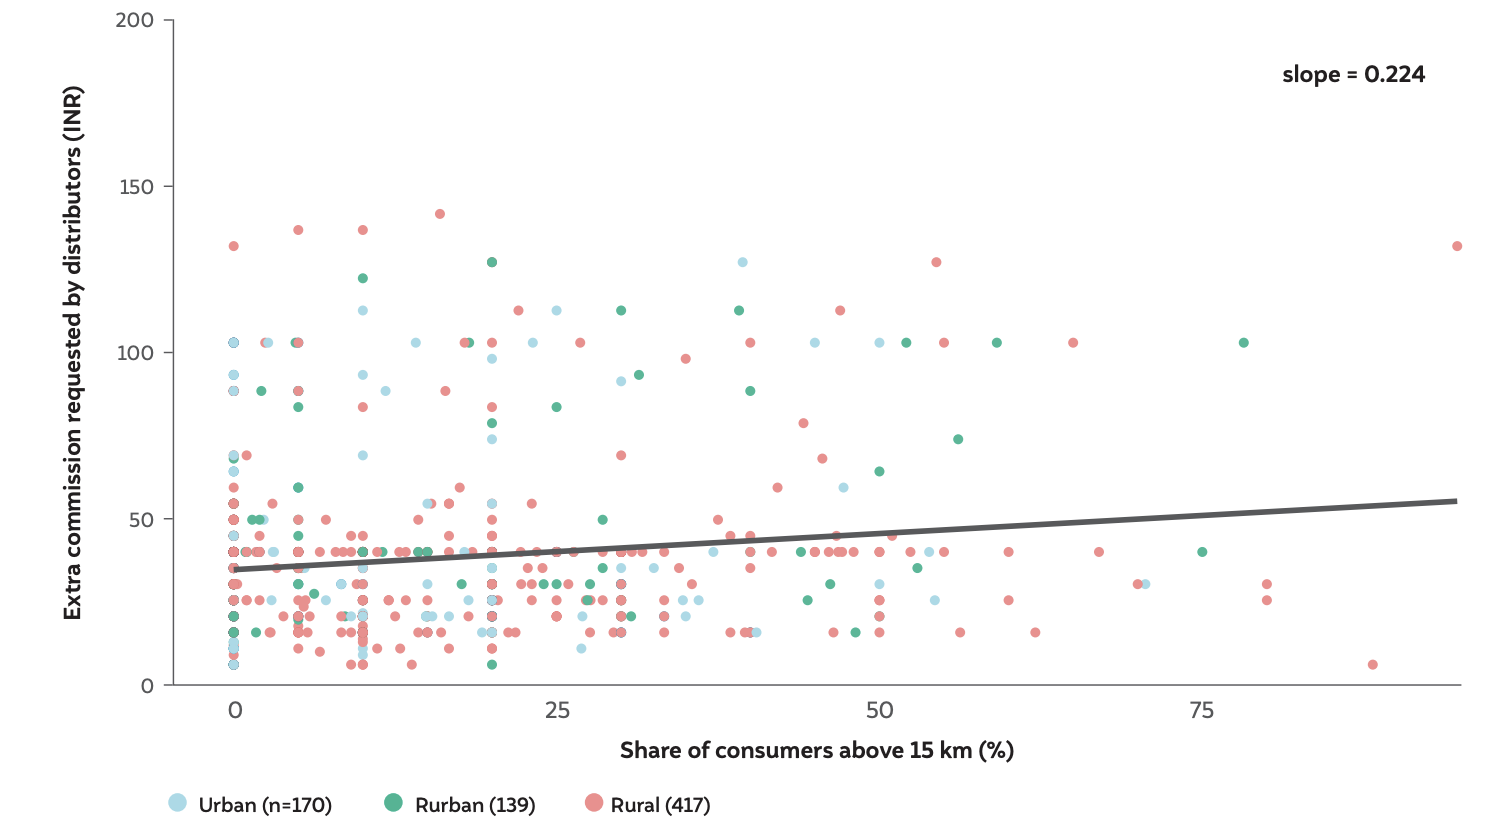
A closer analysis indicated that the expenditure per refill sale increased for distributors with a higher share of consumers located beyond 15 km (Figure 21). This could be on account of consumers being located at a farther distance, due to which distributors might be travelling more to provide refill delivery, which increased their fuel and manpower-related costs. This is also verified by the fact that as the share of consumers located above 15 km increased, for any given distributor, the distributors reportedly travelled longer distances to provide home delivery (Figure 22). Therefore, the commissions requested by distributors also increase with an increase in the share of consumers beyond 15 km (Figure 23). As LPG is a protected commodity under the Essential Commodities Act 1955 (MoPNG 2000), the process of gaining approval from local authorities (including district-level officials) to avail extra charges for home delivery beyond 15 km is a long and tedious one, and distributors state that it does not amount to enough compensation for the costs borne by them in providing home delivery.
Figure 21 Expenditure per refill sale increases with an increase in the share of consumers located beyond 15 km
Source: Authors’ analysis
Notes: In this panel, 374 entries were removed from the analysis, out of which 328 were blank values, and 46 were ‘zero’ values. The graph has been truncated at 80 for visual clarity and therefore 45 outliers have been removed. This does not effect the calculation of the slope.
 Source: Authors’ analysis
Notes: In this panel, 374 entries were removed from the analysis, out of which 328 were blank values, and 46 were ‘zero’ values. The graph has been truncated at 80 for visual clarity and therefore 45 outliers have been removed. This does not effect the calculation of the slope.
Figure 22 The distance of free home delivery increases as the share of consumers above 15 km increases
 Source: Authors’ analysis
Note: 14 entries were removed from this analysis because 7 distributors had responded ‘I don’t want to respond’ on the question regarding distance for free home delivery and 7 were ‘NA’ values.
Figure 23 Extra commission requested by distributors increases as the share of consumers above 15 km increases
Source: Authors’ analysis
Note: 158 entries were removed from this analysis because 78 were ‘zero’ values and 80 were ‘NA’ values.
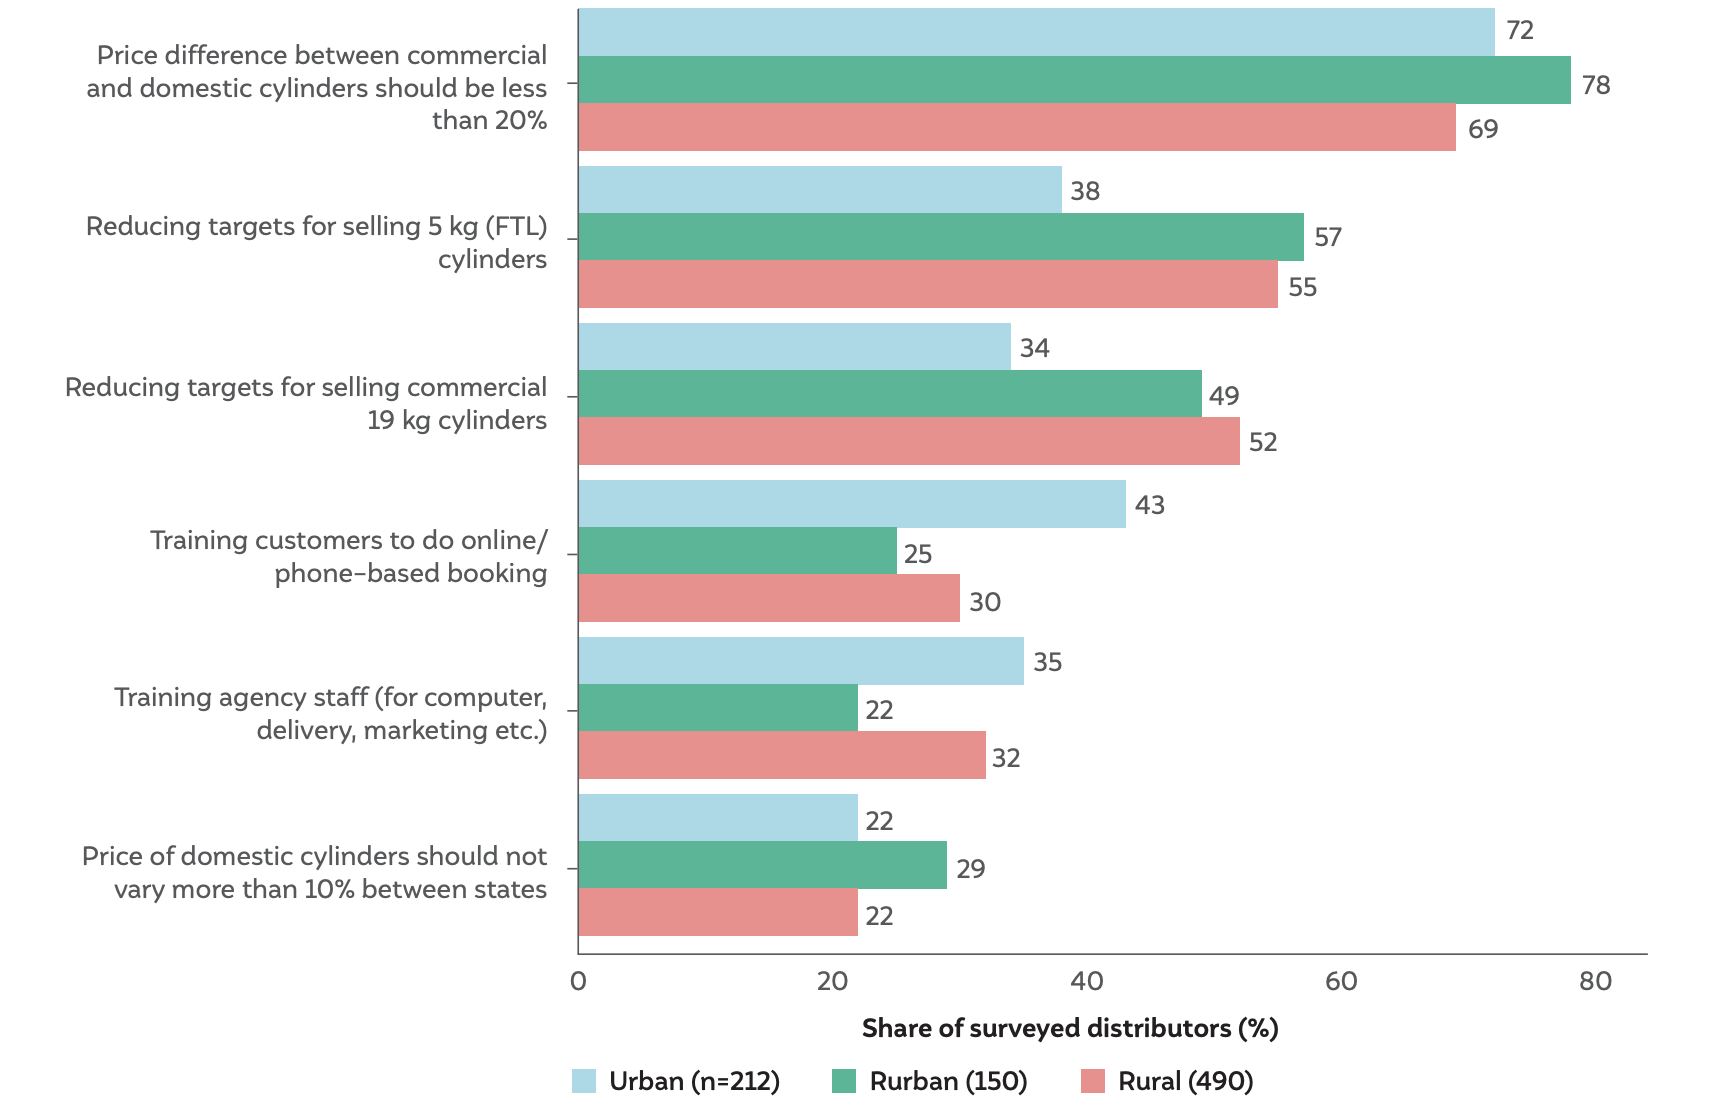
Since different distributors face different types of challenges in ensuring home delivery of LPG refills, it is also important to understand the nature of support measures that they would need to improve the quality of their service delivery. Therefore, in this survey, distributors were asked to choose the top three support measures they required from the MoPNG/OMCs from a list of eight support measures.26 The support measures prioritised by the distributors are presented in Figure 24.
Figure 24 Support measures requested by the LPG distributors vary significantly across different service area types
 Source: Authors’ analysis
Notes: Responses have been arranged in descending order. 32 values were removed from this analysis as 32 distributors had responded ‘I don’t know’ to the question on support measures. The support measure ‘Difference in purchase cost (invoice amount) of commercial cylinders for distributors and third-party business associates appointed by OMCs should be less than 10 per cent for a given state’ was removed as it was implemented after the start of the survey in 2022.
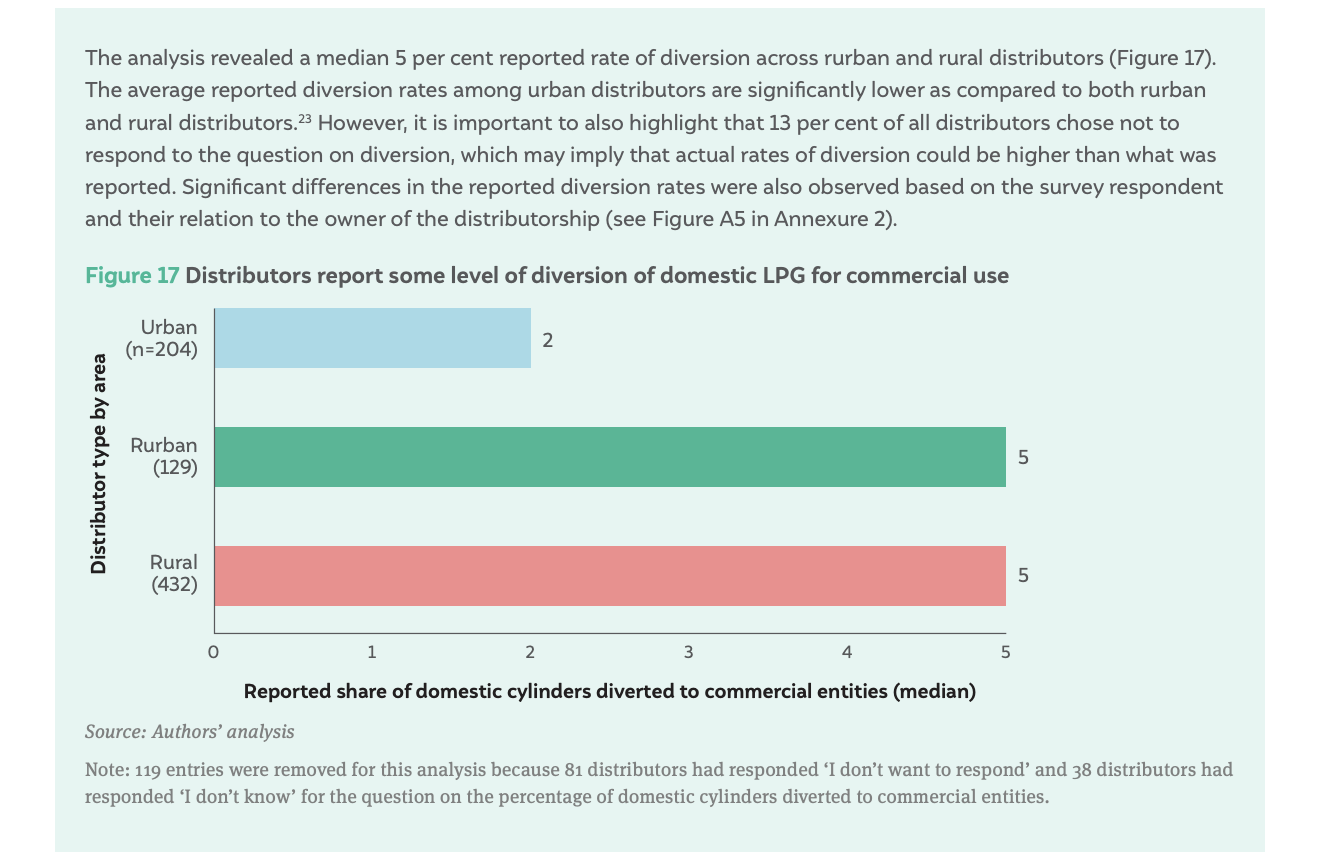
Distributors requested a relaxation in sales targets for 5 kg and 19 kg LPG cylinders. Box 2 in Chapter 3 indicated the possibility of diversion of domestic cylinders for commercial cooking purposes. To curb the diversion of domestic refills and promote the sales of commercial LPG refills, OMCs sometimes set sales targets for distributors to sell 5 kg and 19 kg commercial refills.27 In the survey, about half of the rurban and rural distributors requested a relaxation of targets for selling commercial refills (both 5 kg and 19 kg cylinders), whereas this share was approximately onethird among urban distributors. This could be because selling commercial refills is easier in urban areas, as the presence of commercial eateries in urban areas is higher than in rural areas.28 In the qualitative interviews as well, some distributors stated difficulties in selling 5 kg and 19 kg cylinders. Due to the lack of sufficient space at godowns and low demand in the market, at times, distributors claimed to have sold these cylinders below their market prices.
As not all consumers know how to book their LPG refills, sometimes, distributors report having to carry extra refill cylinders in their delivery vehicle as a buffer to sell them to consumers who cannot make online/phonebased bookings at their homes.29 In such cases, after reaching a specific area where they have to deliver refills to consumers who made prior bookings, and delivering them, the delivery agents help other consumers there (who did not make the booking) in making the online/ phone-based booking and mark them for immediate delivery. Though some distributors stated that these ad-hoc sales accounted for a significant proportion of their overall refill sales for the month, a few distributors stated that they had to spend a considerable amount of time and effort in carrying these extra cylinders in the vehicle and selling them. Additionally, distributors reported that when a refill was turned away by the consumer at the time of delivery, they were not compensated for their fuel and labour costs and had to travel twice to complete the delivery. This could significantly increase their expenses, especially if these consumers are located further away. These inefficiencies in operations can be easily reduced by strengthening ongoing consumer education efforts on online/phonebased bookings. Qualitative fieldwork also revealed that OMCs are already considering mobile and social media– based awareness campaigns and further measures can also be explored.
Consequently, about 33 per cent of the surveyed distributors requested that consumers be trained to book refills online or over the phone. A significantly higher number of urban distributors (43 per cent) as compared to rural and rurban distributors made this request (Figure 24). Even though this may seem counterintuitive, it could be due to urban distributors’ expectations that urban areas have higher levels of digital literacy and access to digital devices, and hence, consumers should more likely be able to book the refills online or over the phone.
In this chapter, the distributors’ perspective on the expected impact on refill sales due to changes in LPG refill prices and the improvement of home delivery services to 100 percent was analysed. It was found that at the INR 1,100 price level of LPG refills (price as of March 2023), a decrease in LPG prices (by INR 100) would have a relatively lower impact on LPG refill sales compared to the impact of achieving 100 percent home delivery. This will require incentivising the distributors in the form of additional delivery commission, which will be much less than INR 100.
Additionally, it was also found that the reported expenditure per refill sale varies significantly across distributor types. For instance, rural distributors reported that they face higher operating expenses perhaps due to the longer distances they have to travel for home delivery in rural areas (as highlighted in Chapter 3). From the qualitative interviews with distributors, it was found that this could adversely impact the financial viability of the LPG distribution business (particularly for rural distributors). Where consumers are located beyond 15 km, distributors also request a higher amount of extra commissions. In some cases, distributors also need to factor in additional expenses for failed deliveries (such as the absence of consumers at home during the time of delivery) and the need to travel twice (which is often the case with rural distributors, as per the qualitative interviews).
Hence, providing a flat commission of INR 73.08 per refill delivery to all types of distributors may make 100 per cent home delivery unviable for some. Apart from an increase in delivery commissions, distributors also requested other kinds of support measures from OMCs and the MoPNG to improve their operational efficiency and make consistent 100 per cent home deliveries a norm.
Inconsistent home delivery of LPG refills is one of the most important barriers to the sustained adoption of LPG. In this report, the operating conditions of LPG distributors were explored, including factors such as consumer spread, refill ratio, and the distance traveled to provide home delivery. It was found that these conditions vary significantly across different types of distributors. Since these variations could play a vital role in determining whether distributors will be able to make home deliveries or not, this study emphasises the need to treat urban, rurban, and rural distributors as separate entities. The following preliminary solutions have been recommended to address various on-ground challenges faced by the distributors along with the support they might require from the government and oil marketing companies (OMCs). These recommendations should be rigorously evaluated and field-tested before being formally proposed.
Implement a differentiated distributors’ commission model for home delivery.
The study reveals that self-reported home delivery expenses vary considerably based on the type of area served by distributors. Currently, distributors receive a flat delivery commission of 73.08 per refill delivery regardless of the area they cover. However, the research indicates that that this flat commission model may not adequately compensate many rural and rurban distributors for their deliveries. This is because difference in total consumer base (lower overall sales potential), the share of PMUY consumers (poor consumers are less likely to purchase frequently), average sales per 100 consumers (reflecting current business conditions) among distributor groups, and within distributor groups influence their operational expenses. To incentivise distributors to improve their serviceability, a differentiated commission model based on relevant factors, including consumer spread, refill sales, distance travelled by distributors to provide home delivery, etc. is proposed. Weightage should be assigned to factors that have a greater impact on the typical expenditure for distributors in each specific area so that the differentiated commission model can effectively address the challenges related to the heterogeneity of LPG distributors across urban, rurban, and rural geographies.
Additionally, performance-based incentives could be implemented, offering distributors the opportunity to earn higher margins on their commissions by rewarding those who significantly improve their delivery metrics, such as average time of delivery (Prayas Energy, 2020).
However, incentivising the distributors by providing them with additional delivery commissions may not immediately increase the home delivery service rate to 100 per cent. A robust monitoring mechanism will be required using appropriate technology that can provide real-time delivery status of LPG refills to OMCs and consumers. For instance, geotagging of customer locations and GPS-enabled tracking of delivery vehicles (or GPS coordinates of delivery agents’ mobile phones) could significantly improve the delivery process. The use of these technologies in logistical processes has already been adopted by various e-commerce platforms. The digitalisation of home delivery for LPG might involve the processing of large volumes of data, which would require some capacity-building of OMC staff and lead to increased monitoring costs.
Identify key parameters for a differentiated commission model
The differentiated commission model should be based on certain operational parameters such as total consumer base (sales potential), total share of PMUY consumers (conversion potential among some lowuse consumers), average sales per 100 consumers (current business viability), settlement dispersion index, and road infrastructure. These key parameters can aid in identifying distributors with low refill ratios and assessing consumer demand in their regions, particularly within the PMUY consumer segment.
A distributor with 5,000 registered active consumers and 90 per cent PMUY beneficiaries should not be treated the same (uniform commission) as a distributor with 15,000 consumers and 10 per cent PMUY beneficiaries. Hence, there should be three categories of distributors based on their level of systemic disadvantage: normal, disadvantaged, and severely disadvantaged, and additional support should be designed accordingly.
It would also help assess the distributors’ current business viability, and the extra commission can support those disadvantaged distributors falling below a certain threshold of monthly refill ratio to improve their performance on metrics such as targeted and average time of delivery. The proposed differentiated commission structure should be developed in collaboration with OMCs so that other influencing parameters which affect the business viability of the distributors can be identified and factored in.
Undertake consumer mapping for enhanced last-mile reach of LPG
Rural distributors serve consumers beyond 15 km and, in some situations, travel as far as 50 km from the distribution agency to deliver LPG refills to consumer homes located at such distances. An innovative initiative that can be piloted as a possible solution to this issue is that of vehicle pooling at the OMC level. Pooling resources such as transportation vehicles, whether trucks or tankers, can lead to significant cost and time savings. The OMCs can share the expenses related to vehicle maintenance, fuel, drivers’ salaries, and other operational costs. By consolidating their transportation efforts, the OMCs can better optimise the logistics of LPG distribution. This can lead to more efficient routes, reduced transit times, and improved delivery scheduling, ultimately benefiting consumers with timely and reliable LPG deliveries. Efficient logistics through vehicle pooling can lead to a reduction in greenhouse gas emissions and a lower environmental footprint.
Further, the use of appropriate technological interventions can help bolster delivery services. New distributors could be set up close to underserved consumers if the travel time, frequency of delivery, and road infrastructure based on the demand forecast are not viable for the current distributor. If it is not possible to set up a new distributorship, incentives in the form of extra commission can be explored to make far-off deliveries viable for the current distributor. The likelihood of a distributor within 15 km from a consumer to provide home delivery will be higher than when a distributor is 20–50 km away, as is self-reported by some distributors. Additionally, technology could also act as a tool in identifying underserved locations and help OMCs decide on establishing new distribution agencies if required.
Explore innovative pilot trials
In areas with low rates of home delivery, the self-help group (SHG) model should be explored to expand LPG distribution at the village level. SHGs, village-level entrepreneurs (VLEs) and other women entrepreneurs could serve as micro-distributors by stocking 7 (14.2 kg) cylinders, which weigh less than the recommended safety limit of 100 kg (Petroleum and Explosives Safety Organization 2016). This will be an extension of the present LPG distributor model with a top-up support to such micro-distributors. Measures such as this could save distribution costs and improve the availability of LPG on demand. Members of SHGs can pool their funds and access microcredit for the provision of LPG refills to consumers. Empowering the community with knowledge about the adverse effects of solid fuels may also transform SHGs into champions for LPG use. Besides actively generating awareness, they can also organise safety clinics on a regular basis, on behalf of the distributors, to ensure the safe utilisation of LPG. Local ration shops could also be stocked with 7 cylinders to provide refills on demand to rural consumers, in the absence of regular refill delivery to particular areas. The inclusion of SHGs in the LPG distribution system could also lead to income-generating opportunities for local women and build social capital for broader community development. This, in turn, could lead to the development of local leadership, improved decision-making processes, and a sense of collective responsibility. Notably, OMCs are already experimenting with models of Urja Devis and Ujjwala Sakhis.
Finally, a double-bottle connection approach for PMUY consumers, with a second 14.2 kg refill provided in addition to the first refill could be explored to bolster the sustained adoption of LPG. This approach demonstrated its effectiveness in a small-scale trial conducted in a financially disadvantaged region in Maharashtra. The study involved educating the local population about the detrimental health impacts of using smoky cookstoves. Subsequently, households were offered a trial of a double-cylinder gas stove, contingent on them disabling or dismantling their indoor chulha (traditional cooking stove) (Harrell 2019). Ninety-eight per cent of the households willingly accepted the free trial and took the important step of disabling or eliminating their indoor chulhas. Over the following three months, there was minimal incidence of households rebuilding their chulhas, signifying the lasting impact of this intervention. When the free trial period concluded, a remarkable 80 per cent of the households made the decision to purchase the double-cylinder gas stove. This outcome highlights the potential for this intervention to be scaled up and implemented on a broader scale.
Build capacity of LPG distributors and their staff members
In the survey, 30 per cent of distributors emphasised their interest in OMCs providing support for training their staff in computer operations, delivery processes, and effective marketing. Given the increasing significance of technology in the digital transformation of the LPG supply chain and the implementation of GPS-based monitoring for home deliveries, the necessity for these training initiatives will further intensify. This is crucial as the positive impacts of these technological advancements may not materialise on the ground without adequate training of distributors.
Further, qualitative interviews also revealed that distributors require building their capacity to understand administrative processes, distributor agency contracts, financial management, computer skills, marketing, and other relevant processes. To enhance the viability and efficiency of the LPG distribution system, OMCs should conduct needs-assessment studies and develop context-specific training programmes for distributors and their staff involved in ensuring last-mile delivery of LPG refills.
This nationwide LPG distributors’ survey is the first to explore accessibility constraints in India’s clean cooking energy transition, shedding light on LPG distributors, previously under-studied in the clean cooking domain. While the study lays the groundwork, certain contextspecific variations such as consumer dispersion need to be independently corroborated. Phase II of the survey will delve deeper through analyses of qualitative interviews with LPG distributors, OMC field officers, and other stakeholders, aiming to provide more nuanced insights and recommendations for enhancing the efficiency and service quality of the LPG distribution system.
Additionally, to further streamline and bolster the research process, OMCs should establish a periodic standardised data collection process on relevant indicators from the distributors and make it publicly available, after anonymising it. This will enable research institutions, academia, and businesses to undertake studies that could result in developing more informed recommendations to improve the efficiency of the LPG distribution system in all parts of the country.
As this study is based on a cross-sectional selfreported survey by distributors, OMC records will also be analysed to ascertain biases in survey responses. The design for categorization of disadvantage levels and top-up support amount requires additional data and analyses, including parameters like consumer dispersion index and road density. This study, the first of its kind in the Global South, offers supply-side insights for improving the last mile consumer-facing LPG supply chain structure across developing economies facing similar challenges.
The Pradhan Mantri Ujjwala Yojana (PMUY) is a flagship government scheme that provides subsidised LPG connections to low-income households, improving access to cleaner cooking fuels.
Fuel stacking refers to households using multiple cooking fuels, such as LPG and firewood, instead of relying solely on cleaner cooking fuels like LPG or electricity. This practice is widespread across India due to affordability concerns, cheap or free availability of solid fuels, lack of convenient access to clean cooking fuels and cultural preferences, hindering the complete transition away from solid cooking fuels such as cow dung cakes, firewood, kerosene, and coal.
Distributors providing home delivery of LPG refills in rural areas face challenges such as low consumer density, longer travel distances, and a higher share of low-income PMUY consumers who may not purchase refills regularly. These factors contribute to lower delivery rates of LPG compared to urban areas.
LPG distributors receive a fixed commission per cylinder, which includes a home delivery charge. As of October 2023, the commission was increased to INR 73.08. However, rural distributors report that this commission is insufficient to cover the higher delivery costs to rural and remote consumers.
The study suggests a differentiated commission model, women-led micro-distributors, and vehicle-sharing across Oil Marketing Companies (OMCs) to enhance delivery viability and efficiency.
Micro-distributors are village-level entrepreneurs who may stock small quantities of LPG cylinders to lower distribution costs and ensure on-demand supply for rural and remote consumers. Engaging women entrepreneurs and self-help group (SHG) members as micro-distributors may not only improve last-mile delivery in rural areas, but also significantly empower women by increasing household decision-making power and fostering economic independence.
Behaviour Change Approaches to Tackle Stubble Burning at Scale
Organic Waste Circular Economy for Viksit Bharat
How Can India Tackle Air Pollution with an Airshed-level Approach?
Roadmap of the methodology to assess the climate co-benefits of the SUP ban in Tamil Nadu
Roadmap of the methodology to assess the climate co-benefits of the SUP ban in Maharashtra