Book Chapter
Pathway to Sustainable Land-Use and Food Systems in India by 2050
Chandan Kumar Jha, Ranjan Ghosh, Vaibhav Chaturvedi and Manish Anand
September 2019 | Sustainable Food Systems
Suggested Citation: Jha C., Ghosh R., Chaturvedi V. and Anand M. 2019. “Pathway to sustainable Land-Use and Food Systems in India by 2050” In: FABLE 2019, Pathways to Sustainable Land-Use and Food Systems, 2019 Report of the FABLE Consortium, Laxenburg and Paris: International Institute for Applied Systems Analysis (IIASA) and Sustainable Development Solutions Network (SDSN), pp. 206-219.
Computed daily kilocalorie average intake per capita over 2000-2050
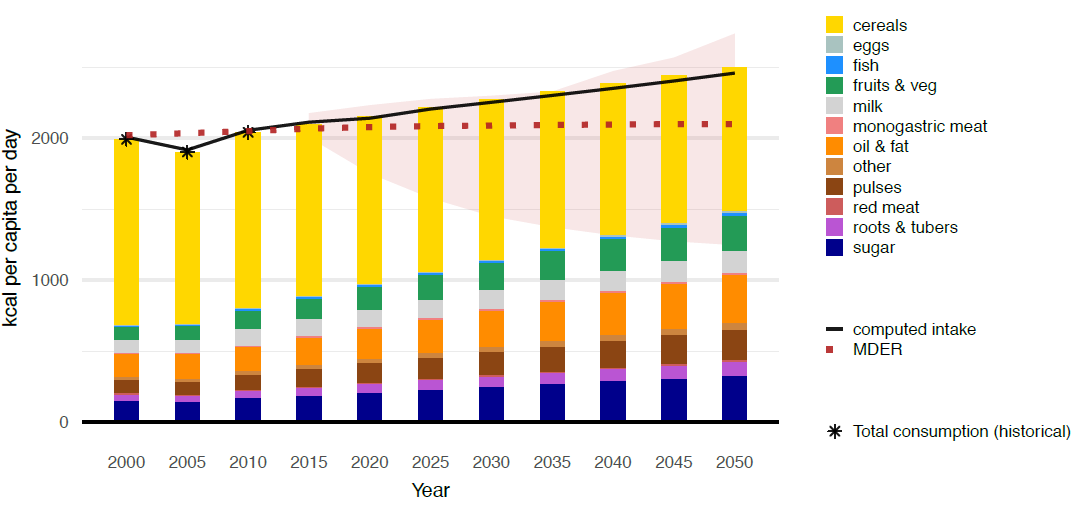
Source: Historical data source: FAOSTAT
Overview
This study is a part of the first report by the FABLE Consortium, which presents preliminary pathways towards sustainable land-use and food systems, prepared by the 18 country teams from developed and developing countries, including the European Union. The pathways help to determine and demonstrate the technical feasibility of making land-use and food systems sustainable in a country. They can also inform mid-century low-emission development strategies under the Paris Agreement on Climate Change. It was undertaken to enable policymakers and civil society to understand the present conditions and the future trends of sustainable indicators to support the setting of national targets and monitor their progress.
Key Highlights
- The average daily energy intake per capita increases from 2000 kcal/cap/day in 2000 to 2260 kcal/cap/day in 2030 to 2,450 kcal/cap/day in 2050.
- The computed average calorie intake is higher than the average minimum calorie requirement (MDER) at the national level from 2020 onwards.
- The Share of the Land which could support Biodiversity conservation (SLB) remained stable between 2000 and 2015 at 36 per cent. The lowest SLB is computed for the period 2020 to 2025 at 23 per cent of total land.
- Compared to the FABLE global target of having at least 50 per cent SLB by 2050, India’s results are below the target, but consistent with the country’s commitments under the Convention on Biological Diversity.
- Between 2000 and 2015, Annual agriculture, forestry and other land use (AFOLU) GHG emissions are between 642 and 969 Mt CO2e/year and it increases over time.
- AFOLU GHG emissions reach 839 Mt CO2e over the period 2046-2050: 868 Mt from agriculture and -30 Mt from Land use, land-use change, and forestry (LULUCF).
- No deforestation is projected over the whole period of assessment and afforestation would vary between 21 kha/year and 105 kha/year between 2015-2045 with a peak over 2035-2040.
- A reduction of cropland area is projected by 2050. At the same time, the agricultural trade balance would deteriorate from a trade surplus at the beginning to a trade deficit by 2050.
- Trade adjustment leads to a higher cropland area and lower other land area because the agricultural production has to increase to offset the reduction in imported quantities for several commodities.
- The results show gains in India across many dimensions in the long term, while emphasising that some key concerns remain. The forest cover increases, and so does the land that can support biodiversity. The energy intake in terms of calorific requirements increases significantly with time as people become richer. The country continues to gain in terms of production in agriculture, but overall carbon dioxide emissions from the agricultural sector remain high and are difficult to significantly reduce by 2050.
There is a sevenfold increase in GDP per capita during the period 2015 to 2050 which significantly impacts dietary change for the same period.