Council on Energy, Environment and Water Integrated | International | Independent


Suggested citation: Ignatious Sneha, Samruddhi Sharma, Rishikesh P, Mohammad Rafiuddin. 2026. Beyond Single Sources: Fusing Open and Commercial Satellite Data for Monitoring Crop Residue Burning in India. New Delhi: Council on Energy, Environment and Water.
Monitoring of crop residue burning (CRB) currently relies on active fire counts from the polar-orbiting satellites. These have coarse spatial resolution of 375 m and 1 km, and hence do not capture farm fires in areas less than 375 m x 375 m. Moreover, these satellites visit the same region only twice during the daytime. As a result, the satellites miss capturing the fires set outside the overpass window. A study by the Indian Space Research Organisation (ISRO) noted a shift in peak burning time from 1:30 p.m. to 5:00 p.m. over recent years.
Estimating the burnt area from the scars left after burning is an alternative. A CEEW study published in 2025 showed that the burnt area method using Sentinel-2 satellite imagery could classify burnt and unburnt pixels with 75 per cent accuracy in Indian conditions. However, its five-day revisit period posed another limitation, as the algorithm might fail to capture fields burnt and managed within two successive overpass periods. This gap could be filled using commercial images on the days when Sentinel-2 data is unavailable.
This study analysed the feasibility of fusing commercial satellite imagery and open-source Sentinel-2 imagery for continuous monitoring of CRB. A threshold-based algorithm was developed for PlanetScope images to estimate the burnt area.
Globally, crop residue burning (CRB) is a major environmental and public health concern. It releases greenhouse gases and particulate matter and also degrades soil quality and health (Vadrevu et al. 2019; Tawfeeq et al. 2025). Despite its harmful impacts, it remains a widely adopted post-harvest field-clearing practice in both developed and developing countries, with 450 million tonnes of crop residue burnt every year (CCAC 2023). In India, CRB is a national-scale problem and a major source of air pollution in northern Indian cities. For instance, it contributes as much as 35–40 per cent to Delhi’s particulate matter 2.5 (PM2.5) on peak burning days in late October and early November (Govardhan et al. 2023).
India has committed substantial public resources to the effort – roughly INR 4,200 crore during 2018–26 – through schemes such as the Central Sector Scheme for Promotion of Agricultural Mechanisation for In-Situ Management of Crop Residue (MoAFW 2026) and the National Policy on Biofuels. Evaluating whether such interventions are working and determining where to direct efforts next require accurate monitoring of the situation on the ground. Such monitoring underpins enforcement, targeted action, and course correction.
There are two satellite-based methods for monitoring these fires, but both have structural limitations. The first method is based on active fire counts detected by polar-orbiting satellites. Currently, the Commission for Air Quality Management in National Capital Region and Adjoining Areas (CAQM) follows a fire count-based protocol developed by the Indian Space Research Organisation (ISRO) to monitor CRB. These satellites have a coarser spatial resolution of 375 m and 1 km and revisit the same region once or twice a day, potentially missing small, short-lived fires that occur outside their narrow overpass windows (Schroeder et al. 2014). The underestimation has increased as peak burning has shifted to the evening, outside the satellite overpass windows (Singh et al. 2025a, 2025b).
The second monitoring method estimates burnt area using remote sensing (Giglio et al. 2006). In Indian conditions, the overall accuracy of the burnt area method using Sentinel-2 imagery is about 75 per cent, with a true positive rate (TPR) of 59 per cent (Ignatious et al. 2025). However, the Sentinel-2 constellation generally revisits the same area only once every five days, missing the fields burnt and subsequently managed (ploughing / tilling) in the interim (Ignatious et al. 2025). Moreover, cloud cover and other atmospheric conditions, along with smoke from fires, could obscure detections.
This study asks a practical question: can this gap be narrowed by combining the imagery India already relies on with complementary commercial data? We propose a method that combines openly available Sentinel-2 imagery with commercial multispectral imagery from Planet Labs to improve CRB estimates.
We used openly available Sentinel-2 (Level-2A) and commercially available PlanetScope (Level-3B, Surface Reflectance) data. As mentioned above, the Sentinel-2 constellation generally revisits the same region every five days. However, certain strips on Earth’s surface are revisited every other day or every third day. A portion of eastern Punjab spanning 9,700 sq km lies in one such strip. The region of interest (ROI) of this study lies within this region. We obtained Sentinel-2 images (using Google Earth Engine) between 23 October and 7 November 2024 for this ROI. We then procured PlanetScope images for the region to fill the observation gap between Sentinel-2 passes. Our objective was to estimate the extent of daily burning over two to three consecutive days during the peak CRB period.
We then followed the threshold-based approach discussed in Ignatious et al. (2025) to compute burnt area on Sentinel-2 images. Extending the approach for PlanetScope imagery, we extracted pixels of burnt and unburnt fields and analysed spectral indices – Simple Ratio (SR), Normalised Difference Vegetation Index (NDVI), Char Index (CI), Burn Area Index (BAI) and Bare Soil Index (BSoI). BAI and CI could potentially differentiate between the two categories, and we defined four test thresholds for them. We tested these indices and thresholds across 14 randomly selected villages and computed performance metrics such as accuracy, TPR, false positive rate (FPR), and false negative rate (FNR), among others, to identify the best-performing threshold.
| Metric | T1 (Between the 10th and 90th percentiles of BAI values of burnt fields) |
T2 (Between the 5th and 95th percentiles of BAI values of burnt fields) |
T3 (Between the 1st and 95th percentiles of BAI values of burnt fields) |
T4 (Less than or equal to the 99th percentile of CI values of burnt fields) |
|---|---|---|---|---|
| Accuracy | 0.6835 | 0.7581 | 0.8162 | 0.7258 |
| True positive rate (TPR) | 0.2079 | 0.3953 | 0.5433 | 0.3736 |
| False positive rate (FPR) | 0.0001 | 0.0006 | 0.0023 | 0.0400 |
| False negative rate (FNR) | 0.7921 | 0.6047 | 0.4567 | 0.6264 |
| F1 score | 0.3442 | 0.5663 | 0.7025 | 0.5211 |
| Matthews correlation coefficient (MCC) | 0.3687 | 0.5297 | 0.6414 | 0.4317 |
| Cohen’s kappa (k) | 0.2395 | 0.4391 | 0.5855 | 0.3685 |
Source: Authors’ analysis
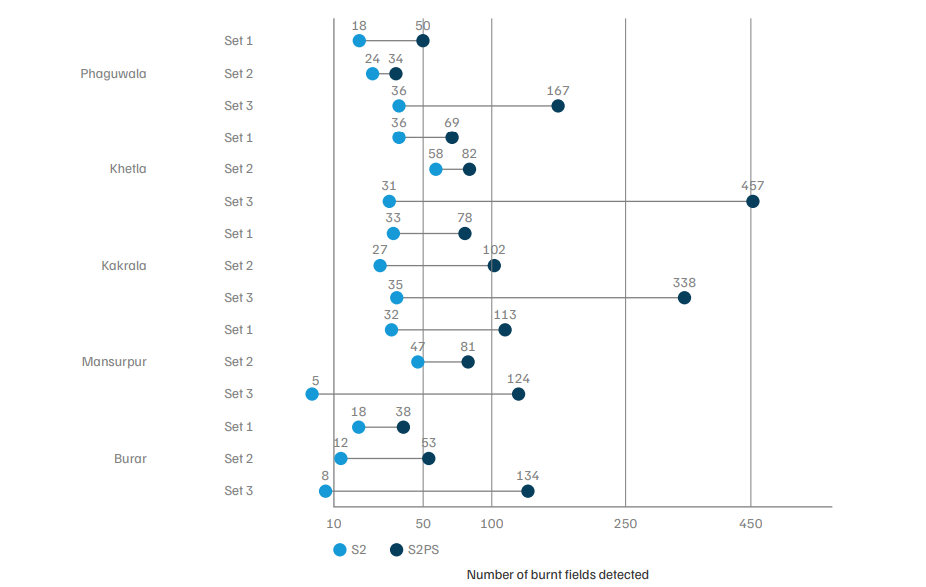
Figure ES1. The inclusion of PlanetScope images in tandem with Sentinel-2 images improved the detection of burnt land parcels by two to five times compared to using Sentinel-2 alone
Source: Authors’ analysis
Abbreviations: S2: scenario 1; S2PS: scenario 2.
Note: Axis uses a square-root scale to keep small and large counts both readable
Our analysis shows that combining commercial and openly available satellite imagery improves CRB detection. Therefore, to improve CRB monitoring in India, we recommend the following.
The burnt area estimates are based on the scars that are left after burning that the satellites detect, whereas fire counts are based on the thermal anomalies that the satellites detect while they pass over a region.
The number of fields detected increased by two to five times using commercial satellite imagery in tandem with open-source imagery compared to only using open-source satellite imagery (Sentinel-2).
The cost is a limiting factor for commercial imagery. It would cost more than INR 1 crore for a single day’s image that covers the entire state of Punjab. Other factors, like smoke and clouds, also obstruct the image captured.
Mitigating Stubble Burning in Haryana Survey Insights from 1500 Farmers
Unlocking Finance for India’s Textile Waste Management