Council on Energy, Environment and Water Integrated | International | Independent


Suggested Citation: Verma, Shubhi, Abinaya Sekar, Pallavi Pant. 2026. Methods for Long-Term Particulate Matter Trend Assessment. Interpreting Monitoring Data to Evaluate Air Quality Trends. New Delhi: Council on Energy, Environment and Water and Health Effects Institute.
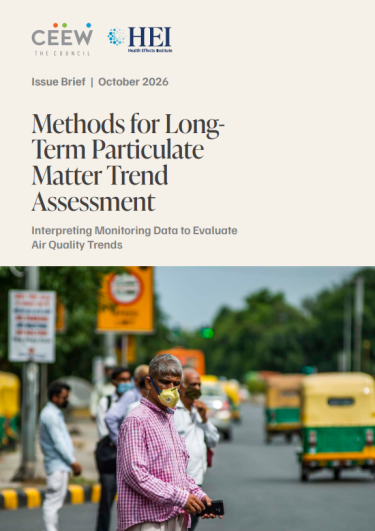
India has expanded its air quality monitoring network and interventions for clean air programmes, creating the need to evaluate whether these interventions are delivering sustained improvements. However, observed pollution levels fluctuate with seasonal patterns, meteorological conditions and episodic events, which makes long-term trend assessments difficult to interpret.
This issue brief presents three approaches to assessing long-term particulate matter trends, namely, rolling averages, deseasonalisation, and meteorological normalisation (deweathering). Using monitoring data from Indian cities, including a case study of Delhi, it explains the strengths, limitations, data requirements, and applications of each method. This brief provides methodological guidance for pollution control authorities, researchers and decision-makers seeking to evaluate air quality trends more consistently and scientifically.
Poor air quality has been associated with significant health, economic, and societal impacts in India. In response, over the past decade, India has made substantial investments in air quality monitoring, leading to a rapid expansion of continuous ambient air quality monitoring stations (CAAQMS) and the generation of air quality data. Additionally, India has substantially expanded its clean air programme and city-level initiatives while augmenting financial support for clean air action.
With the expansion of air quality monitoring networks and increased financial support for pollution control initiatives, there is a growing need to critically evaluate the real-world impact of air pollution interventions. However, reliably assessing long-term air quality trends remains challenging due to variations in data availability and completeness, as well as meteorological and seasonal influences that can obscure underlying changes in air quality. Daily and annual averages are influenced not only by pollution sources but also by seasonal emission patterns, episodic events, and variations in meteorological conditions. If these factors are not accounted for, changes in air quality may appear to be greater during meteorologically favourable periods, while actual reductions in emissions may not register at all during unfavourable periods. Furthermore, all monitoring data must be subject to a series of systematic quality checks, including data completeness thresholds, consistency across monitoring stations, and outlier removal. At present, methods for outlier detection and quality checks are neither standardised nor formally documented by regulatory agencies, resulting in variations across different organisations.
Globally, researchers utilise a range of approaches to track long-term air quality trends and assess the effectiveness of interventions, with the choice of approach largely depending on data availability and resource requirements. This issue brief outlines guidelines for air quality trend analysis comprising three independent approaches, including:
Monitoring stations were randomly selected from the regulatory monitoring network in Amritsar, Kolkata, and Hyderabad to demonstrate the application of each method. The strengths, weaknesses, and appropriate applications of each approach are discussed and demonstrated through a case study of Delhi.
This approach provides regulatory institutions, including pollution control boards, the Commission for Air Quality Management (CAQM), and urban local bodies, with a practical and scientifically robust approach for interpreting monitoring data, evaluating interventions, and supporting evidence-based air quality policies. It could also strengthen the allocation of funds and the evaluation of city performance under the National Clean Air Programme (NCAP).
The issue brief was developed based on the HEI study, Assessment of Changes in Air Quality in Indian Cities Since the Launch of the National Clean Air Programme (HEI 2025), and the preprint by CEEW researchers, Investigating the impact of meteorology and emissions on PM2.5 and PM10 in Delhi using machine learning (Verma et al. 2025)
India must have reliable ways of knowing whether air pollution is really declining or whether the variation observed is due to changes in seasons and weather patterns. This brief discusses three methods to do that – rolling averages, deseasonalisation, and deweathering. Using examples from Indian cities, including Delhi, it explains how these methods can help regulatory organisations and researchers interpret monitoring data and evaluate clean air interventions more scientifically.
The framework includes approaches for data cleaning and validation, data completeness checks, and methods for trend assessment. A structured framework ensures that only clean, reliable, and credible data inform the assessment. Incomplete or patchy datasets may fail to capture the true pollution trends and can sometimes lead to misleading conclusions.
The brief focuses on three separate techniques, and the approaches are not limited to these techniques. Rolling averages over a period of three years or five years help in smoothing out the effects of any temporary changes and focusing on general trends. Deseasonalisation helps in distinguishing regular seasonal trends from trends in pollution levels. Deweathering involves the use of machine learning to determine the effect of meteorology on pollutant levels. The suitable method depends on the study objective and the availability of air quality and meteorological data.
Weather conditions affect the dispersal and concentration of pollutants. The higher the wind speed and precipitation rate, the more the pollutants are dispersed, leading to lower levels of pollution, while stagnant weather conditions cause pollution to increase despite the same amount of emissions. Therefore, a reduction in the observed pollution does not always mean that there has been a reduction in emissions.
State and central pollution control boards, CAQM, ULBs, researchers, and decision-makers may apply these techniques to analyse long-term trends in particulate matter. The application of the above techniques may be useful in assessing clean air interventions, harmonising reporting, and making informed decisions on air quality management.
No, the three methods do not need to be applied in parallel and can be applied independently, depending on the granularity and availability of air-quality and meteorological data. For regulatory compliance reporting against National Ambient Air Quality Standards, rolling averages may be sufficient. For more detailed studies assessing the effectiveness of policy interventions, deseasonalisation or deweathering may be recommended.
Mitigating Stubble Burning in Haryana Survey Insights from 1500 Farmers
Unlocking Finance for India’s Textile Waste Management