Council on Energy, Environment and Water Integrated | International | Independent
Suggested Citation: Abhishek, Jain, Sudatta Ray, Karthik Ganesan, Michael Aklin, Chao-Yo Cheng, and Johannes Urpelainen. 2015. Access to Clean Cooking Energy and Electricity: Survey of States. New Delhi: Council on Energy, Environment and Water.
The Access to Clean Cooking Energy and Electricity – Survey of States (ACCESS) is India's largest energy access survey, covering more than 8500 households, 714 villages and 51 districts, across the states of Bihar, Jharkhand, Madhya Pradesh, Odisha, Uttar Pradesh and West Bengal. The first ACCESS survey was conducted in 2015.
The ACCESS study is the result of an expansive data collection process, lasting over 12 months and resulting in the collection of over 2.5 million data points. It provides a first-of-its-kind multi-dimensional evaluation of the state of energy access in India and highlights the multiple nuances associated with electricity access, such as the duration of supply, quality, reliability, affordability and even the legal status of electricity connections.
Conducted by CEEW in collaboration with Columbia University, with support from the Shakti Sustainable Energy Foundation, ACCESS provides a holistic approach to analyse the deep distress in rural India due to poor electricity access and serves as a handbook for all discussion on this topic. ACCESS has supported policymakers develop region and district-specific solutions, thereby making government programmes for expanding electricity access more effective.
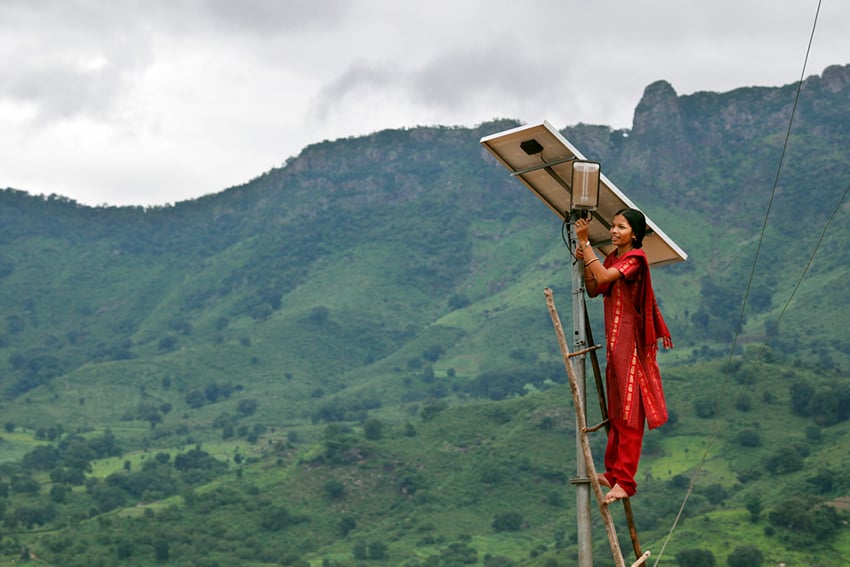
Maintenance work on solar street lighting in Koraput, Odisha (Source: UK Aid)
On Electricity Access
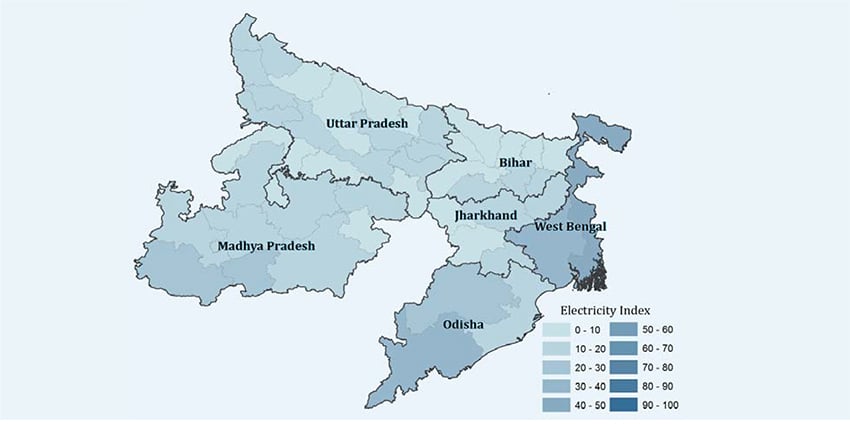
Source: CEEW analysis, 2015
On Cooking Energy
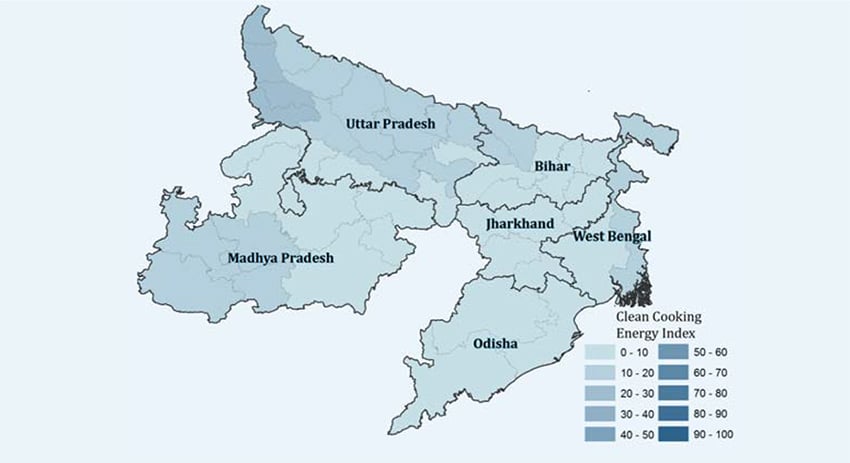
Source: CEEW analysis, 2015
The ACCESS Survey report was launched in New Delhi in September 2015 by the Minister for Power, Coal, and New and Renewable Energy, Piyush Goyal. Delivering the keynote address, he said, “In urban India, we often take electricity for granted without realizing the poor state of electricity access faced by large parts of rural India. Though 96 per cent of villages are electrified, it is crucial to note that this does not equal to electrification of the households. Rural citizens today demand quality electricity to light their homes, use fans, charge mobiles and provide a conducive environment for the education of their children.”
The role of energy access in socioeconomic development of individuals and communities has been well established. Internationally, governments have understood the linkage and are endeavouring to improve the status of energy access. Currently available metrics suggest that globally, close to 1.1 billion people lack access to electricity and 300 million of this deprived lot live in India, by far the highest share of any single country. Similarly, on the cooking energy side, globally, more than 2.9 billion people rely on traditional biomass for cooking. Once again, India tops the chart with close to 800 million continuing to use fi rewood, dung cakes, charcoal or crop residue to meet their cooking energy needs. Although these metrics are rudimentary, they suggest that India has a long way to go before addressing the energy needs of its population. In development discourse in India, household energy access is measured by household’s primary source of lighting and cooking, or through electrifi cation status of household. These are unidimensional measures with binary states and do not provide a sense of the true deprivation experienced by households.
Measures such as village electrifi cation rate (which currently stands at 96.7 per cent) or the number of active LPG connections (~150 million, enough to cover 60 per cent of all the households) hold limited value in bringing tangible improvements to the energy access situation of households. In reality, energy access is a multi-dimensional phenomenon which is much more than the presence of a connection and the same must be refl ected in the way it is measured. As far as electricity is concerned, focus must be on the quality and availability of supply, along with the affordability and even legality of access. Moreover, access in some dimensions cannot be classifi ed using a binary measure, as the ‘level of access’ varies signifi cantly (e.g. in terms of capacity to support various energy services or in the number of hours supply is available for), and has concomitant socioeconomic impacts. Capturing these nuances is important to effectively plan for and achieve universal energy access in the country.
In order to bridge this gap in understanding of energy access, as well as to capture the detailed data on the state of energy access in India, we conducted this study with two main objectives. The fi rst was to develop a multi-dimensional, multi-tier energy access measurement framework. The second was to evaluate this framework by using primary data collected specifi cally for the purpose of ascertaining state of energy access. To achieve our objective and fi ll the current gap in understanding and data, we carried out the largest primary data collection exercise dedicated to energy access, in the history of India. We surveyed some of the most energy deprived states of the country, i.e. Bihar, Jharkhand, Madhya Pradesh, Uttar Pradesh, Odisha, and West Bengal. The survey was conducted over a period of 80 days and covering all the 48 administrative divisions in each of the states, reaching out to 714 villages in 51 districts. A comprehensive questionnaire comprising 155 questions was administered by a team of 60 enumerators, to the 8,566 households that constitute this statistically representative sample. Given the particularly poor situation of energy access in rural India, we specifi cally focused on energy access in rural areas in this study.
Energy access pertains to access and consumption of modern forms of energy for household use, community use and productive use. However, the current study focuses only on household energy access. The decision to limit the evaluation to household energy access is corroborated even in the survey response where respondents indicate that energy for use within the household is of top-priority.
The study develops two separate multi-dimensional, multi-tier frameworks to evaluate access to electricity and clean cooking energy in households. There are six dimensions in the electricity access framework and five dimensions in the cooking energy access framework. Under the proposed framework, a tier is assigned to each household for each of the dimensions. The tiers, ranging from Tier 0 (lowest) to Tier 3 (highest), represent increasing endowments and a progression in the path to energy access. The outcome metric for every household, for electricity access and cooking energy access, is an overall tier associated with each. This overall tier (for electricity and cooking energy) corresponds to the minimum tier achieved across all the dimensions within each of the frameworks. While this does make for a conservative estimation of the overall tier, such an approach effectively highlights the priority area of action, making the framework highly valuable for decision-makers and key stakeholders. Aggregating the results at household level, an index (one each for electricity and cooking) is created at district, division, and state level. The index is a weighted average estimation based on the proportion of households in each tier. Such an index is useful for comparisons across regions, but the need of understanding energy access tiers and the distribution of households across them cannot be avoided for concrete policy actions.
Electricity Access Framework
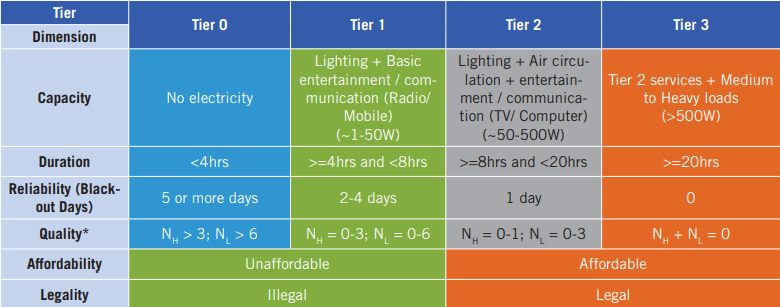
*NH is number of high voltage days in a month causing appliance damage; NL is number of low voltage days in a month limiting appliance usage.
NOTE: For dimensions where the categories span multiple tiers, only the higher tier values apply. For example, affordability can only be categorised as Tier 1 or Tier 3. The same is the case for legality.
Clean Cooking Energy Access Framework
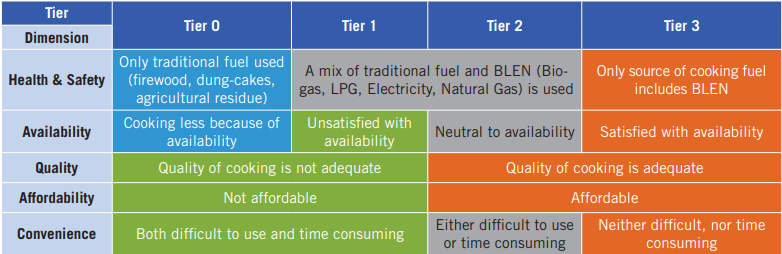
NOTE: For dimensions where the categories span multiple tiers, only the higher tier values apply. For example quality and affordability dimensions can only take on Tier 1 or Tier 3. Health and safety can take on Tier 0, Tier 2 and Tier 3.
The basic structure of the proposed framework and many of the dimensions overlap with that of the Global Tracking Framework (developed by the World Bank, ESMAP and International Energy Agency). However, differences arise in the defi nition of some of the dimensions, setting of thresholds for various tiers and in some cases, the nature of responses (use of subjective responses in lieu of objective thresholds) which are used to populate the framework. One major modifi cation that our framework has in comparison to the GTF is the choice of overall number of tiers to measure energy access. The proposed framework has only four tiers as compared to the six used in the GTF. Being a global framework, the number of tiers defi ned in the GTF might be more relevant in the context of other countries where a fi ner differentiation may be possible or necessitated. However, for India, our survey results suggest that the results are not sensitive enough to justify the need for six tiers.
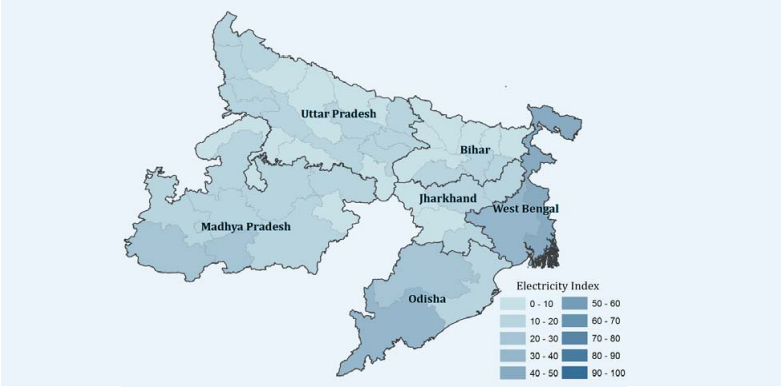
The evaluation of electricity access, using the multi-tier framework, paints a grim picture of the rural areas in the six states. On a scale of 0 to 100, the electricity index across the six states ranges from as low as 8.1 for Bihar to 41.8 for West Bengal. A map, highlighting the electricity access situation of each division across these six states, is shown in fi gure below. Darker shades represent a better electricity access situation. Majority of areas are in lightest shades, especially in Bihar Jharkhand and Uttar Pradesh, and points to the poor electricity access situation in these areas. It is also important to note that no division across these states achieves an electricity index score beyond the 60-70 band (the highest possible score being 100).
Electricity access index for six states
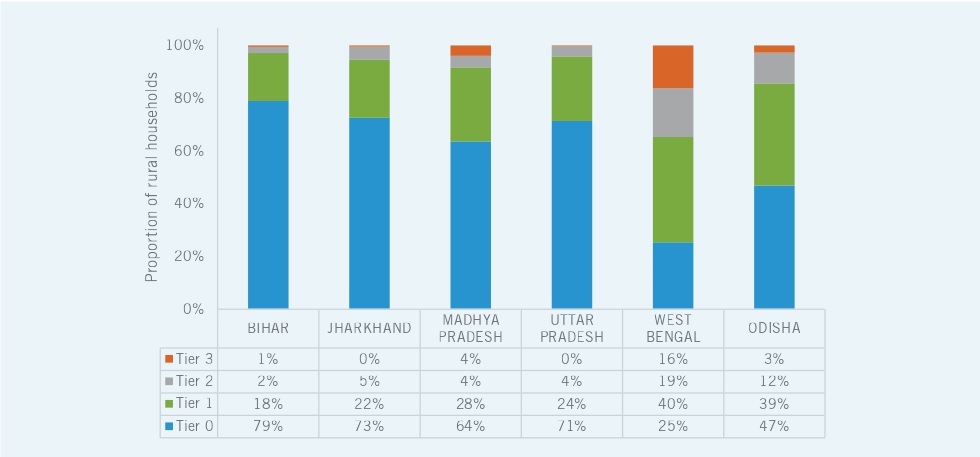
Beyond the geographical representation, the proportion of households spread across the four tiers is shown in the fi gure below. West Bengal is the best performer on electricity access with the greatest proportion of households in Tier 3 and the lowest proportion in Tier 0, when compared to other states in the study. In the remaining states (barring Odisha) more than half of the households were categorised in Tier 0. It is useful to contrast this metric against the reported electrifi cation rates of villages in these states which range from 92 per cent (Orissa) to 99.99 per cent (West Bengal). Bihar, where 79 per cent of rural households were classifi ed in Tier 0, has a village electrifi cation rate of 95.5 per cent. Also, there is a signifi cant lag between the time when electricity was fi rst brought to the villages and the households in these villages actually getting electrifi ed. The median lag ranges from two years (in the case of Jharkhand and Bihar, which saw a recent wave of electrifi cation) to more than 25 years in Odisha and about 15 years in the case Madhya Pradesh and Uttar Pradesh.
Distribution of households across electricity access tiers
The Rajeev Gandhi Grameen Vidyutikaran Yojana (RGGVY) (now, Deendayal Upadhyaya Gram Jyoti Yojana), the fl agship rural electrifi cation programme of Indian government, has been under implementation for over a decade now. In villages which did see RGGVY, the household electrifi cation rates vary from 47 per cent in Bihar to 92 per cent in West Bengal. In villages that witnessed RGGVY, in the states of Bihar, Jharkhand and Uttar Pradesh, more than 60 per cent of the households that had an electricity connection (at the time of the survey) got one only after the program commenced in the villages. Intensive electrifi cation under RGGVY does seem to have impacted villages in these three states in a positive manner.
A startling fi nding across six states is that, of the households that are classifi ed in Tier 0 (lowest level of energy access), nearly 50 per cent are there despite having an electricity connection. This highlights the need to look beyond metrics such as ‘possessing an electricity connection’ to meaningfully describe the energy access situation. Households face severe challenges of quality, reliability and duration of supply which then drive their classifi cation in the lower tiers.
Among the other 50 per cent of the households (those without an electricity connection), two third of them did not take an electricity connection, despite having the electricity grid in the vicinity. Households cited main reasons as affordability of the connection charges and monthly charges, and unreliable supply. An analysis of affordability indicates that among houses which have opted out of having an electric connection citing high monthly charges; only a small fraction of the unconnected population would truly fi nd the prevailing prices to be high. This is based on the normative limit of four per cent of total expenditure going towards threshold electricity consumption. This indicates a gap in perception or misinformation regarding electricity use expenditure and this must be addressed by the service providers or utilities.
For those that made it to the next tier (Tier 1), affordability was the key bottleneck in West Bengal and Madhya Pradesh for being trapped at that level. In the other states, reliability of supply (black-out days) turned-out as the major roadblock and was responsible for a large portion of the households not progressing to higher tiers.
Only a small proportion of households made it to Tier 2 and Tier 3. In the case of Odisha, duration of supply was a major issue for those not progressing beyond Tier 2. It was found that very few households across the states receive round-the-clock supply of electricity and is defi nitely a factor that hinders movement to higher tiers. Since evening hours of supply are particularly important for the purposes of lighting, we also analysed this dimension across states. Jharkhand and Uttar Pradesh were the poorest performing states with an average of two hours of supply and were closely followed by Bihar at three hours. This effectively also precludes these households from achieving even Tier 2. In the case of Tier 2 households in West Bengal, it was the reliability and quality of supply that prevented a signifi cant share of households from graduating to the top tier.
The state of clean cooking energy access shows lot less variation across the six states. Although there are perceptible variations in the use and mix of traditional biomass fuels across states, the unifying feature is the limited access to modern cooking fuels in all the states. Even aggregated fi gures from the Census (2011) suggest that access to clean cooking energy in rural India is lower than access to electricity. This is exemplifi ed in the results from the six states surveyed for this study. This excessive dependence on traditional fuels has signifi cant adverse health impacts as a result of poor indoor air quality. As per the survey, only 14 per cent households in rural areas across the six states have stated BLEN (Biogas/ LPG/ Electricity/ Natural Gas) as their primary source of cooking. In sharp contrast, the total fraction of households in these states that are reported (by oil marketing companies) to have LPG connections ranges from 26 per cent in Jharkhand and Odisha to more than 50 per cent in Uttar Pradesh. Even though the number of connections is at the state level and represents all households (rural as well as urban), the large disparity between the number of connections and the actual use of LPG already illustrates the need for better metrics.
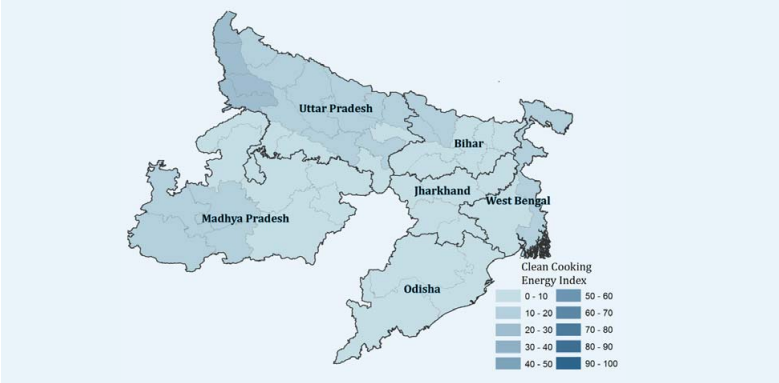
In terms of the clean cooking energy access index, all states are concentrated towards the very low end of the spectrum ranging from 3.4 to 14, on a scale of 0-100. Except some parts of Uttar Pradesh, Madhya Pradesh and West Bengal, which have marginally better access, most of the rural areas in these six states have very poor access to clean cooking energy, as shown by the light colours in the map.
Clean cooking energy access index across six states
When aggregated across the states, more than three quarters of the households are categorised in Tier 0 for cooking energy access (see fi gure below). A household falls in Tier 0 only in two cases – either on account of total reliance on traditional biomass for cooking or if it reports insuffi cient cooking as a result of unavailability of suffi cient fuel (of any form). More than 99 per cent of the households categorised in Tier 0 are there as a result of the total reliance on traditional fuels. Thus, it is vital to understand the bottlenecks that households face in using cleaner cooking energy options. We found that penetration and inclination to adopt improved biomass cookstoves or biogas as very low. Only 0.74 per cent and 0.21 per cent rural households were using improved cookstoves and biogas for cooking, respectively. Virtually, all the adoption and use of clean cooking energy in rural areas could be attributed to LPG. Thus, we focused on understanding the reasons for households to not opt for an LPG connection and continue relying on traditional biomass entirely. The high upfront cost to secure an LPG connection is cited as the biggest hurdle (for 95 per cent of households) to adopting LPG. Furthermore, the high recurring monthly expenditure (88 per cent), and lack of distributors for the fuel in the local area (72 per cent) were also stated to be signifi cant impediments to LPG adoption. Moreover, there is poor awareness about adverse health impacts of the use of traditional chulhas. Nearly 45 per cent of households without an LPG connection are unaware of the positive health benefi ts of using LPG over traditional chulha. Such poor levels of awareness of the impact of cooking fuels on health, could also be a reason for the low demand and adoption of the clean fuel.
Distribution of households across clean cooking energy access tiers
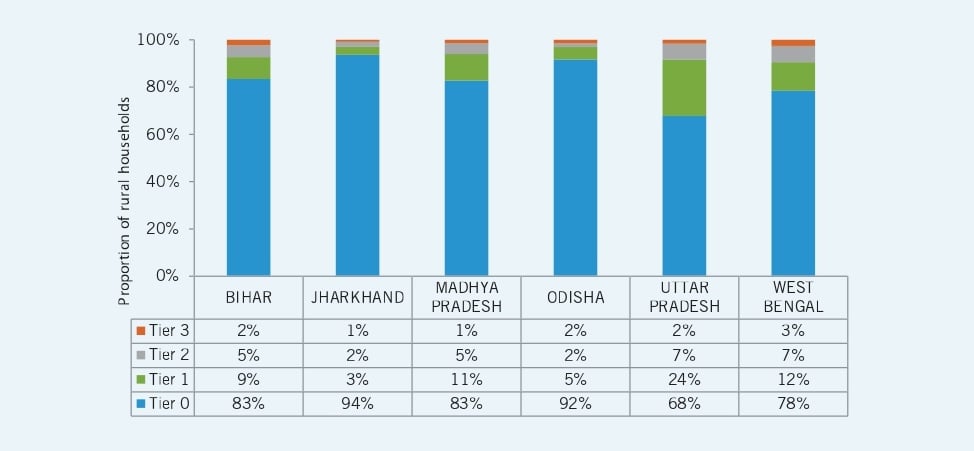
For households that are categorised in Tier 1, the most signifi cant impediment to graduate to higher tier is the affordability of cooking energy. Nearly 83 per cent of the households in Tier 1 spend more than six per cent of their total monthly expenditure on procuring cooking energy. More than a quarter of the households face challenges associated with convenience of cooking, citing that cooking using their primary cooking arrangement is both time consuming and diffi cult.
Across tiers, an analysis of the outlay for households that incur some (non-zero) expenditure on procuring cooking energy reveals some interesting results. In all states, households that rely exclusively on biomass, and pay for some or all of it, end up spending more money on cooking energy than those who exclusively use LPG.
In Uttar Pradesh only a third of the households rely entirely on free of cost biomass. In Madhya Pradesh the fi gure is also low, at 38 per cent. In West Bengal, Jharkhand and Orissa a lot more households rely entirely on free of cost biomass (~ 60 per cent). This assumes signifi cance when investigating the economic rationale for transitioning to use LPG.
Analysis of responses in UP indicate that though the distribution infrastructure for LPG is poor, they show higher subscription rate for LPG. This could partially be explained by the fact that a signifi cant proportion of population rely on market procured fi rewood (as opposed to collecting it for free), and hence subsidised LPG (at the prevailing prices) becomes an economically becomes an economically competitive option.
Only fi ve per cent of the households are classifi ed in Tier 2 for cooking energy. The mixed use of traditional fuels and LPG is the main barrier that prevents households from achieving the highest tier, Tier 3. This mixed use (referred to as fuel stacking) is a result of availability of free-of-cost biomass and its use alongside LPG, since it does allow for some cost savings. However, the impacts associated with emissions from the use of traditional fuels are not accounted for by the decision makers of these households. Another signifi cant impediment to their progression is the convenience dimension associated with traditional cooking practices. More than 50 per cent of households stated that cooking on a traditional chulha is both time consuming and diffi cult. Households reporting such issues with LPG based cooking were far lesser (about four per cent). Less than three per cent of the rural households across the states are categorised in the highest tier.
Apart from understanding the current state of energy access, we also explored peoples’ preferences about energy sources, its use, related decision making and its associated policies. We first explored how people prioritise energy access over other necessities? After education, which was accorded highest priority, clean drinking water and electricity were the next in line. But LPG or clean cooking energy were not given the same importance, as compared to these other necessities.
We also asked households about the priority areas for electrification. Household electrification emerged as the most important need, cited by 66 per cent of households as their top priority. This was followed by street lighting, community use and productive (income generating) use, in that order.
When asked about who should look after their energy supply, people overwhelmingly believe that the government should continue overseeing energy supply. However, across the states, there is a divergence in opinion about the appropriate level of government (in particular state vs. central government).
In terms of technology choices, we gauged the interest of the population for micro-grids and solar lanterns. More than two-thirds of the population preferred grid supply over micro-grid. However, close to 78 per cent of the households supported the idea of providing capital support on solar lanterns in lieu of reducing kerosene subsidy. On the cooking energy front, LPG garnered the highest support, in all states and across all tiers. Improved biomass cookstoves received a cold response, whereas biogas for cooking was not preferred at all. This refl ects a loss of confi dence in these technologies, stemming from the very limited successful experiences with these technologies, despite three decades of dedicated programme implementation
Energy access is multi-dimensional with disparate needs, preferences, technology choices and outcomes. The multi-tier framework provides numerous novel insights on energy access in India, which would be of use to policymakers to refi ne existing schemes and their implementation. While this is a static evaluation at one point in time, the state of access is likely to change rapidly as a result of the increased focus on providing universal energy access. Continuing this exercise as an annual or biennial basis will provide further information on the progress and changing facets of energy access. As penetration increases with each passing year, the bottlenecks of energy access will change over time. The multi-tier, multi-dimensional framework developed and evaluated here is ideally suited to track such developments and could be the authoritative basis for decision makers to evaluate the impact of their programmes and take stock of persisting challenges.
The multi-tier framework provides numerous novel insights on energy access, which could be used by policymakers to refine the existing schemes and their implementation for increasing access to modern forms of energy. The issue of energy access in India is truly a multi-dimensional one. For instance, it is as much a problem of the availability of infrastructure and resources as it is of understanding the benefits of opting to consume a modern form of energy. While conventional policies advocate for a supply side response, the fi ndings in this study suggest that there is also a need to address the demand for clean energy, especially on the cooking energy side. On the electricity access front, the priority must shift not only to the provision of a connection to the households, but also to ensure a decent level of duration of supply, quality and reliability in the service. On the cooking front, the study suggests that users of traditional fuels do not necessarily pay less (or no) charges for accessing energy, though many of them perceive modern commercial energy sources as being more expensive. There is also a lack of awareness about the full benefits of transitioning to cleaner fuels. Consequently, the two types of energy access that we capture in this study require interventions that are different in their nature and targeted level of governance. This point is further strengthened by the observation that a very weak correlation exists between the electricity and cooking energy access tiers at the household level. This is also a uniform observation across the states.
While this is a static evaluation at one point in time, the state of access is likely to change rapidly as a result of the increased focus on providing universal energy access. Going forward, we plan to conduct similar survey exercises, while increasing the geographical scope and widening the focus beyond household access. Overtime, this would help to build a dynamic database to effectively track the state and progress of energy access in the country. Alternatively, a more cost effective approach could be to add certain energy access related questions to the existing pan-India surveys, such as the NSS household expenditure survey which is conducted in a periodic manner.
As penetration increases with each passing year, the bottlenecks of energy access may change over time. The multi-tier, multi-dimensional framework is ideally suited to track such developments and can be the authoritative basis for decision makers to evaluate the impact of their programs and take stock of open challenges.
Behaviour Change Approaches to Tackle Stubble Burning at Scale
Organic Waste Circular Economy for Viksit Bharat
How Can India Tackle Air Pollution with an Airshed-level Approach?
Roadmap of the methodology to assess the climate co-benefits of the SUP ban in Tamil Nadu
Roadmap of the methodology to assess the climate co-benefits of the SUP ban in Maharashtra