Paper
Energy Access in India — Today and Tomorrow
Karthik Ganesan, Rajeev Vishnu
June 2014 | Energy Transitions
Suggested Citation: Ganesan, Karthik and Rajeev Vishnu. 2015. Energy access in India- Today and Tomorrow. New Delhi: Council on Energy, Environment and Water.
Overview
The study statistically analyses the factors that determine the energy demand across India. It outlines a comparative analysis of the energy demand for electricity and cooking. Further, it forecasts the demand for energy at a household level in the next few decades.
Universal energy access is a key priority on the global development agenda and is the foundation for all Millenium Development Goals. India’s per capita energy consumption stands at 0.58 toe/person- well short of the world average of 1.8 toe/person. Clearly, energy poverty is entrenched and needs to be addressed.
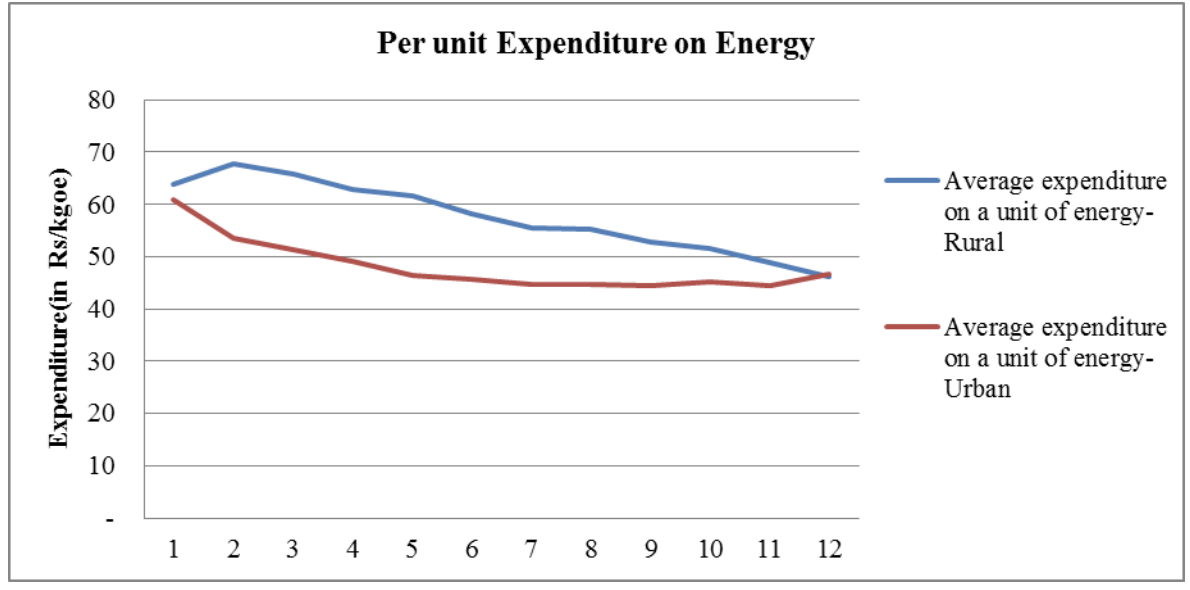
Price of Energy for Urban and Rural households
Key Highlights
- Energy poverty is determined by two factors – the ability to pay for the requisite amount of energy and access to the desired forms of modern energy.
- The analysis indicates a large disparity in the consumption of energy across income groups, social groups and between urban and rural households.
- About 20 per cent of India's households consume no electricity and of these 94 percent are in rural areas.
- Nearly 2/3rd of the country does not consume any LPG and roughly 85 per cent of the households are in rural areas.
- The average efficiency of fuel consumption by urban households is 52 per cent as compared to rural households (18 percent). The low useful energy to purchased energy ratio for rural households arises from the predominance of traditional biomass combined with technology inefficiencies in using these conventional fuels.
- Rural household allocated 9 per cent of their expenditure to direct energy consumption needs, while an urban household spends 7 percent of total expenditure.
- Lower-income households paid a higher price for each unit of useful energy consumed than higher-income groups. This is one of the biggest hindrances to attain universal energy access.
- Firewood was the dominant fuel used across most households in rural households, baring those in the high-income groups.
- Electricity and LPG constituted the bulk of the energy service demands of the households with increasing income.
- Low-income groups in rural households preferred kerosene as a major source of lighting, however, the trend is reversal among high-income groups. While in urban households, only low-income groups preferred firewood as the primary cooking fuel.
- Electricity dominated as the primary lighting fuel across all income groups among urban households
Per-capita energy consumption vs. Per-capita GDP across states

- States with higher GDP per capita, such as Maharashtra, Gujarat, Kerala and Tamil Nadu consume higher energy quantities per person. Himalayan states that face severe winter compared to India consume significantly more energy during winter than non-winter months.
- Himalayan states are likely to consume more fuel in winters than they do in summers owing to this seasonal variation.
- The next few decades will see a transition to cleaner and more efficient fuels. The dependence on kerosene for lighting will dwindle with better access to electricity.
- The consumption of LPG/PNG and electricity is likely to witness a meteoric increase driven by higher incomes, modern appliances, and increasing awareness of the socio-economic benefits of consuming these fuels.
As much as 80 per cent and 21 per cent of the population in rural and urban areas have insufficient access to clean energy.