Council on Energy, Environment and Water Integrated | International | Independent
Suggested citation: Saji, Selna, Gandhar G. Ukidve, and Neeraj Kuldeep. 2021. Feasibility assessment of agriculture solar micro-grids: A case study of TP-DDL Discom in North Delhi. New Delhi: Council on Energy, Environment and Water.
This study discusses the economic analysis of a medium-sized solar plant (1 MW) connected to agriculture under different business models: farmer-owned, discom-owned and third-party-owned. It’s a case study on solarising the agriculture load in Tata Power’s license area in North Delhi. The analysis compares the levelised cost of electricity (LCoE) and farmer(s) income under the three business models. It also assesses the benefits to dicoms by shifting agriculture supply from night time to solar generation hours. The study recommends discom-owned/third-party-owned model as a win-win proposal for the discom and farmers, enabling scaling up of solarisation of the agriculture sector.
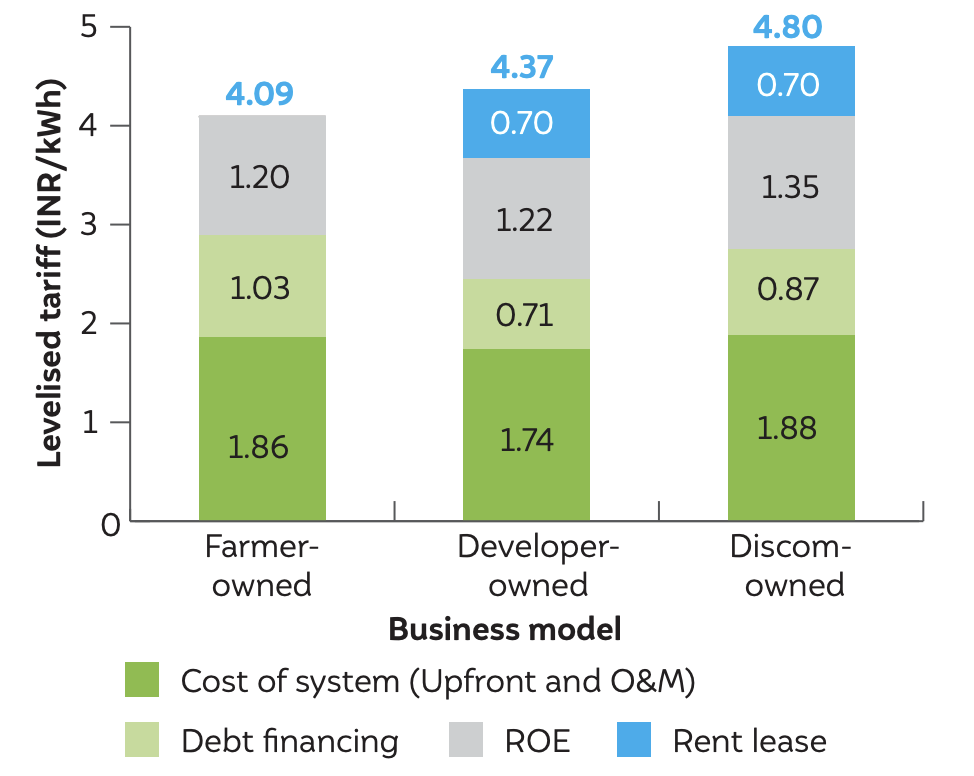
Farmer-owned system is the cheapest way to generate power
Source: CEEW analysis
Note: Values in blue font indicate ‘LCoE’
Farmer income under different business models.

Source: Authors’ analysis
Solar micro-grids are emerging as an alternative source of power to agricultural consumers, supplying affordable, reliable, and clean electricity. Micro-grid installations situated in close proximity to the consumption point offer additional benefits to distribution companies (discoms) such as lowering of transmission and distribution losses, deferral of investments in evacuation infrastructure, and fulfilment of the renewable energy purchase (RPO) targets.
The Ministry of New and Renewable Energy (MNRE) launched the Pradhan Mantri Kisan Urja Suraksha Evam Utthan (PM-KUSUM) scheme in 2019, with the aim of reducing the grid dependence of agriculture pumps. This in turn would bring down the subsidy burden of agricultural power consumption on discoms and provide additional source of income for the farmers (Ministry of New and Renewable Energy 2019). Many states have also launched similar schemes/policies for solarisation of their agriculture loads, with notable examples of the Agriculture cum Solar Farm Scheme in Delhi and the Mukhyamantri Saur Krishi Vahini Yojana in Maharashtra.
Tata Power Delhi Distribution Company Ltd (TP-DDL) shared data with us to conduct a techno-economic feasibility of solar micro-grids in its licensee area for different ownership structures: (i) farmer-owned, (ii) discom-owned and (iii) third-party-owned systems. The analysis also covers the business model proposed under the Delhi Agriculture cum Solar Farm Scheme, in which a third-party generator sells electricity through virtual net metering only to government entities such as Delhi Jal Board (Department of Power, Government of National Capital Territory Delhi 2018). The solar plant is set up at an elevated structure on a farmer’s land and the generated electricity is fed into the distribution feeder. Our analysis compares levelised tariffs (INR per kWh) for solar generation and farmers’ income under all the four ownership structures (the term business model is used invariably). The study also demonstrates impact of time of agriculture supply on discom benefits and concludes that the agriculture load coinciding with solar generation yields maximum benefits compared to the round-theclock supply through a reduction in power purchase expenses (which are higher during daytime compared to that for round-the-clock supply) of the discom.
We observe that the farmers earn six times higher revenue through land lease in third-party owned and discomowned systems compared to the income from farmerowned systems. The discoms realise marginally higher solar tariffs (INR 0.30–0.80 per kWh) in case of third-party or discom-owned systems compared to farmer-owned systems due to the additional land lease component in these arrangements. The farmer-owned systems face several market challenges for scaling up: access to lowcost capital, higher upfront cost, and lack of know-how of the solar systems to the farmer community (Agarwal and Jain 2018). We recommend that the Government of Delhi and the discom promote third-party-owned/ discom-owned systems installed on the farmer’s land. The marginal difference in tariffs can be compensated by policy measures such as generation-based incentive and capital subsidy. Considering the demand of 10 MW for solarised feeder under Component A for Delhi, the financial support would amount to INR 1.26 crore per year.1
Indian agriculture sector poses challenges for three other sectors in India: energy, environment, and economy. The sector consumes 17 per cent of the total electricity in India (Ministry of Statistics and Programme Implementation 2021) and continues to be a heavily subsidised segment for the distribution companies (discoms), receiving 75 per cent of the total electricity subsidies (Aggarwal, et al. 2020). Indian discoms are already burdened with retail tariffs being much below the average cost of supply2 (ACoS),3 delays in subsidy disbursements, and poor collection and billing. Further, they realise very poor revenue from agricultural consumers, which adds up to their financial crunch. There are over 30 million agriculture pumps installed in India, deployed primarily for irrigation purposes. Around 10 million pumps (Ministry of New and Renewable Energy 2019) in India run on diesel and emit around 60 million tons of CO2 .4 Solarising the dieselbased irrigation, for instance under (PM-KUSUM-B),5 translates to a latent demand of 8.25 GW (Standing Committee on Energy, 17th Loksabha 2021).6 The remaining pumps mainly use grid electricity, which is dominated by thermal generation (75 per cent of total generation),7 adding to air pollution and global warming. Notably, the sector employs around 59 per cent of India’s working population (Food and Agriculture Organisation 2017), with an abysmal per capita income of around INR 6,427 a month, leaving no room for savings (National Sample Survey Office 2013).
Solarising agricultural power consumption can address the challenges posed to three other sectors highlighted earlier. Solar tariffs lower the cost of electricity supply to agricultural consumers, reducing the gap between ACoS and the retail tariffs. This gives some relief to state governments that operate in a limited fiscal space. Commercial and industrial (C&I) consumers also benefit from a potential reduction in cross-subsidy quantum. Also, solarising pump usage will reduce the carbon emissions from the sector significantly. Although water consumption at the farm level may not be altered,8 solar feeders contribute to the conservation of scarce national resources by eliminating the need for water required in thermal generation: a typical thermal plant consumes 3.7 litres of water to generate 1 kWh of electricity post-adjustment of transmission and distribution (T&D) losses. Farmers can also enhance their income by leasing out land to the project developers or selling solar power to the discoms.
Figure 1 Retail tariffs for agriculture consumers in Delhi are much lower than the average cost of supply
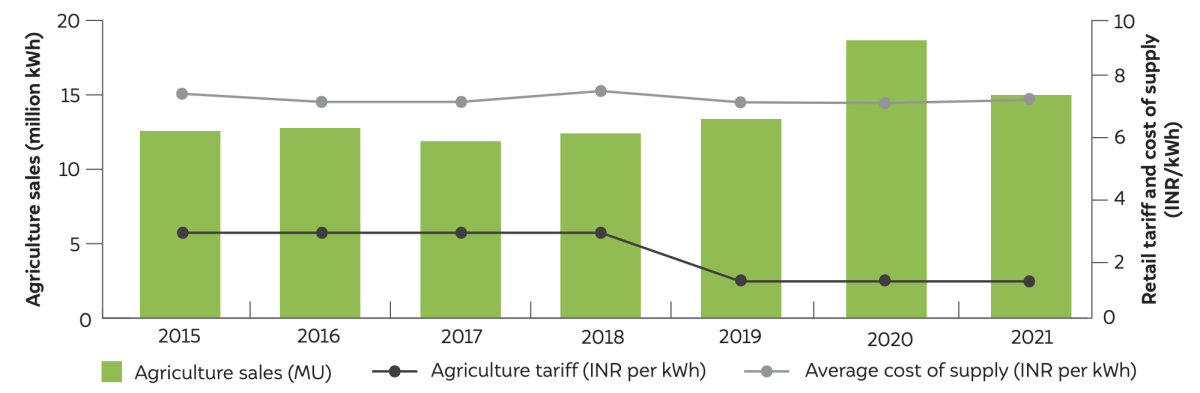
Source: Authors’ adaption from DERC tariff orders
Given the multitude of benefits of solarising agriculture, the Government of India launched the Pradhan Mantri Kisan Urja Suraksha Evam Utthaan Mahabhiyan (PM-KUSUM) scheme in 2019, intending to reduce the subsidy burden on agriculture consumption, contribute to India’s nationally determined contributions (NDC), and increase farmer’s income. The scheme has three components—A, B, and C. Under component A, renewable energy projects with a combined capacity of 10,000 MW, with each project between 500 kW and 2 MW capacity, will be set up by groups of farmers and project developers. The power will be bought by discoms at a feed-in tariff. Discoms have also been given the option to own and operate these solar plants in case farmers cannot raise equity. Discoms are given INR 0.40 per kWh or INR 6.6 lakh per MW of installed capacity for the first five years from the commissioning date of the projects as a performancebased incentive (PBI). Discoms also realise system-level benefits such as avoided power purchase cost, RPO compliance, and avoided T&D losses. Additionally, there are a few state-level schemes for the solarisation of agriculture such as Mukhyamantri Saur Krushi Vahini Yojana in Maharashtra and Agriculture cum Solar Farm Scheme in Delhi. In this brief, we analyse different ownership structures and their impact on the discom revenue and farmers’ income through a case study approach. This issue brief covers the component A of the PM-KUSUM scheme and the Agriculture cum Solar Farm Scheme by the Government of Delhi.
We used data from the Tata Power Delhi Distribution Limited (TP-DDL) to assess the techno-commercial viability of solar agriculture micro-grids using cost– benefit analysis. The TP-DDL shared the relevant data in FY19–20 for the study.
We studied the impact of solar micro-grids for different business models in TP-DDL licensee area, which supplies power in north and north-east Delhi. The share of agriculture in total sales is abysmal (DERC Tariff Orders FY15-FY21) (i.e., 0.17–0.20 per cent)9 , which leads to revenue loss for the discom. The quantum of agriculture sales has remained almost stagnant between 12 and 14 MU over last few years and so has the sanctioned load, which is about 28 MW. The tariff design in Delhi is similar to many other states. Agricultural consumption is heavily subsidised, as electricity tariffs are much below the ACoS. In fact, the retail tariff for the agriculture category fell by almost 80 per cent in 2019 and has remained unchanged. Insights from the case study could help other states to adopt strategies and business models for the uptake of solar in the agriculture sector. The power is supplied primarily for tube-well irrigation, threshing,10 and kutti cutting.11 Figure 1 shows the trends in agriculture sales, retail tariffs, and the ACoS.
Market challenges such as higher capital investment, fragmented nature of the business, and lack of awareness about the processes can restrict the uptake of solar for the agriculture sector. Solarisation of feeders can be done under different business models to address some of these market challenges. The PMKUSUM scheme has also proposed variations in the ownership structures: farmer-owned, third-partyowned, and discom-owned systems. Some states have also notified schemes for solarising agriculture feeders. For instance, Agriculture cum Farmer Scheme in Delhi allows developers to set up solar plants on the farmer’s land and sell the generated power to government departments. The plant could either be set up on a barren/uncultivable land or in farmer’s field. However, the analysis assumes the plant is set up on the farmer’s land with an elevated structure so as to not affect the farming activity. The generation from the plant is fed into the distribution network. If the feeder load demand exceeds generation, shortfall in supply is met through grid electricity. At times, when the generation is more than the feeder load demand, surplus electricity is fed into the distribution network. The business models vary primarily on ownership of the system, and depending on the ownership, the net benefits to different stakeholders and financing requirements vary significantly.
In this section, we review different business models, their benefits and challenges, and provide recommendations to scale up each of these models.
In this model, an individual farmer or a group of farmers (such as Farmer Producer Organisations) build, own, and operate the solar plant situated closer to their serving feeder. The project is partially funded by farmers’ equity (30 per cent) and the rest of the investment is financed by lenders such as the bank. Farmers enter into power purchase agreement (PPA) with the discom and earn additional revenue by selling the power at a pre-determined tariff (Figure 2).
Benefits of the model
Challenges in scaling up
Figure 2 Farmers sell all the electricity generated by the solar plant at the PPA tariff to the discom
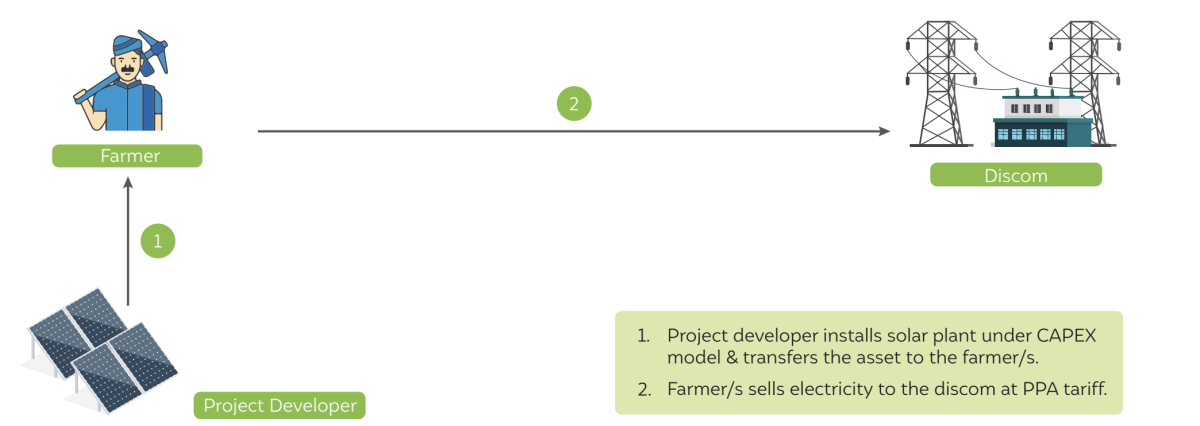
Source: Authors’ analysis
Figure 3 Project developer pays land rent to the farmer and sells generation from the plant to the discom at the PPA tariff
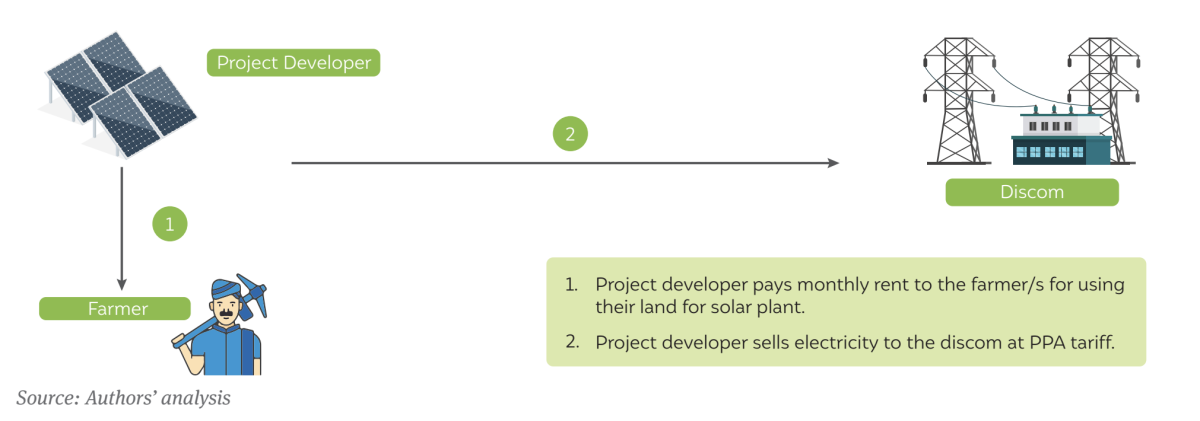
Source: Authors’ analysis
In this model, a private project developer is selected through competitive bidding to build, own, and operate the plant for 25 years. The project is partially funded by the developer’s equity (30 per cent) and leverages the remaining capital cost from the banks. The developer signs a power purchase agreement (PPA) with the discom and sells the entire generated power at a tariff discovered during the bidding process. Farmers earn additional revenue by leasing the land to the developer through an agreement (Figure 3).
Benefits of the model:
Challenge in scaling up
Land lease at a rate that is fair relative to the monthly income of the farmers would increase the solar tariff significantly
In this model, the discom builds, owns, and operates the plant for 25 years. The project is partially funded by the discom’s equity (30 per cent) and the remaining capital is borrowed from the banks. There is no power purchase agreement as the discom itself is the power generator. Savings realised through low-cost solar power reduces the cost of supply to the discoms and benefits can be passed on to the consumers, thereby lowering the cost of supply to the agricultural consumers. Farmers earn additional revenue by renting the land to the discom through an agreement (Figure 4).
Figure 4 The discom-owned asset feeds generation in the grid
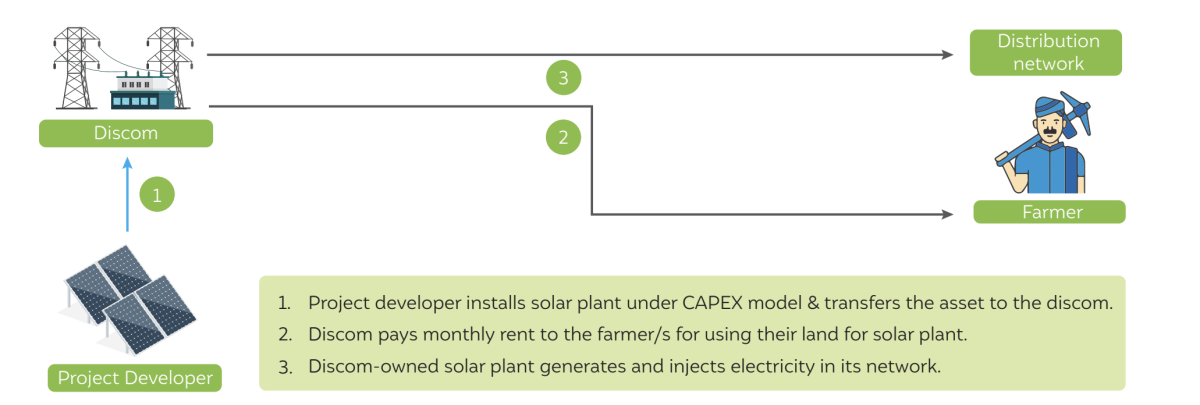
Source: Authors’ analysis
Benefits of the model
Challenges in scaling up
In this model, a third-party project developer builds, owns, and operates the plant on the farmer’s land. The developer also contributes an equity and gets the rest of the funding from the financial institutions such as the banks. Unlike the previous third-party owned model, the power generated is sold to consumers other than the discom (e.g. government departments, railways, or metro at a discovered tariff under virtual net metering). The discom levies applicable surcharges or parallel operation charges on the power transaction. Farmers are paid a lease amount per month for using the farm land for solar generation (Figure 5).
The Agriculture cum Solar Farm Scheme by the Delhi government proposes this business model and recommends lease payment and the free electricity to be provided to the landowner. Farmers are paid a monthly lease of INR 8,333 per month by the developers for the land use. The scheme also entitles farmers free electricity of 6,000 kWh per MW from the solar power plant annually. The developer puts up the plant on the farmer’s land at a minimum elevation of 3.5 metres so as to not hinder the farming activity. The model proposed under the scheme is essentially a renewable energy service company (RESCO)-based ownership, where the solar developer sells the electricity at a pre-determined rate to the government entities such as Delhi Jal Board, Health Department, and Public Works Department.
Benefits of the model
Figure 5 Project developer pays the land rent for the plant and sells electricity to government entities under virtual net metering
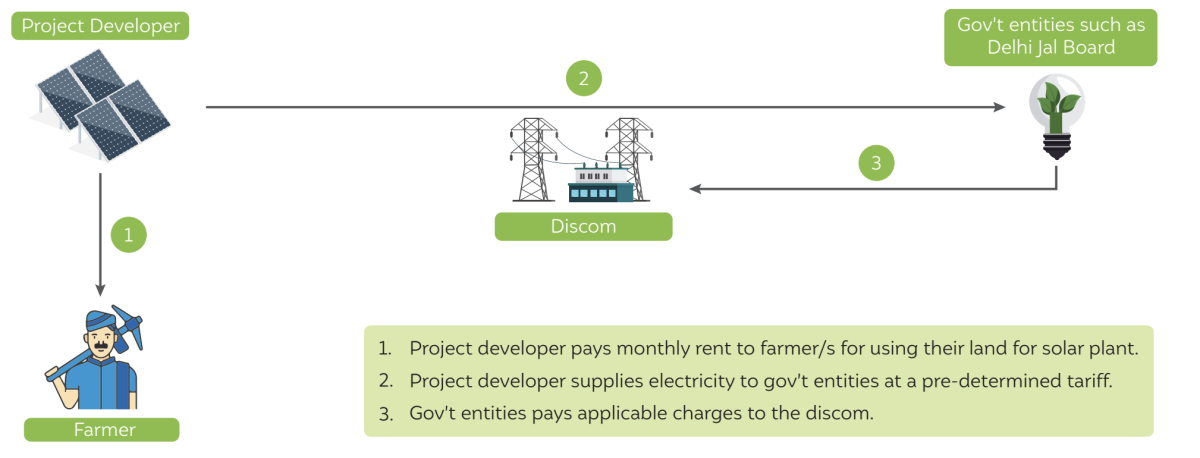
Source: Authors’ analysis
Challenges in scaling up
The case study assesses the techno-economic impact of solar micro-grid on the farmer’s revenue, the discom business, and on feeder load profile in Narela district (zone 514) in North Delhi.12 We compute the levelised cost of solar generation (LCoE) using the discounted cash flow method under four ownership models described in section 2. The assumptions for LCoE calculations are shown in Annexure A. We also quantify broader system-level benefits of solar plants injecting power into the selected feeders of the discom (in INR per kWh and in INR lakh). These benefits are computed over the lifetime of the solar plant (25 years) and brought to present value terms. The benefits are indicated in Figure 6. Since the analysis is done for FY 19–20, when the floor price of renewable energy certificate (REC) was set to INR 1 per kWh and when the market was functional, we have used INR 1.12 per kWh as the REC cost incurred on TP-DDL based on our analysis of the tariff order. We then compare the system-level benefits with the cost of solar generation, to arrive at net benefits and reduction in the cost of supply (INR per kWh and INR lakh) spread over 25 years. The monetary benefits to farmers are also estimated under all ownership cases.
Figure 6 Costs and benefits to the discom of a solar plant connected to the agriculture feeder
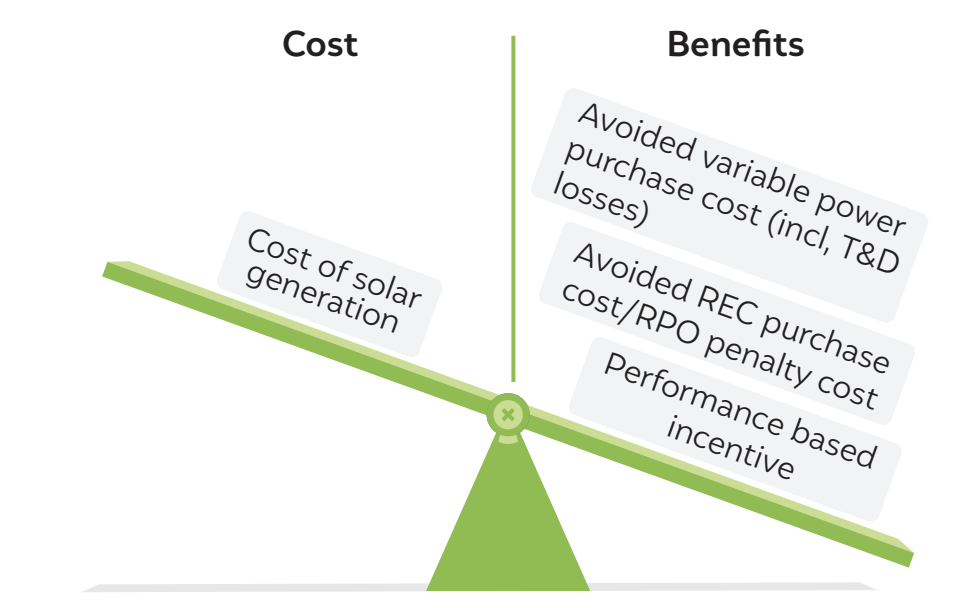
Source: Authors’ analysis
The solar micro-grid of size 1 MW has been considered for our techno-economic analysis. The plant is connected directly to the feeder substation of the licensee and injects power into the grid. The analysis has been carried for two demand scenarios: (i) when the agriculture load is supplied power only during daytime (6 a.m. to 6 p.m.) and (ii) when the load is supplied power round the clock. Figure 7 shows the schematics of solar micro-grid. As in many states, the agricultural load is fed on roaster basis—daytime supply on some days/week and night time supply on the other days. We have considered the impact of time of pump usage on the net benefits to the discom and reduction in cost of supply to the farmers by the discom. Figure 8 shows the load profile of a sample distribution transformer (DT) in the TP-DDL region.
Figure 7 Schematic representation of a typical solar feeder micro-grid
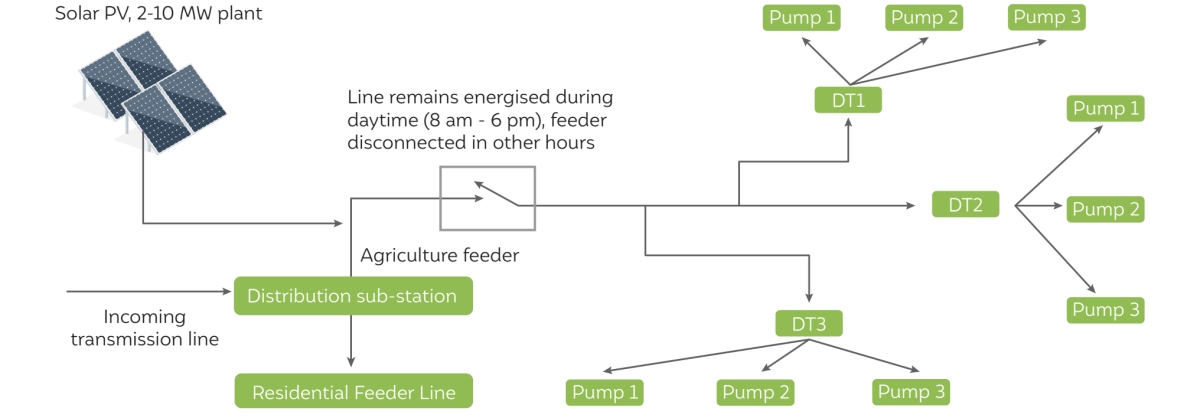
Source: Prayas Energy Group (Solar Feeder)
Figure 8 Agriculture load on a selected DT in TP-DDL licensee area
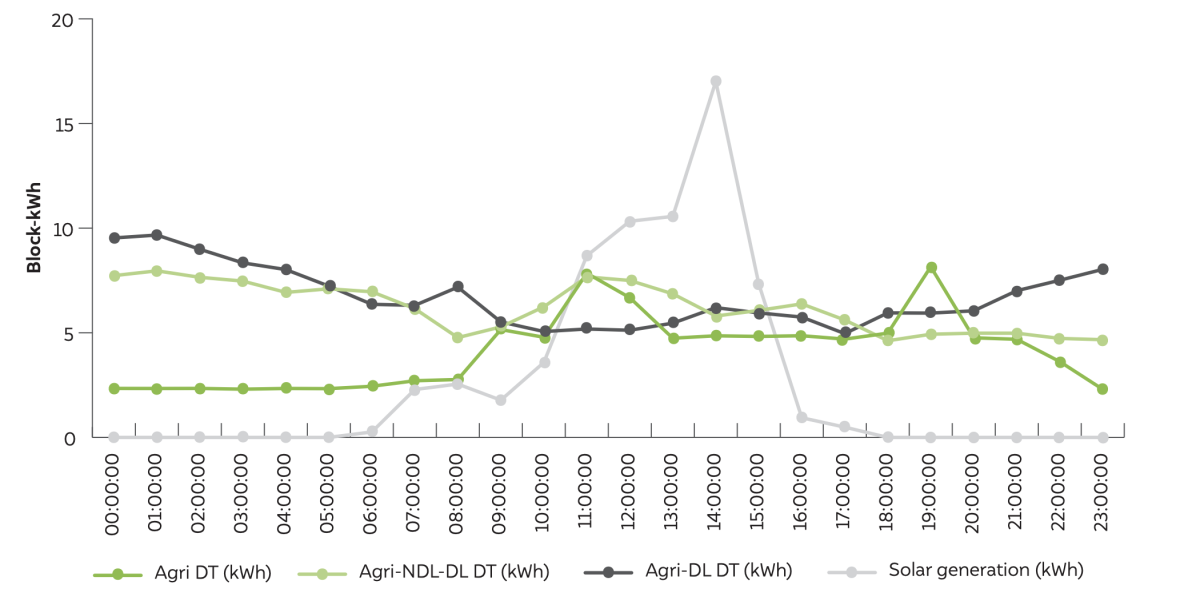
Source: Authors’ adaption from TP-DDL data
In this section, we present the economic viability of four business models: farmer-owned system, third-party owned-owned system selling power to the discom, thirdparty owned systems selling power only to government entities, and the discom-owned system. We also test the impact of time and duration of the agricultural load and system size on the economics of the solar plant. The impact on farmers’ income under four business model is also analysed in the section.
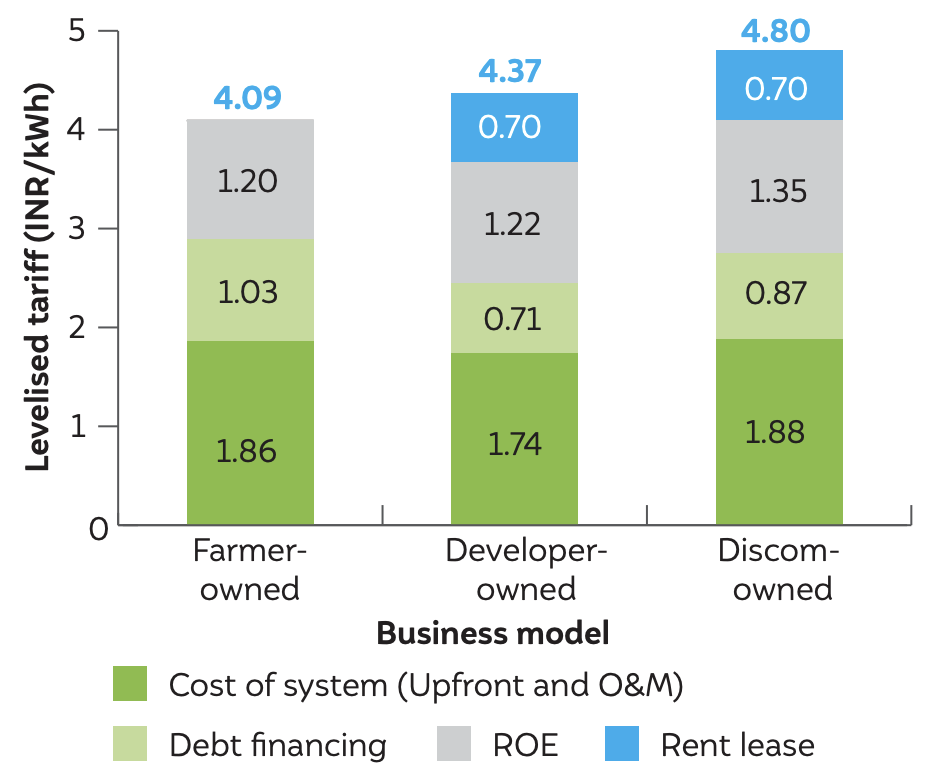
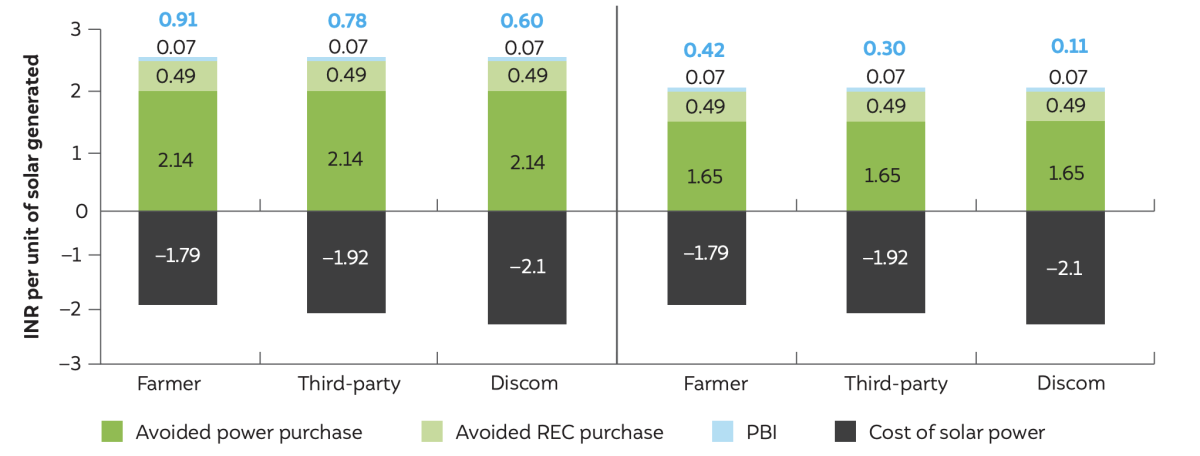
Figure 9 Farmer-owned system is the cheapest way to generate power
Source: Authors’ analysis Note:
Values in blue font indicate ‘LCoE’
Figure 9 compares the LCoE for different business models. For farmer- and discom-owned systems, the cost of procuring components such as modules, inverters, and wires would be higher than for third-party owned systems because the former would be procuring them at the market price while the latter would do so at wholesale quantum, giving cost advantage for the third-party owned systems. Additionally, developers can raise capital at more attractive interest rates due to better credit rating compared to farmers and the discoms. Therefore, comparatively, the cost of debt is least in third-party owned systems. The developers operate their businesses on a thin margin due to sharp competition and thus give lowest return on equity compared to other ownership structures. Return on equity for the discoms and the farmers would be based on the regulated return on equity based on prevalent feed-in tariff and thus appears to be higher than in the developer-owned system. Yet, farmer-owned models are likely to fetch the lowest levelised tariff as the lease rent for other models increase the tariff by around 17–28 per cent (adding about 0.7 INR/kWh). The savings on land lease offsets the increase in input prices and other financial costs, making farmer-owned system cheapest in INR per kWh terms among the business models.
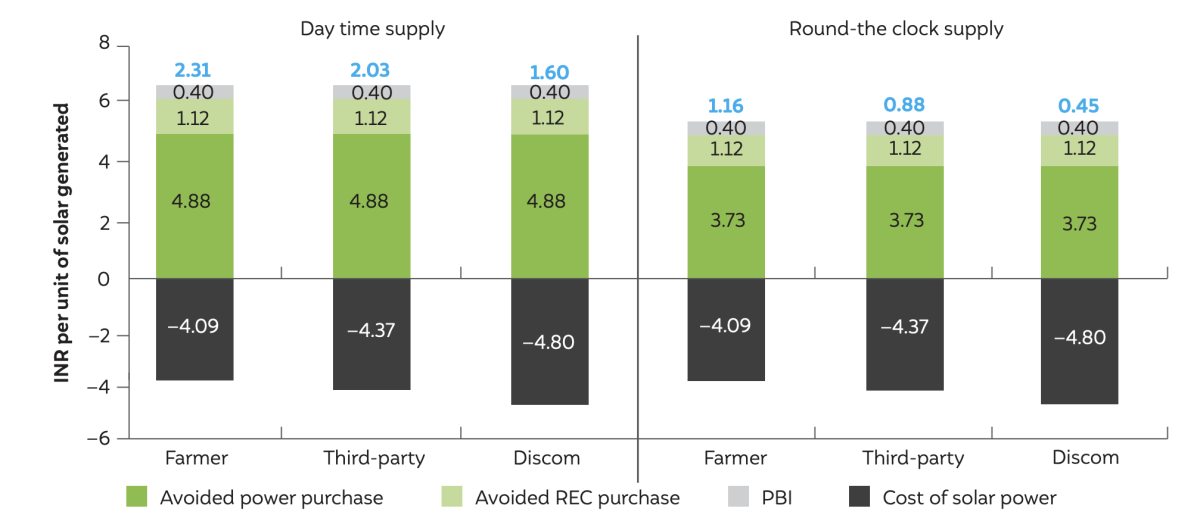
Figure 10 Farmer-owned system supplying agriculture load in daytime gives maximum reduction in cost of supply in the first year
Source: Authors’ analysis
Note: The values in blue font indicate ‘Net reduction in cost of supply’.
Figure 10 shows the reduction in cost of supply (CoS) to agricultural consumers in the first year across three business models and for two load supply durations: day time and round-the-clock supply. Benefits like performance-based incentive (PBI) and avoided REC purchase (or avoided RPO penalty cost) are related to annual generation, which remains the same across all the cases. The variable cost of the marginal generator that supplies power during daytime is observed to be higher than the variable cost during night time.
The discom could save on power purchase expenses by shifting the supply during daytime. The highest reduction in CoS is seen in farmer-owned systems, as they yield lowest solar tariff among other ownership structures. Farmers can earn additional revenue by selling power to discoms. However, system ownership requires capital investments, debt servicing, and O&M expenses, which reduce net income for the farmers.
Figure 11 compares net benefits for the discom under three business models and for different supply durations over the period of 25 years. The discom could save more on power purchase expenses and meet the RPO targets if the agriculture load is supplied during daytime across all the business models. The average power purchase cost incurred to the discom during daytime is observed to be higher than the average power purchase expenses incurred for round-the-clock procurement. Avoided REC purchase cost and PBI are directly linked to the solar generation, and therefore their contribution to the net benefits remains the same (INR 0.56 per kWh) across all the business models and supply durations. In absence of functional REC markets, the avoided REC component can be treated as avoided RPO penalty cost. Our analysis considers INR 1.12 per kWh as avoided RPO penalty cost. Farmer-owned systems give maximum net benefits to the discom, as they yield lowest tariffs across three business models.
Figure 11 Discom realises highest net benefits over the lifetime when a farmer-owned system supplies the agriculture load during day time
Source: Authors’ analysis
Note: The values in blue font indicate ‘Net benefits over the lifetime’.
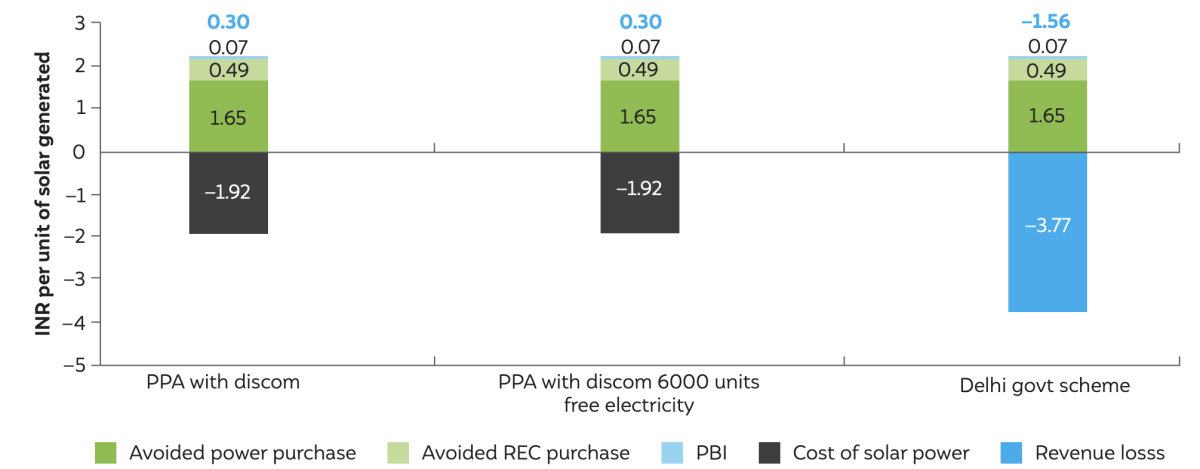
Figure 12 The discom incurs revenue loss under agriculture cum solar farm when the developer sells power to the government entities through net metering
Source: Authors’ analysis
Note: The values in blue font indicate ‘Net revenue loss’.
Under Agriculture cum Solar Farm Scheme, the developer sells electricity at a competitively determined tariff to government entities under RESCO arrangement. The entities such as Delhi Jal Board and Public Works Department reduce their electricity bills through virtual net metering, as their commercial rates are higher than the solar tariffs. This results in a net loss to the discom (INR 1.56 per kWh) as it loses on premium sales (Figure 12).
The scheme also mandates free electricity up to 6,000 kWh per MW per year to the farmers, which reduces subsidised sales of the discom and gives a net benefit of INR 0.30 per kWh similar to the simple arrangement where the discom signs a PPA with the developer and buys power at a competitively determined tariff. It is noted that the avoided power purchase expenses, RPO compliance costs, and PBI are linked to solar generation and thus remains the same across different cases considered.
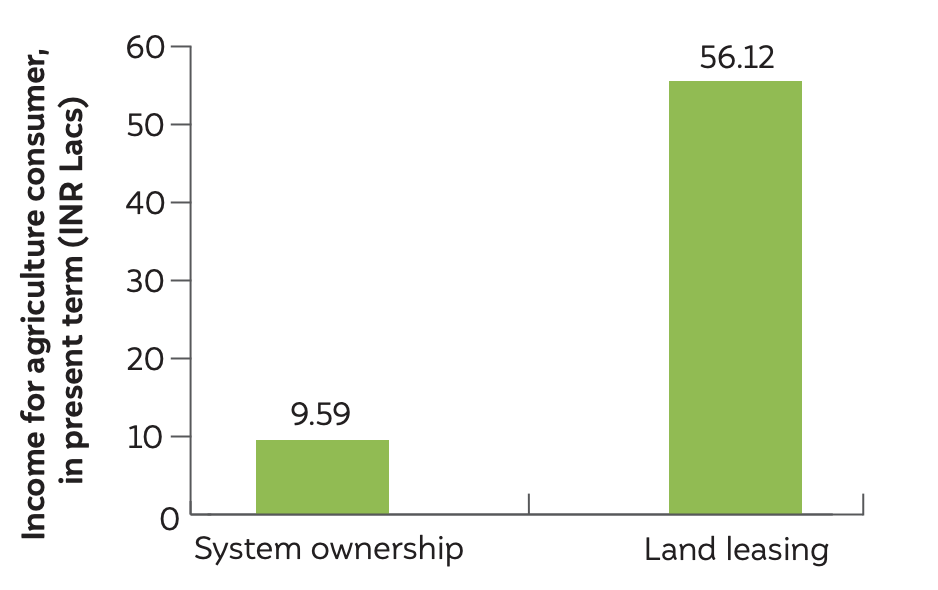
The scheme provides for INR 8,333 per month per acre to the farmers as rent, which would escalate at 6 per cent a year, and 6,000 units of free electricity a year from the solar plant in case the farmer leases land. This means that the farmers could deploy their equity for other productive purposes in the farming activities. As seen in Figure 13, the income from land leasing is seen six times more than the income from system ownership. Therefore, land leasing is a more beneficial proposition for farmers to earn additional income without much effort.
Figure 13 System ownership is less beneficial to farmers over the 25 years
Source: Authors’ analysis
TP-DDL can benefit from solarising the agriculture load, as it would help reduce the subsidised sales of the discom. Given the similar tariff design for the agriculture in Delhi, insights from the study could be applied for the national or state-level schemes.
Agarwal, Shalu, and Abhishek Jain. 2018. Financing Solar for Irrigation in India: Risks, Challenges and Solutions. New Delhi: Council on Energy, Environment and Water
Aggarwal, Prateek, Anjali Vishwamohan, Danwant Narayanswamy, and Shruti Sharma. 2020. Unpacking India’s Electricity Subsidies: Reporting, Transparency and Efficacy. Winnipeg: International Institute of Sustainable Development.
Department of Power, Government of National Capital Territory Delhi. 2018. Agriculture cum Solar Farm Scheme in NCT of Delhi. New Delhi: Department of Power, Government of National Capital Territory Delhi.
DERC Tariff Orders. FY15-FY21. Tariff Orders for Tata Power Delhi Distribution Company Ltd (TPDDL). New Delhi: Delhi Electricity Regulatory Commission.
Food and Agriculture Organisation . 2017. “India at a Glance.” Food and Agriculture Organisation of the United Nations. Accessed February 12, 2021. http://www.fao.org/india/fao-in-india/india-at-aglance/en/.
Ministry of New and Renewable Energy. 2019. “Guidelines for Implementation of Pradhan Mantri Kisan Urja evem Utthan Mahabhiyan.” Ministry of New and Renewable Energy. September 22. Accessed 15 February, 2021. https://mnre.gov.in/img/documents/ uploads/8065c8f7b9614c5ab2e8a7e30dfc29d5.pdf.
Ministry of Statistics and Programme Implementation. 2021. Energy Statiatics—2021. New Delhi: Ministry of Statiatics and Programme Implementation.
National Sample Survey Office. 2013. Situation Assessment Survey of Agricultural Household. 70th Round Report, New Delhi: Ministry of Statistics and Programme Implementation.
Maximising Rooftop Solar Performance by Enabling a Robust O&M Ecosystem
What Drives Rooftop Solar Installation Decisions in Indian Homes?
Building a People-centric Energy Future:
Roadmap of the methodology to assess the climate co-benefits of the SUP ban in Tamil Nadu