Council on Energy, Environment and Water Integrated | International | Independent
Suggested citation: Prabhu, Shravan, Keerthana Anthikat Sukesh, Srishti Mandal, Divyanshu Sharma, and Vishwas Chitale. 2025. How Extreme Heat is Impacting India: Assessing District-level Heat Risk. New Delhi: Council on Energy, Environment and Water.
This study maps heat risk across 734 districts of India using 35 indicators spanning hazard, exposure, and vulnerability. Going beyond just daytime temperatures, it includes night-time heat and relative humidity, offering a clearer picture of how climate change has altered the frequency, intensity, and duration of heat hazard from 1982 to 2022. Using high-resolution IMDAA climate data (12 km), satellite imagery, and the latest socio-economic and health datasets (NFHS 2019–21, Census 2011), the study identifies areas most at risk from this growing ‘invisible disaster’.
With many of India’s first-generation heat action plans (HAPs) lacking detailed risk assessments—and with heatwaves now eligible for funding under the State Disaster Mitigation Fund (SDMF)—the study calls for heat risk-informed planning. It also provides state and UT-wise handbooks to support local governments in prioritising and implementing targeted solutions.
The views expressed in this report are those of the authors and do not necessarly reflect the views or policies of the Council on Energy, Environment and Water (CEEW). This independent academic study was conducted for 734 districts across all the Indian States and is based entirely on open-access data sourced from publicly available sources. Government stakeholder consultations and state government data was not a part of the process of this study. The state-level findings will be ground-truthed through further validation in due course.
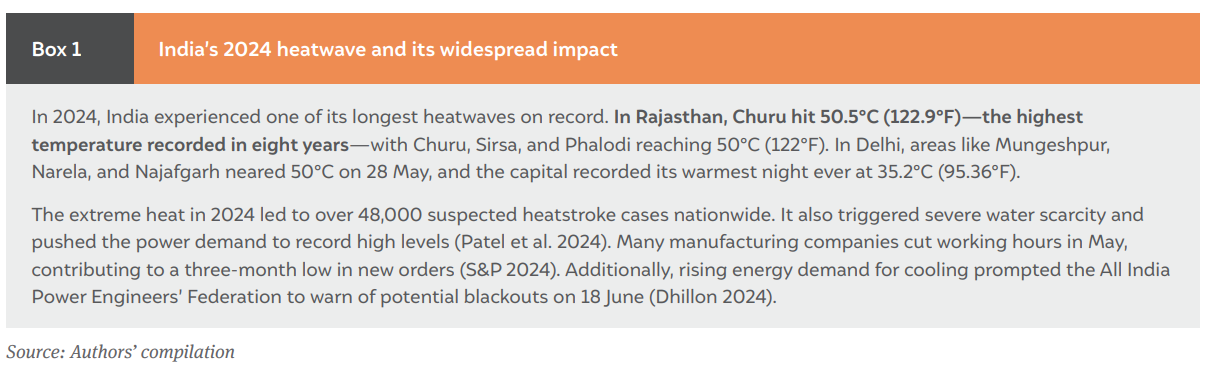
Extreme heat broke all records in 2024, which was recognised globally as the hottest year since records began. Asia, which accounted for 45 per cent of global heat-related deaths between 2000 and 2019, and India, where over a billion people face heatwaves annually, remain among the most affected regions (WHO 2024; IMD 2023). In 2024, India experienced its longest recorded heatwave since 2010. Many states experienced daytime temperatures of over 40°C for an entire month, leading to more than 44,000 cases of heatstroke (Patel et al. 2024). By April 2025, more than 10 states had already experienced severe heatwaves.
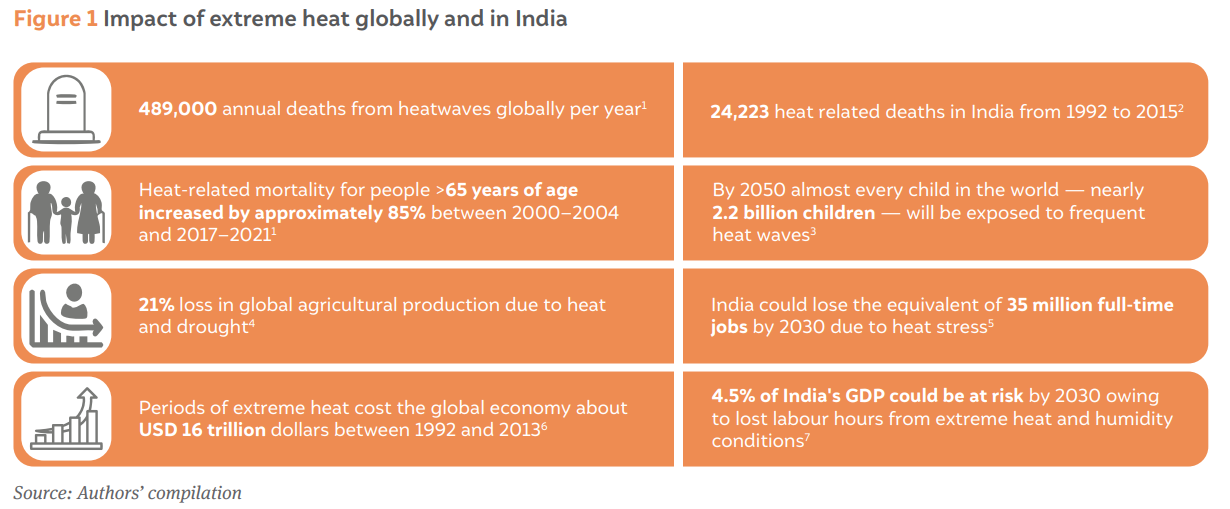
Extreme heat is already having a multifaceted impact on day-to-day life, straining public health systems, pushing power demand to record highs, damaging crops, depleting water resources, and reducing the productivity of humans, livestock, and agriculture. Due to heat stress, India could lose the equivalent of 35 million full-time jobs and experience a 4.5 per cent reduction in GDP by 2030 (Kjellström et al. 2019).
At this juncture, India must rapidly scale up its heat resilience. To achieve this, a granular, data-driven understanding of the heat risk faced by every district in the country is one of the first and most crucial step.
Heat is often called an invisible disaster because it does not leave behind physical destruction, making it harder to measure its impact.
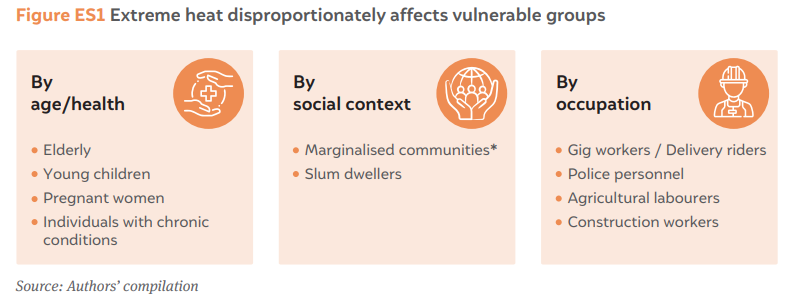
Heat risk depends on three interlinked factors: i) the intensity of heat and compounding factors such as rising relative humidity; ii) the number of people exposed and their geographic distribution; and iii) the vulnerability of those exposed. Extreme heat does not affect everyone equally. However, most existing studies address only isolated aspects of the problem—by mapping temperature trends, estimating productivity losses, or analysing socio-economic vulnerabilities—resulting in a fragmented understanding of heat risk.
Second, India’s primary strategy for tackling extreme heat is through heat action plans (HAPs). These plans have reduced the occurrence of heat-related illnesses and mortalities in the last decade; however, they need further strengthening, since 95 per cent of HAPs lack a detailed assessment of heat risks and vulnerabilities (Pillai and Dalal 2023). This gap makes it challenging for authorities to pinpoint and prioritise high-risk areas and allocate financial resources effectively. This is particularly relevant as heatwaves, since 2024, are now eligible for financing under state disaster mitigation funds (SDMFs) (Ministry of Home Affairs 2024). Comprehensive risk assessment is a prerequisite to availing such funding and is key to implementing effective solutions.
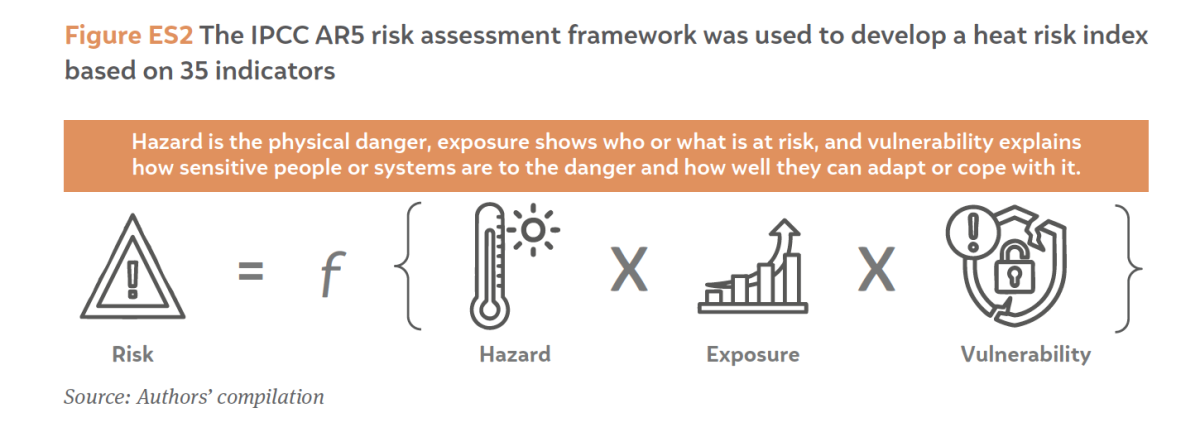
In this study, we have developed a heat risk index (HRI) for 734 districts in India to assess heat risk at the district scale. The index is based on the Intergovernmental Panel on Climate Change (IPCC) AR5 framework, which defines “risk as a combination of hazard, exposure, and vulnerability” (IPCC 2014).
In our HRI, we mapped long-term heat trends (1982–2022) using the Indian Monsoon Data Analysis and Assimilation (IMDAA)—a high-resolution climate dataset that breaks down India’s area into 12-km grids. Along with this climatological analysis, we used satellite imagery to map changes in 35 critical indicators (Table 3 to 5) pertaining to land use and land cover dynamics, human population and building density, distribution of water bodies, and green cover. We combined this with data on socio-economic and health vulnerabilities from the NFHS 2019–21 and Census 2011, which are the latest available datasets. Our analysis also integrated nighttime temperatures and relative humidity for a more comprehensive understanding of heat hazard beyond daytime temperatures.
To select the indicators and assign weights to them for the HRI, we consulted experts from research institutes and think tanks through a semi-quantitative method known as the analytical hierarchy process.
Indian cities are warming twice as fast as the rest of the country (Sethi and Vinoj 2024). However, we chose districts as our unit for analysis for two reasons: i) disaster risk governance and institutional responsibilities in India are anchored at the district level, making it a functionally appropriate scale for planning and implementation; and ii) consistent and comprehensive socio-economic and demographic datasets—particularly from Census 2011 and NFHS 2019–21—are available only at the district scale. Accordingly, we assessed heat risk in 734 districts in India based on the boundaries defined by the Survey of India’s geographic information system shapefile as of March 2025 (SOI 2022).
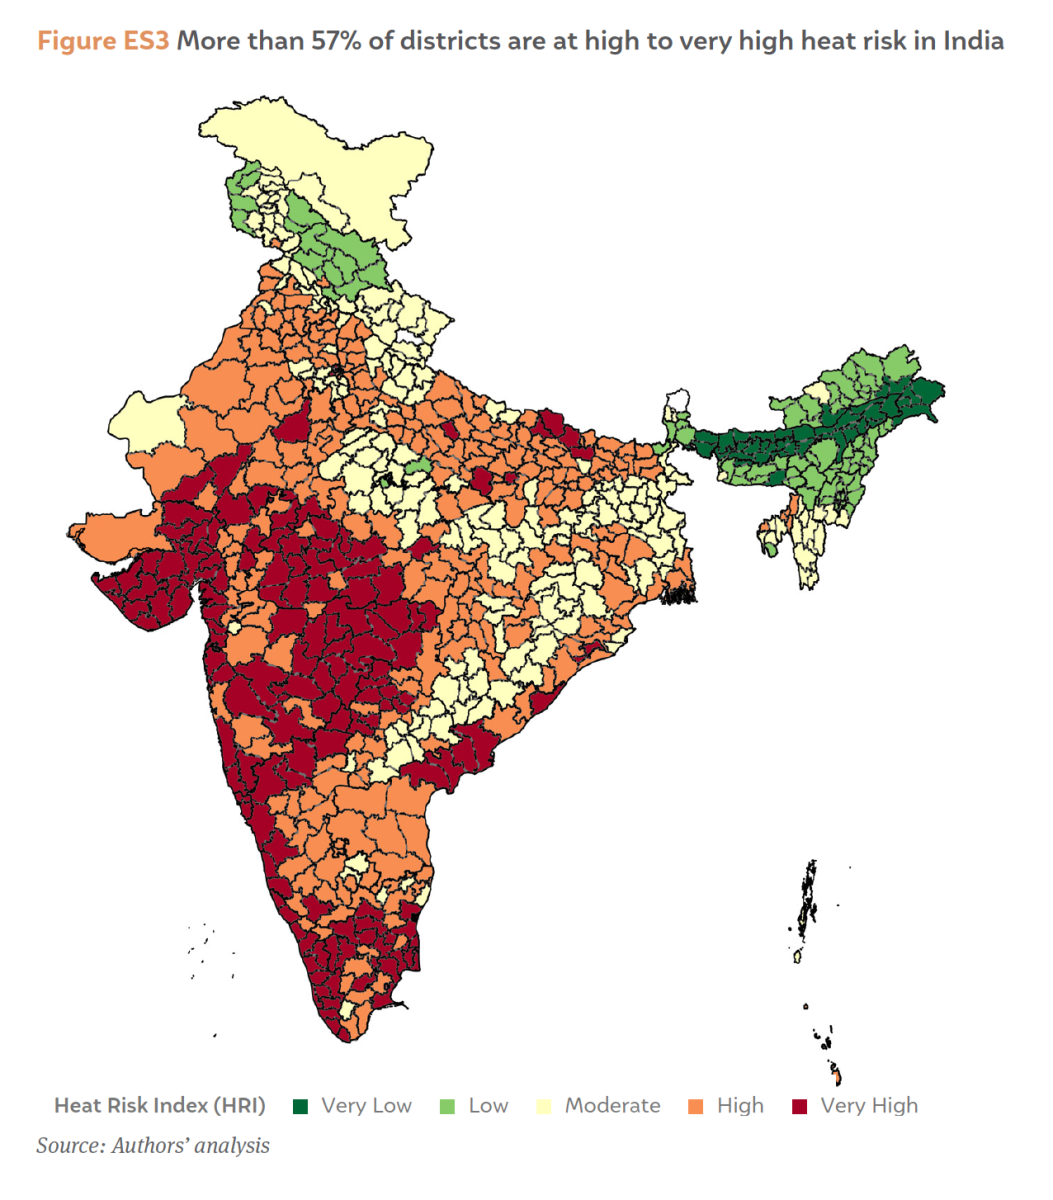
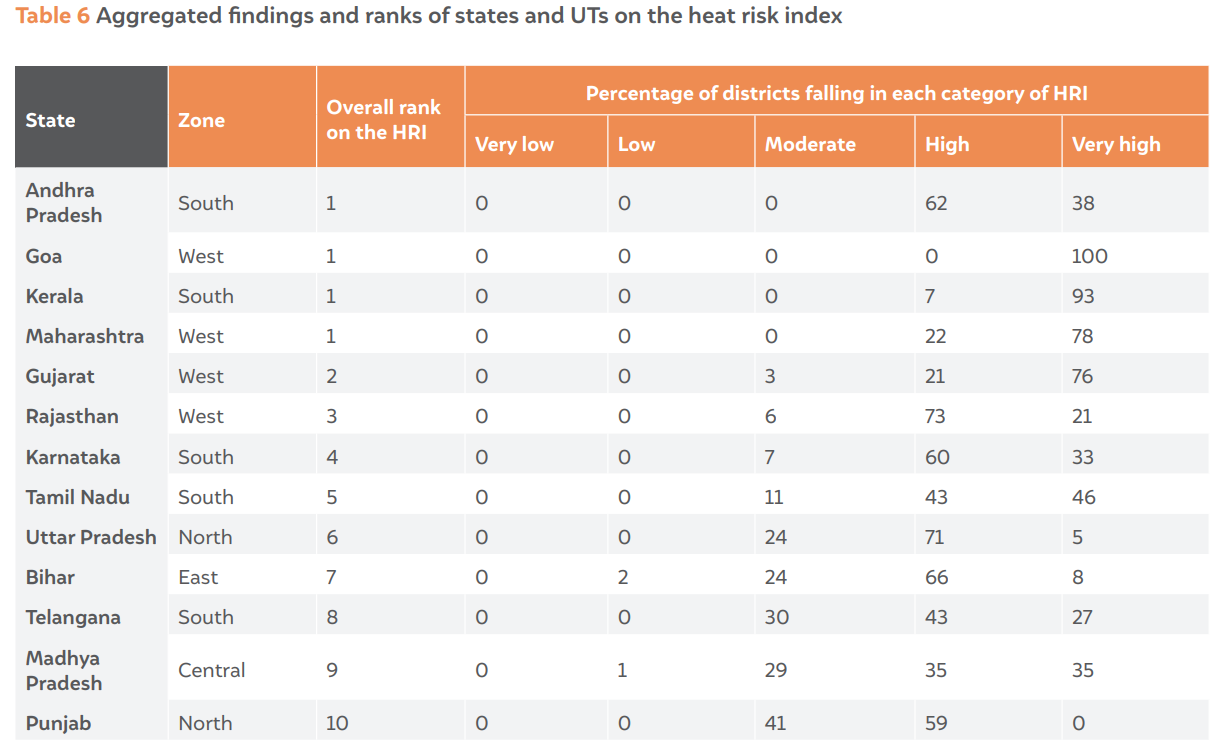
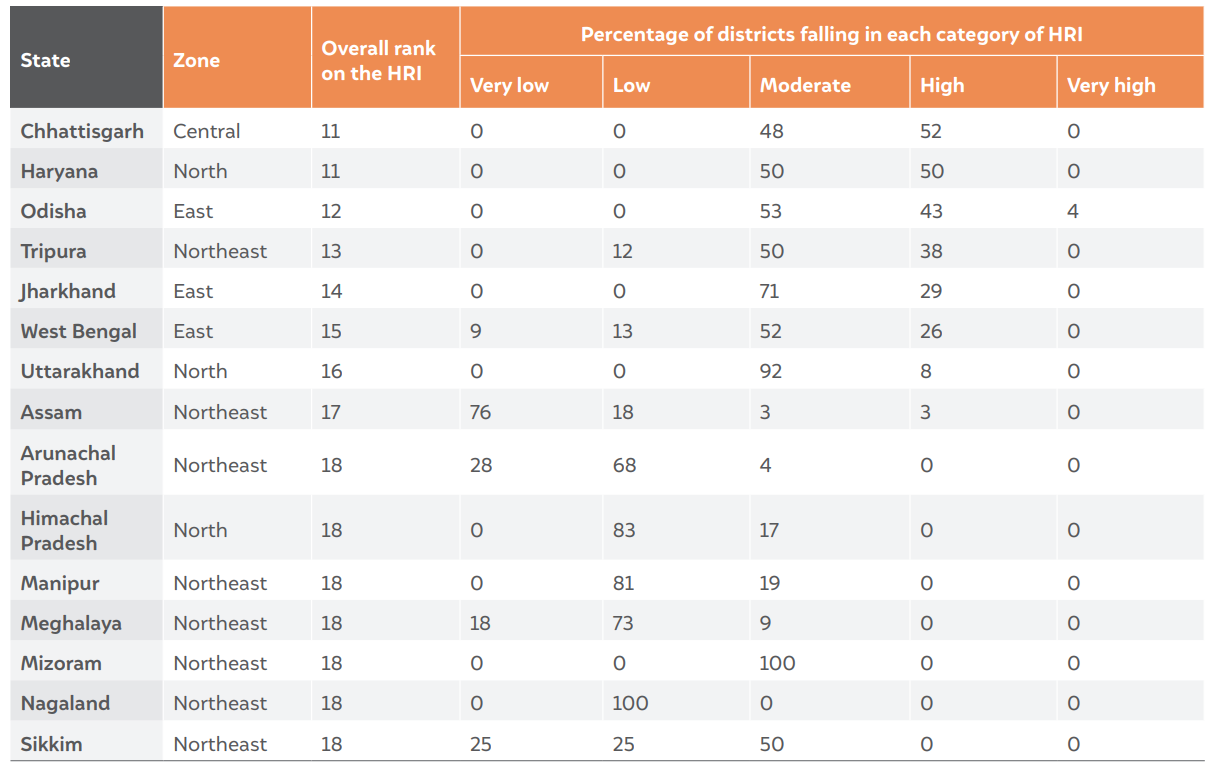
About 57 per cent of Indian districts, home to 76 per cent of India’s total population, are currently at high to very high heat risk. We found that 417 out of 734 Indian districts fell in the high and very high risk categories (151 under high risk and 266 under very high risk), as seen in Figure ES3. Moreover, 201 districts fell in the moderate category, and 116 fell in either the low or very low categories. This does not indicate that these districts are free of heat risk, but that it is relatively lesser than that of other districts.
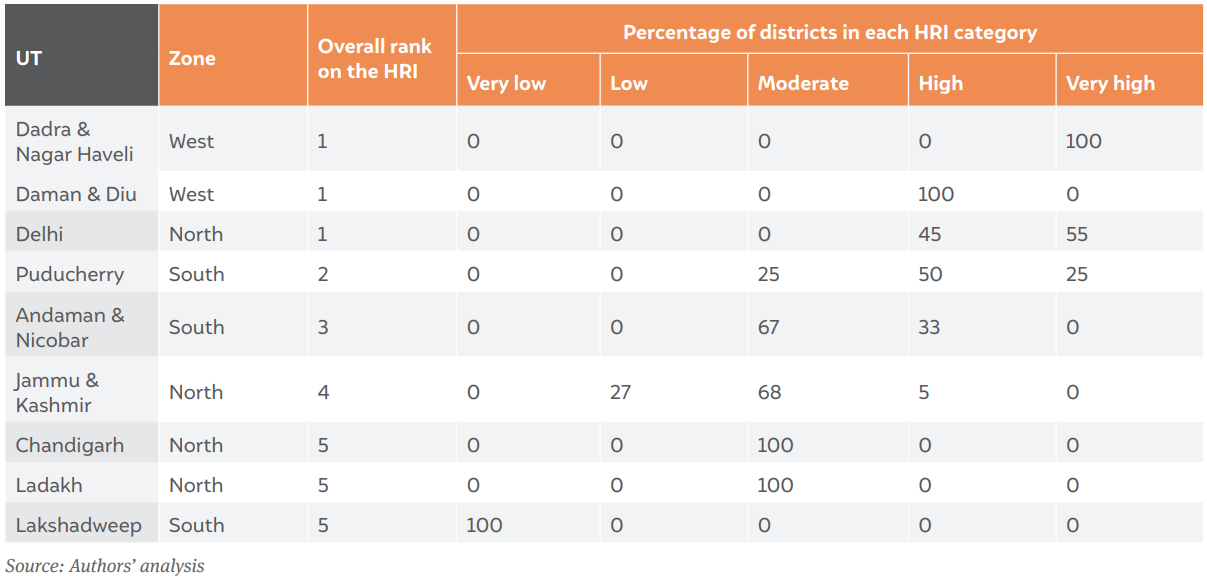
Aggregating these risks at the state level, we found that the ten states and UTs with the highest heat risk are Delhi, Maharashtra, Goa, Kerala, Gujarat, Rajasthan, Tamil Nadu, Andhra Pradesh, Madhya Pradesh, and Uttar Pradesh.
Decoding this further, we have identified key drivers that explain this risk and the factors contributing to high and very high risk levels.
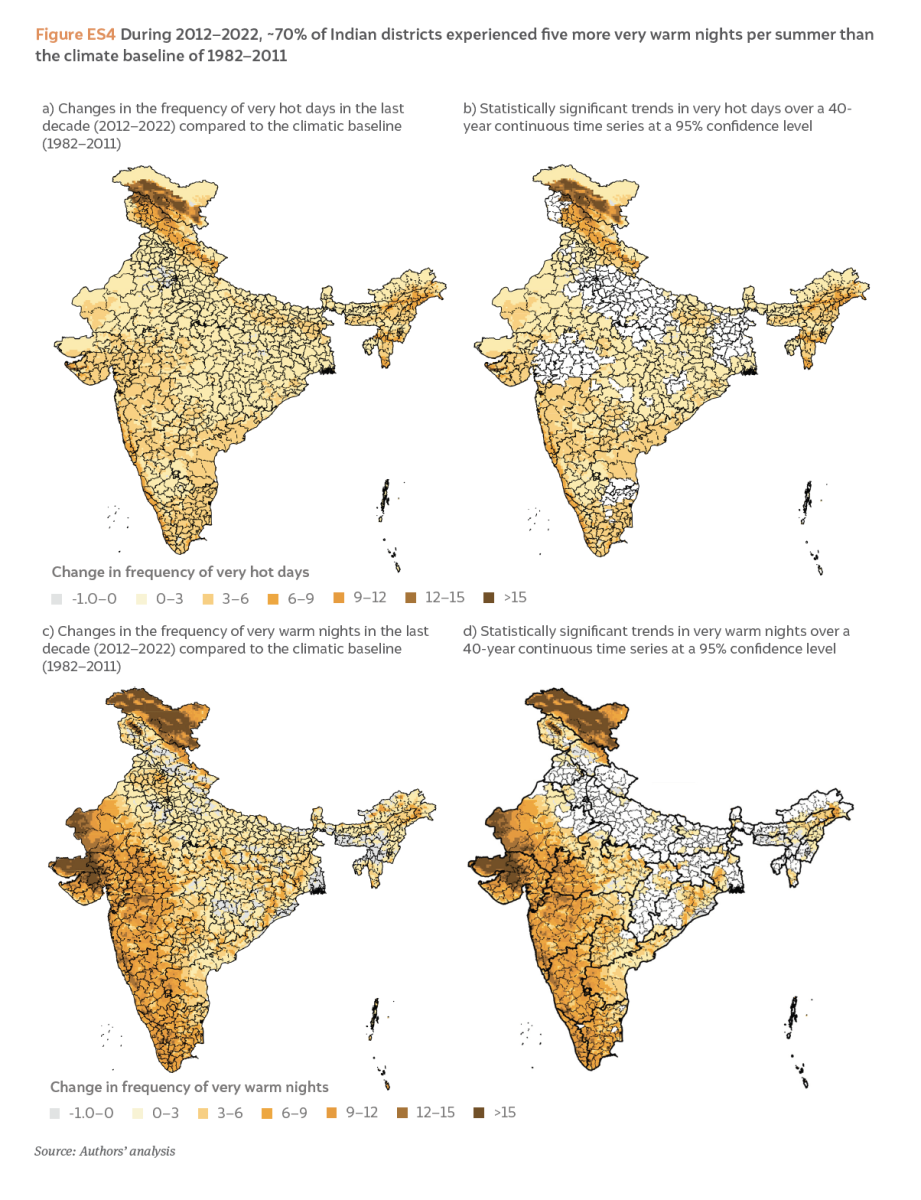
1. The number of very hot days is increasing in India, but concerningly, the number of very warm nights is increasing even more, creating health risks.
Over the last 40 years (1981–2022), heat extremes in India have increased linearly. This led to landmark heatwaves in 2013, 2016, 2019, 2022, and 2024. However, in the last decade, the number of very warm nights has been rising faster than that of very hot days. These nights and days are defined as periods when minimum and maximum temperatures rise above the 95th percentile threshold, i.e., what was normal for 95 per cent of the time in the past. Global weather patterns like El Niño and La Niña have also significantly affected the extent to which temperatures rise during the day and night (see Figure 3).
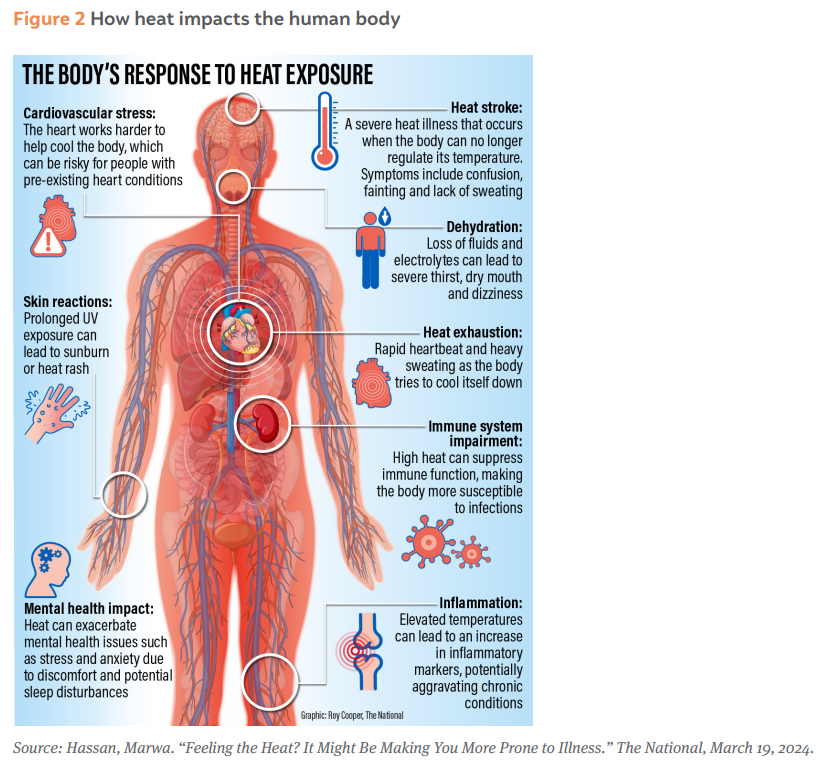
Warmer nights prevent the human body from cooling down after intense daytime heat. This significantly increases health risks such as heat strokes and worsens non-communicable diseases such as diabetes and hypertension. This is pertinent, especially for vulnerable populations such as children, the elderly, pregnant women, those from marginalised backgrounds, and those with existing chronic health conditions.
Our district-level analysis of the heat risk over the last decade (2012–2022) reveals shifting heat patterns across the 734 Indian districts as compared to the baseline of 1982–2011.
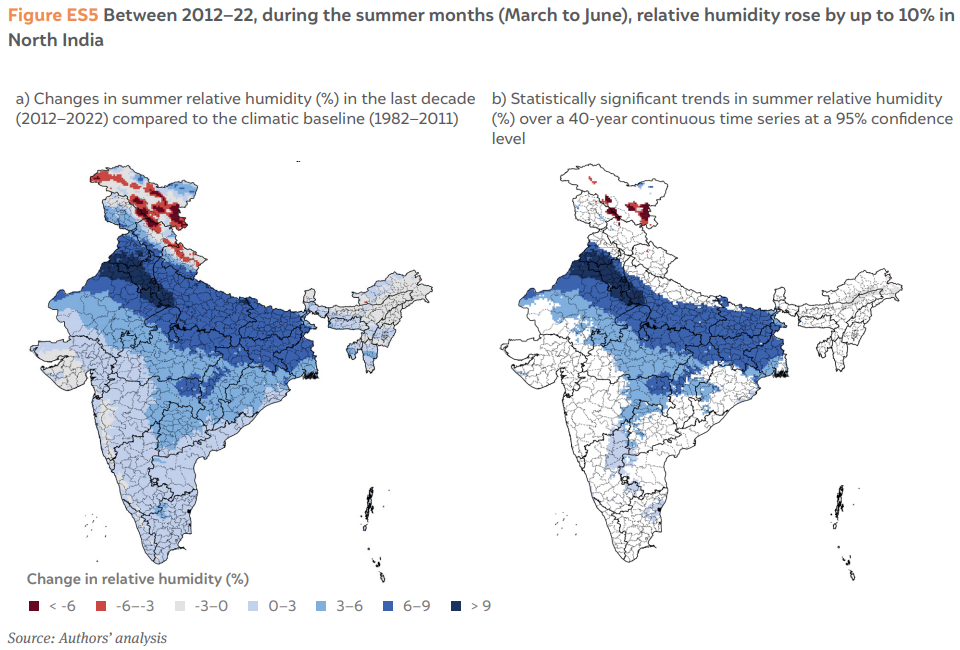
2. In the last decade, the Indo-Gangetic Plain experienced the highest summer relative humidity increase, exacerbating heat stress.
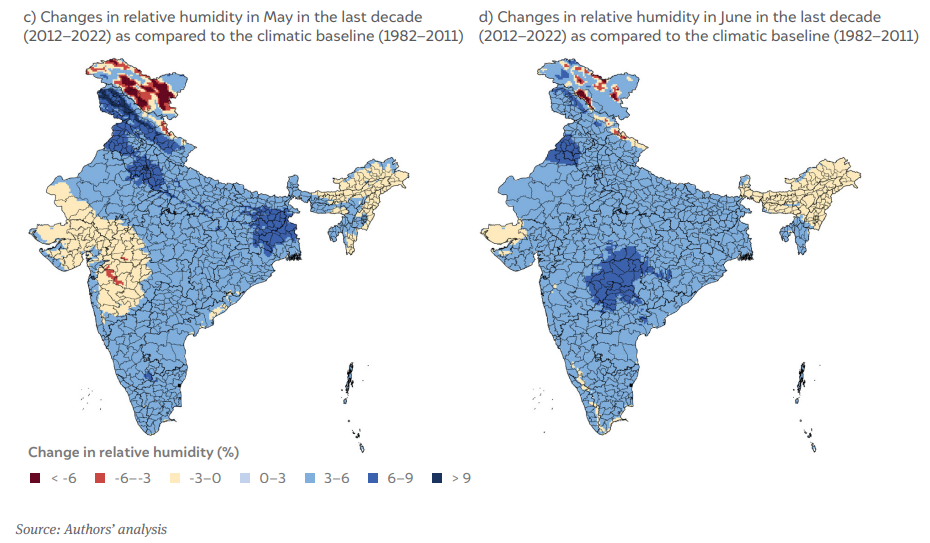
Increasing relative humidity is especially pronounced in North India, particularly across the agriculturally important Indo-Gangetic Plain (see ES Figure 5), where farm workers spend long hours outdoors. Cities like Delhi, Chandigarh, Jaipur, and Lucknow are also experiencing a 6 to 9 per cent rise in relative humidity. While coastal areas typically have 60–70 per cent relative humidity, North India used to have around 30–40 per cent during the baseline period. Over the past decade, this has increased to 40–50 per cent. Although humidity is highest during early mornings, when combined with high temperature, high humidity significantly worsens heat stress on the human body, especially during the peak summer months of May and June.
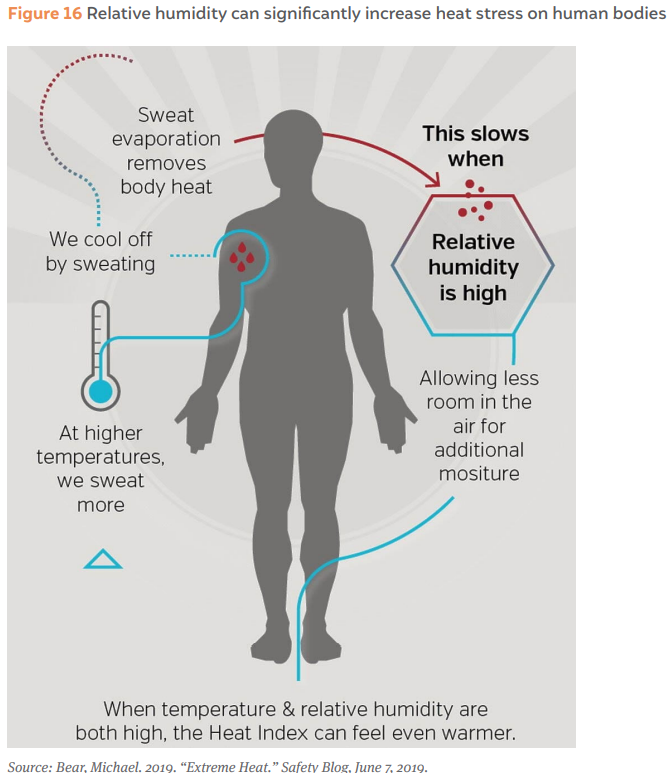
When the body temperature exceeds 37°C (or 100°F), sweating helps cool it down; however, high humidity slows this process, making it harder for the body to release heat (Baldwin et al. 2023). This can increase the occurrence of several heat-related illnesses at a faster rate.
3. Heat risk is caused by more than just temperature and relative humidity increases— dense buildings and existing socio-economic and health vulnerabilities make it worse.
We found that the following factors exacerbated the risk of very hot days, very warm nights, and relative humidity.
Our study provides actionable insights for heat risk—informed decision-making across various sectors, including water resources, agriculture, public health, and power. More importantly, we aim to support disaster management authorities at the state, city, and district levels in strengthening HAPs through a data-driven approach. By doing so, we aim to enable more efficient allocation of financial resources based on district-level heat risk factors.
Based on the findings from our assessment, we offer the following overarching recommendations.
1. States, districts, and cities should move beyond a narrow focus on daytime temperatures while planning for heat risk and incorporate additional dimensions of warm nights, humidity, demographic patterns, and health vulnerabilities.
Our review of publicly available HAPs from 15 states (as of January 2025) revealed that only Bihar and Andhra Pradesh have conducted any heat vulnerability mapping. To address this gap, we have developed simplified, ready-to-use handbooks for every state and UT (Annexure 1). These handbooks present district-level heat risk maps, outline key risk drivers, and offer a clear basis for improved decision-making and resource targeting.
Moreover, since last few years, the India Meteorological Department (IMD) has incorporated additional risk parameters such as percentile-based nighttime and day time temperature exceedance levels, hot and humid weather warnings into its multi-hazard meteorological forecasts. We recommend states, districts and cities should integrate these enhanced forecasts—in addition to the official heatwave criteria forecasts—into early warning systems and HAPs, to anticipate multi-sectoral impacts such as outbreaks of heat-related illnesses, power demand and ensure last-mile delivery of heat advisories and support services to vulnerable populations.
2. Utilise the state disaster mitigation fund (SDMF) for heat risk reduction
In 2024, the Ministry of Home Affairs (MHA) included heatwaves as nationally eligible disaster for receiving project-based funding under the SDMF (Ministry of Home Affairs 2024). SDMF has a national allocation of INR 32,031 crore for FY 2021–26 (15th FC 2020). This fund can be channelled towards heat risk reduction solutions including structural infrastructure (such as cooling shelters) as well as fund non-structural interventions (such as early warning systems and nature-based solutions). As per SDMF guidelines, comprehensive assessments of hazard, vulnerability, and risk is one of the most important step to identify at-risk areas and implement any solution. We urge SDMAs and state emergency operations centres to utilise our district-level analysis (Annexure 1) to identify high-risk geographies and prepare targeted proposals that are aligned with the framework issued by the National Disaster Management Authority (NDMA).
3. States where more than 50% of districts experience high or very high heat risk should formally notify heatwaves as a state-specific disaster
Doing so would unlock an additional 10 per cent of funds from the SDRF, thereby increasing the effective pool of disaster management funds to 30 per cent. These response funds can be channelled towards i) ex-gratia payments for heat related fatalities; ii) compensation for agricultural and livestock losses; and iii) capacity-building efforts for frontline workers. Many states such as Maharashtra, Tamil Nadu, Andhra Pradesh, Telangana and Madhya Pradesh have already formally notified heatwaves as a state-specific disaster, and other states with high risk should follow suit to bolster their fiscal capacity to enhance response mechanisms to extreme heat events.
4. Shift from heat-related economic loss absorption to risk-sharing through insurance mechanisms
Our spatial analysis of heat risk patterns reveals significant regional coherence within and across states. This presents an opportunity to transition from reactive expenditure to prearranged risk-sharing instruments such as parametric heat insurance. Parametric insurance is based on pre-defined temperature thresholds and can enable rapid disbursement of payouts following extreme heat events. Pilot initiatives already exist: Nagaland SDMA successfully accessed funds through a rainfall-based parametric trigger (Mixides 2025), and members of the Self-Employed Women’s Association in Ahmedabad availed of coverage linked to heat-specific parameters (Dickie, Jessop, and Patel 2023). Building on this model, we recommend developing regional parametric insurance mechanisms to enhance financial resilience and ensure timely compensation for heat-induced losses, particularly focusing on the livelihood losses for the outdoor workers.
5. The Centre should establish a national repository of heat action plans
During the course of this study, we found it challenging to evaluate the institutional adaptive capacity of districts due to the absence of HAPs in the public domain. To address this, we recommend creating an open-access, centralised, national-level HAP repository. This could be hosted by the NDMA and updated by the respective SDMAs. A national repository can help enhance transparency, facilitate cross-learning among states and districts, aid in monitoring implementation, and help identify gaps in the design and execution of HAPs.
The world is nearing the 1.5°C global warming threshold faster than anticipated, with 2024 being the hottest year on record globally and in India (WMO 2025; IMD 2025). This accelerated climate change disproportionately impacts developing nations such as India, increasing risks from extreme weather events. In Asia, which accounted for nearly 45 per cent of global heat-related deaths between 2000 and 2019, extreme heat-induced health impacts are a significant climate risk (WHO 2024).
India’s annual average temperature has increased by 0.15°C per decade between 1951 and 2016, (Krishnan et al. 2020). This has led to a non-linear increase in the impacts of extreme heat, such as the deaths of over 24,000 people due to heat from 1992 to 2015, despite the challenges in attributing heat deaths (NDMA n.d.). Globally, heatwaves remain the deadliest natural hazard, having claimed around 4,89,000 lives annually between 2000 and 2019 (UN 2024).
Note:
1) United Nations. Secretary-General’s Press Conference on Extreme Heat. July 25, 2024
2) National Disaster Management Authority (NDMA). Beating the Heat: How India Successfully Reduced Mortality due to Heat Waves. New Delhi: National Disaster Management Authority, Ministry of Home Affairs, Government of India, n.d.
3) United Nations Children’s Fund (UNICEF). The Coldest Year of the Rest of Their Lives: Protecting Children from the Escalating Impacts of Heatwaves. New York: UNICEF, 2022.
4) Ortiz-Bobea, Ariel, Trevor R. Ault, Carolyn M. Carrillo, Robert G. Chambers, and David B. Lobell. “Anthropogenic Climate Change Has Slowed Global Agricultural Productivity Growth.” Nature Climate Change 11 (2021): 306–12.
5) Kjellström, Tord, Nicolas Maître, Catherine Saget, Matthias Otto, and Takhmina Karimova. Working on a Warmer Planet: The Impact of Heat Stress on Labour Productivity and Decent Work. Geneva: International Labour Organization, 2019.
6) Callahan, Christopher W., and Justin S. Mankin. “Globally Unequal Effect of Extreme Heat on Economic Growth.” Science Advances 8, no. 43 (2022): eadd3726.
7) Woetzel, Lola, Dickon Pinner, Hamid Samandari, Hauke Engel, Mekala Krishnan, Brodie Boland, and Carter Powis. Climate Risk and Response: Physical Hazards and Socioeconomic Impacts. McKinsey & Company, January 16, 2020.
Heatwaves are often called ‘silent disasters’ because their lethal impact—ranging from severe heat stress to organ failure and death—usually goes unnoticed. Vulnerable groups such as children, the elderly, outdoor workers, pregnant women, and those with chronic conditions bear the brunt of these events (Nitschke, Tucker, and Bi 2007; Hansen et al. 2008). Beyond causing health crises, extreme heat can disrupt food security by reducing crop yields, lowering livestock productivity, and worsening water scarcity (Chaudhury, Gore, and Sinha Ray 2000; Dash and Mamgain 2011).
Extreme heat is a slow-onset hazard with uneven impacts across different population groups. Building resilience requires granular, local insights on the interplay of rising heat hazards, exposure levels, and inherent vulnerabilities. To strengthen decision-making, we have developed a district-level heat risk index (HRI) that offers a comprehensive view of heat risks, enabling targeted resilience-building strategies.
1.1 Understanding the difference between heatwaves, heat stress, and heat risks
Heatwaves, heat stress, and heat risks are related to extreme heat and are often used interchangeably. Though related, these terms are different from each other. Heatwaves do not have a universal definition. They are characterised by an unusually hot period, with different countries using varying criteria to measure these extreme weather events. In contrast, heat stress occurs when the body temperature exceeds 37°C in humans and animals—the temperature at which the body in unable to effectively remove excess heat. This causes discomfort, heat cramps, and exhaustion, and—in severe cases, when it exceeds 40°C— heatstroke. Heat risks arise from the interplay between the heat hazard (often intensified by factors such as high humidity and low rainfall), the exposure of people or systems, their vulnerabilities (shaped by socio-economic, physical, and institutional factors), and their capacity to adapt and cope.
Heatwaves—purely a weather phenomenon—lack a standardised measurement criterion and a globally uniform definition. The World Meteorological Organization (WMO) characterises a heatwave as “five or more consecutive days of prolonged heat in which the daily maximum temperature is higher than the average maximum temperature by 5°C (9°F).” However, the definition and criteria for gauging temperature extremes vary significantly worldwide. Further, they are tailored to local conditions based on climatological and impact criteria specific to each region (Alexander et al. 2006; Vose, Easterling, and Gleason 2005).
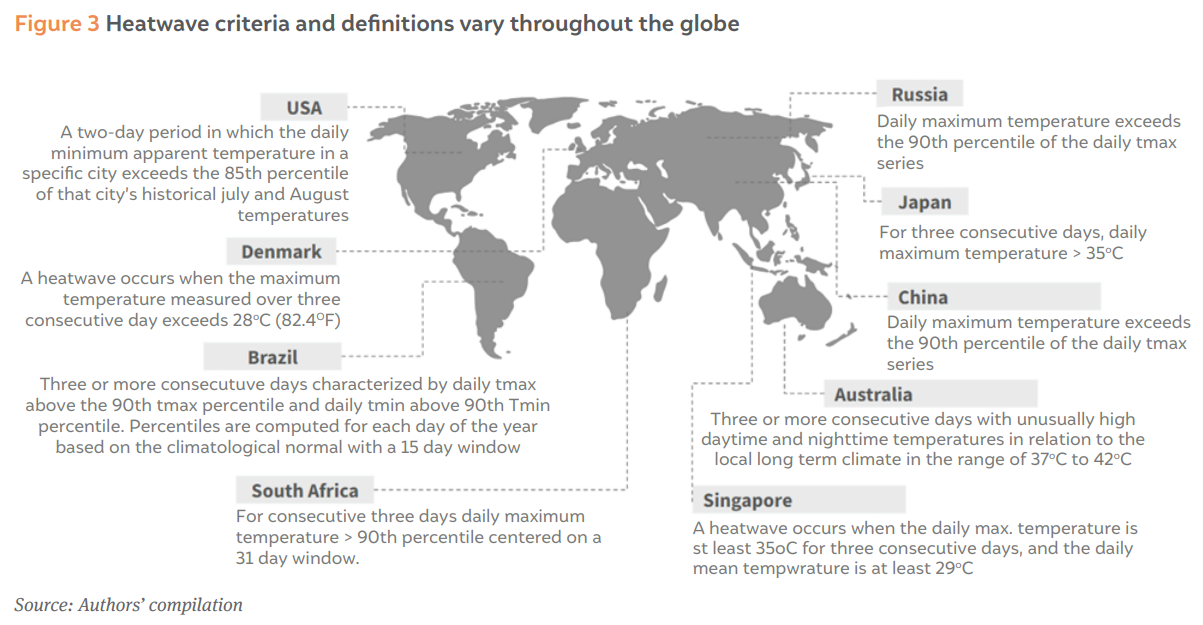
However, since last few years, the IMD has started issuing alerts based on district-wise percentiles—i.e., when the daytime and night time temperature reaches the 90th, 95th, and 98th percentiles, alerts are issued accordingly. The IMD also provides hot and humid weather and warm night forecasts as part of its mult-hazard forecast system.
1.2 State of heatwaves and extreme heat in India
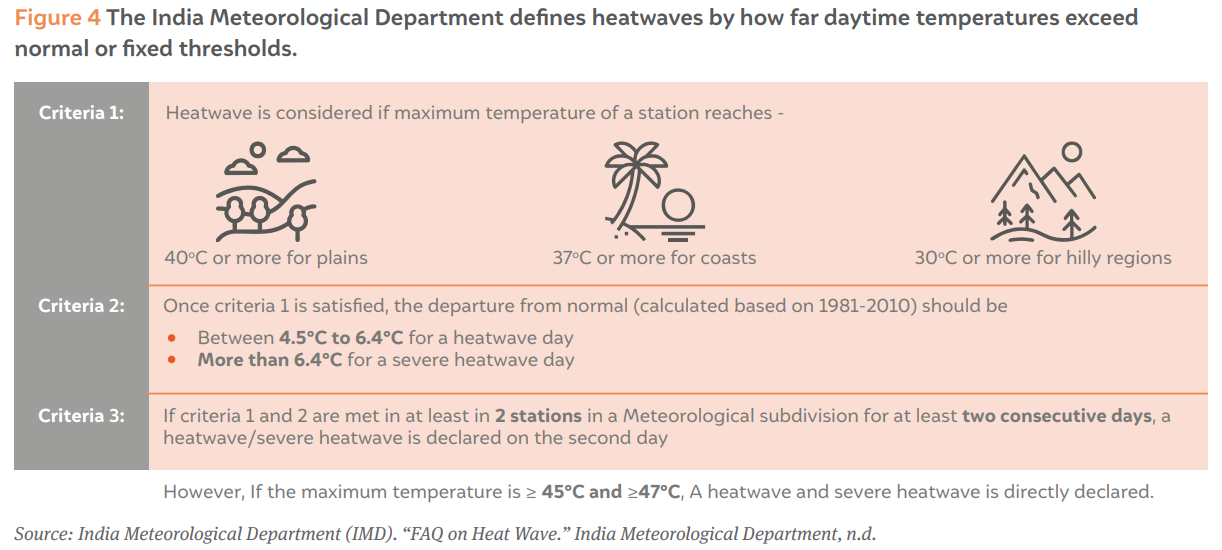
In India, heatwaves—as defined by the IMD—occur most frequently during the pre-monsoon or summer months (March to June). Central and northwestern India form the ‘heatwave zone’, since this is where these events are most common. At the same time, eastern coastal areas like Andhra Pradesh and Odisha also experience periodic heatwaves (Rohini, Rajeevan, and Srivastava 2016). Each region’s heatwaves are driven by different physical factors. These incidents are on the rise—according to observational research—especially in hotspots (Pai, Nair, and Ramanathan 2013; Rohini, Rajeevan, and Srivastava 2016). For instance, heatwaves in northwest India are linked to El Niño—southern oscillation events, tropical sea surface temperature anomalies, and enduring high-pressure systems. They are also linked to decreasing soil moisture. Interestingly, heatwaves tend to be more severe in the years after an El Niño event (Ratnam et al. 2016).
Recent extreme heat events have been severe. In 2022, South Asia experienced prolonged, record-breaking heat. March 2022 was the hottest month in India since 1901, with temperatures reaching 3–8°C above average in many regions (Zachariah et al. 2022). In 2024, India faced one of its longest heatwaves, exposing over a billion people across 23 states to extreme heat. This came on the heels of unprecedented heatwaves in 2022 and 2023, when 10 states declared heatwaves. In April 2024, the IMD forecast around 20 heatwave days—well above the usual 4–8 days for the month—highlighting the rapid impact of climate change and its ties to phenomena such as El Niño (PIB 2024). By the summer of 2024, India had recorded 536 heatwave days across its meteorological subdivisions.
According to climate change projections, heat extremes in India are expected to increase in intensity, frequency, and duration, and spread across more areas (Im et al. 2017). Under a high-emission climate change scenario (RCP 8.5), average temperatures in India could rise by about 4.4°C by 2100. This could result in 55 per cent more warm days and 70 per cent more warm nights, relative to 1976–2005 (Krishnan et al. 2020). Heatwaves could occur three to four times more often, and their durations might nearly double by the late twenty-first century (MoES 2024).
The intensifying heat stress—worsened by rising humidity and urban heat islands—will have significant consequences. Health outcomes, mortality, working conditions, and the spread of vector-borne diseases are likely to worsen, particularly in densely populated urban areas (Vaghela and Mangal 2018; Bordoloi and Saharia 2021). These escalating risks pose serious challenges to achieving the Sustainable Development Goals and the Sendai Framework for Disaster Risk Reduction, disproportionately impacting vulnerable populations and critical sectors across India.
1.3 Why does India need a composite heat risk index to advance its resilience?
Heat is often labelled as an invisible disaster because, unlike floods or cyclones, it leaves behind no apparent physical destruction. Yet, data shows that the impact of extreme heat varies significantly, making it critical to understand who is most at risk. Heat risk hinges on three key factors: (i) the intensity of the heat (and its compounding effects such as humidity); (ii) the degree of exposure; and (iii) the underlying vulnerabilities of affected communities.
However, most studies examine only temperature trends, productivity losses, or socioeconomic vulnerabilities, resulting in a fragmented view of heat risk. Despite the rising frequency, intensity, and duration of heatwaves, effective management can prevent these events. This is where heat action plans (HAPs) play a crucial role. HAPs are strategic frameworks developed by state, district, and city governments to prepare for, respond to, and recover from extreme heat.
India’s experience with HAPs highlights their potential. For example, Ahmedabad—which launched its HAP in 2013—reportedly avoided about 1,000 all-cause deaths annually during 2014–2015 compared to the 2007–2010 baseline (Hess et al. 2018). However, recent reviews have identified critical gaps in some HAPs developed in India. Pillai and Dalal reported a lack of heat risk quantification in approximately 95 per cent of India’s HAPs (2023). This shortcoming hinders targeted action, especially when financial resources are limited.
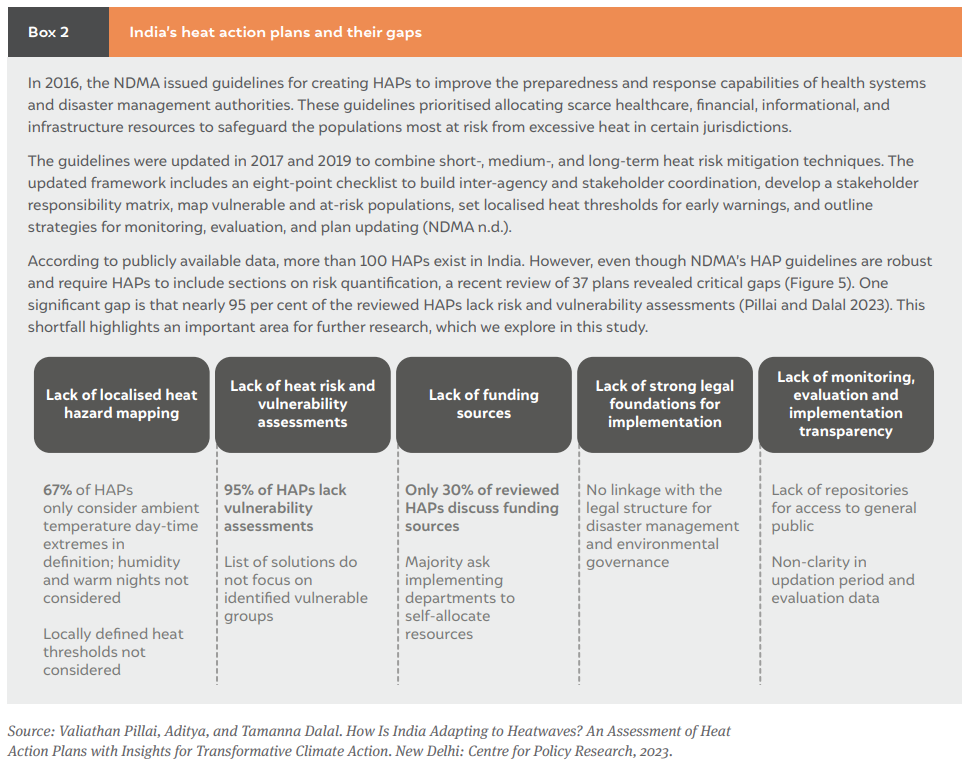
We reviewed 15 publicly available state and UT-level heat action plans (as of November 2024) and found that only 2 had undertaken heat risk and vulnerability assessments. These assessments are crucial for prioritising vulnerable areas within a city, district, or state for effective resource allocation.
As of March 2025, heatwaves are not listed among the 12 disasters eligible for full funding in India’s state and national disaster response funds (SDRF/NDRF), which account for 80 per cent of overall disaster management funding in the country. When states declare heatwaves as a local disaster, they can only use 10 per cent of these funds for response efforts. Further, without robust risk and vulnerability assessments, authorities struggle to identify high-risk areas, prioritise their needs, and effectively allocate limited resources. Heatwaves became eligible for funding from state disaster mitigation funds (SDMFs) in 2024, which constitutes 20 per cent of the overall disaster management fund. Funded efforts must focus on long-term, local measures to proactively reduce heat risk.
However, this means heatwaves are eligible for only 30 per cent of the overall funds available for disaster management—and only when states declare them as local disasters (15th FC 2020).
To address this gap, we developed a composite heat risk index to support decision-making and ensure efficient resource allocation based on risk profiles.
Heat is a dynamic atmospheric phenomenon, and the risks it poses vary across regions and people. These risks are influenced by the intensity, frequency, and duration of heat hazards, further compounded by factors such as high relative humidity and low rainfall. Additionally, exposure levels to heat hazards and socio-economic vulnerabilities shape the overall heat risk profile of a population.
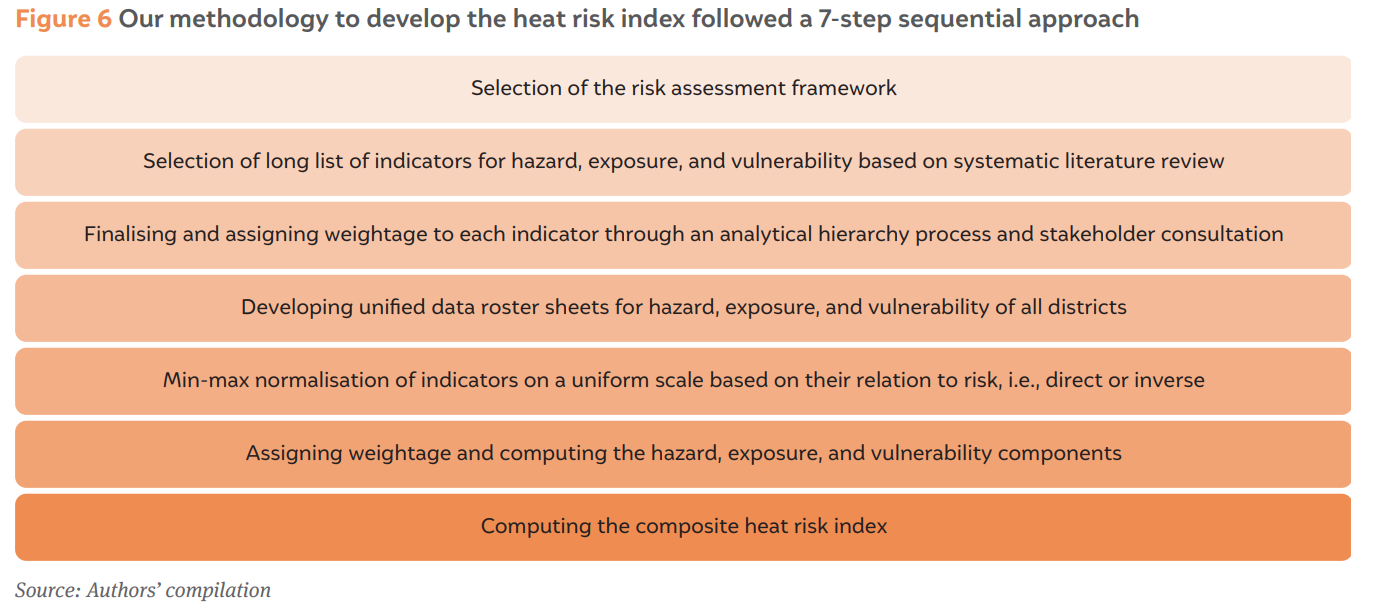
To systematically assess these risks, we developed a composite district-level HRI. Our methodology follows a structured, multi-step approach to capture the complex interactions between heat hazards, exposure, and vulnerability. Specifically, our analysis is guided by four key research questions:
This approach offers a comprehensive understanding of heat risk distribution across India and informs targeted strategies for enhancing resilience. Figure 6 presents a detailed schematic of our approach and methodology.
2.1 The risk assessment framework
The Intergovernmental Panel on Climate Change (IPCC) serves as a global scientific body that develops risk and vulnerability assessment frameworks for climate change. Over the years, researchers have applied various methodologies—including those outlined in the IPCC Fourth Assessment Report (AR4) and Fifth Assessment Report (AR5)—to map the risks and vulnerabilities associated with different climate hazards.
For this study, we adopted the IPCC’s AR5 framework (2014) to assess heat risks across Indian districts. This approach is also endorsed by the Indian Department of Science and Technology for national-level climate assessments. The framework defines risk as the result of interactions between hazard, exposure, and vulnerability, providing a structured methodology for evaluating climate-related risks. Figure 7 outlines the definitions of these components as per the IPCC (2014).
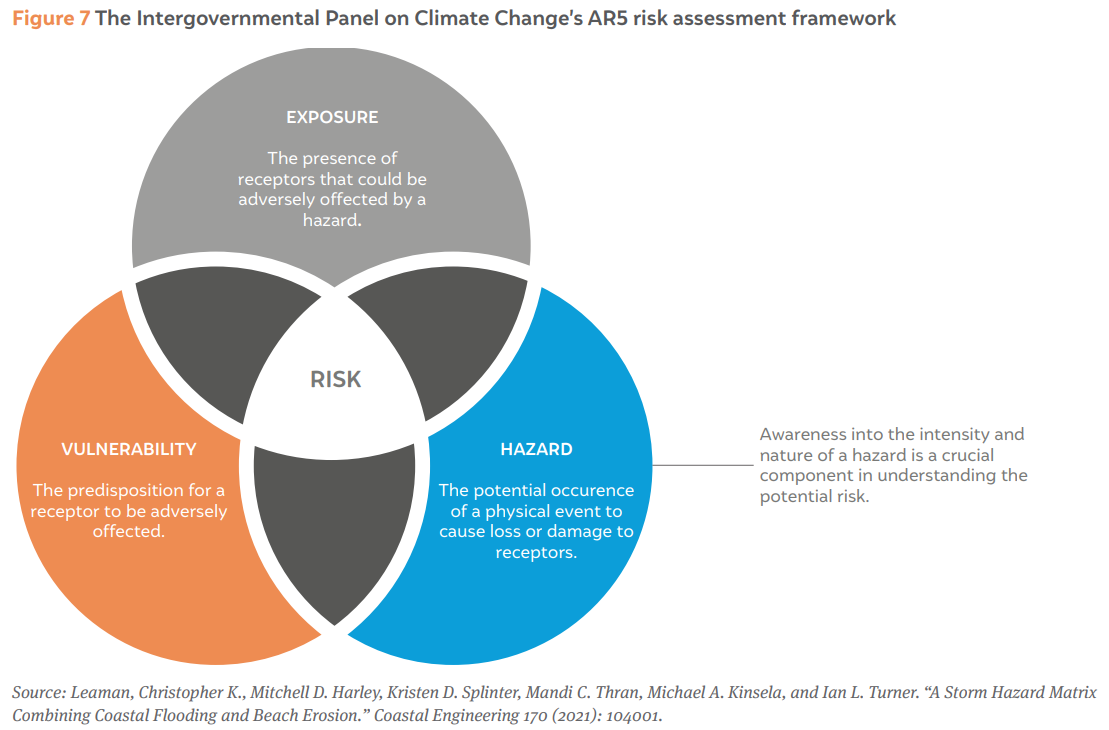
In the context of heat risk assessment, hazard refers to the potential occurrence of heat extremes or their increasing frequency and intensity. Exposure represents elements that directly increase risk from extreme heat, such as population density and building density.
The vulnerability component of the risk framework is divided into two sub-indices:
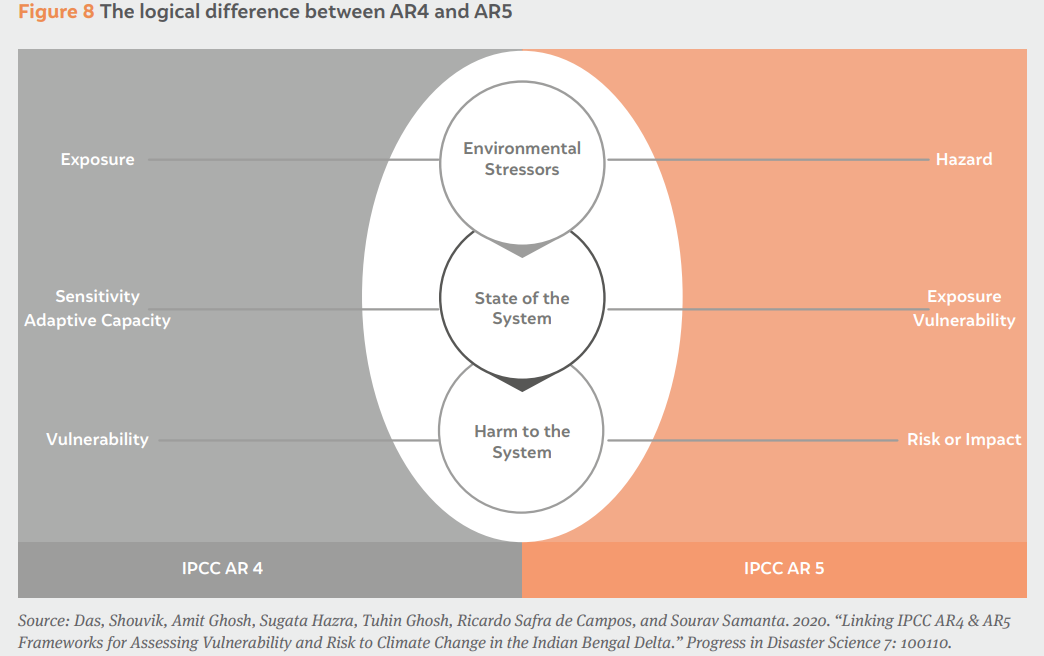
In AR4, the IPCC defines vulnerability as “the degree to which geophysical, biological, and socio-economic systems are susceptible to, and unable to cope with, adverse impacts of climate change, including climate variability and extremes” (IPCC 2007). The term ‘vulnerability’ in AR4 is used to describe both the vulnerable system itself (e.g., low-lying islands or coastal cities) and the impact on these systems (e.g., flooding of coastal areas and agricultural lands). According to IPCC’s AR4, vulnerability is a function of three factors: exposure, sensitivity, and adaptive capacity (IPCC 2007). ‘Exposure’ in AR4 refers to the magnitude and duration of climate-related stress such as a drought or change in precipitation, whereas ‘sensitivity’ is the degree to which the system is affected by climate-related stress or extreme events. Adaptive capacity in AR4 refers to the system’s ability to withstand or recover from extreme events or damage. The adaptive capacity of a system determines its vulnerability, by modulating exposure and sensitivity (IPCC 2007).
The IPCC’s AR5 introduced a new methodology and nomenclature. This strategy is comparable to the idea of disaster risk. This is distinct from the way vulnerability is currently understood in the IPCC’s AR4. IPCC’s AR5 defines risk as “the potential for consequences where something of value is at stake and where the outcome is uncertain, acknowledging the diversity of values”. It is frequently expressed as the likelihood that dangerous events or trends will occur multiplied by the consequences if they do (IPCC 2014; Das et al. 2020). Hazards associated with the effects of climate change are the main meaning of the term ‘risk’.
2.2 Selecting indicators, weightage, and stakeholder consultations
A comprehensive risk assessment requires multiple steps. First, goals and objectives need to be clearly defined. These goals will guide key decisions on the scale, sector, tier, indicators, and methods used to assess risk. In this study, our primary aim was to evaluate the relative heat risk for populations across Indian districts using a standardised set of indicators.
To achieve this, we identified key indicators based on three criteria:
The selection process was guided by existing studies and established frameworks that have assessed heat risk and vulnerability in India and globally. Key references include the Department of Science and Technology’s Climate Vulnerability Assessment for Adaptation Planning in India Using a Common Framework (2019–2020), the National Disaster Management Plan (2019), the National Guidelines for Preparation of Action Plan— Prevention and Management of Heatwaves (2019), and a research paper by Azhar et al. (2017). Additionally, we reviewed HAPs available in the public domain to ensure alignment with best practices and policy frameworks.
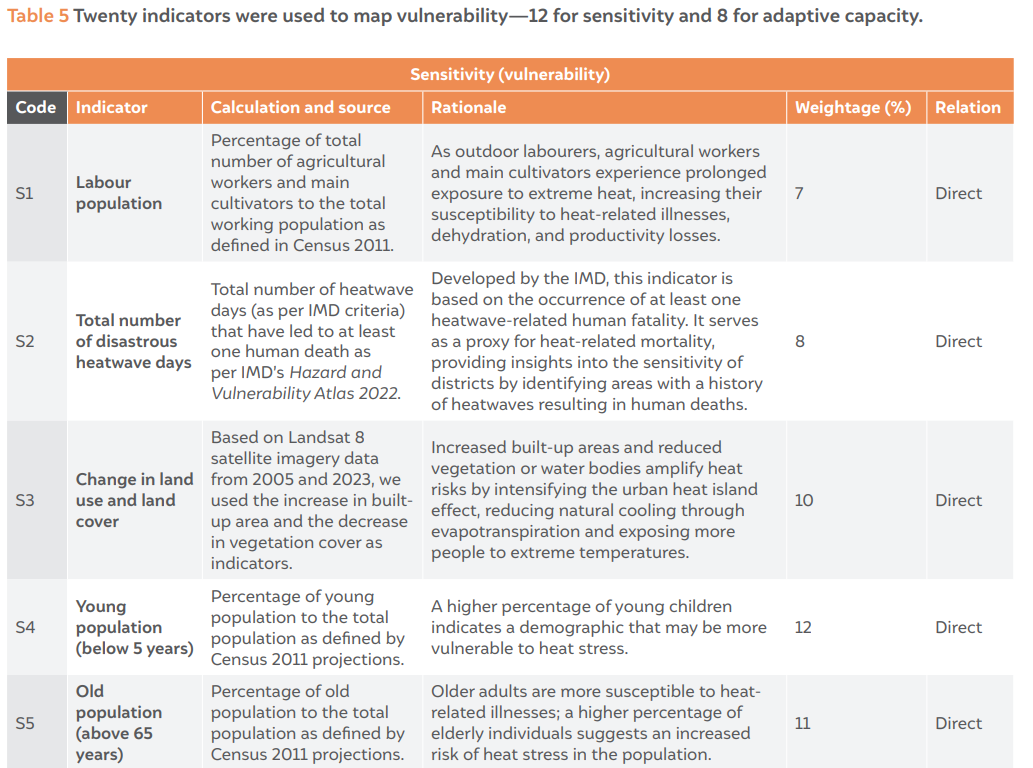
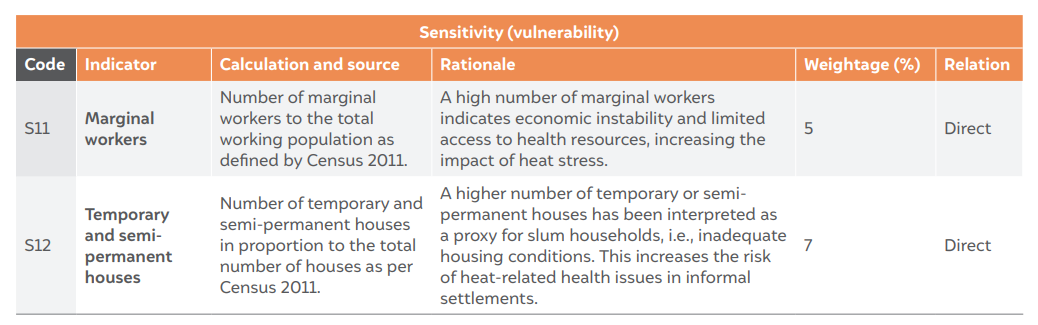
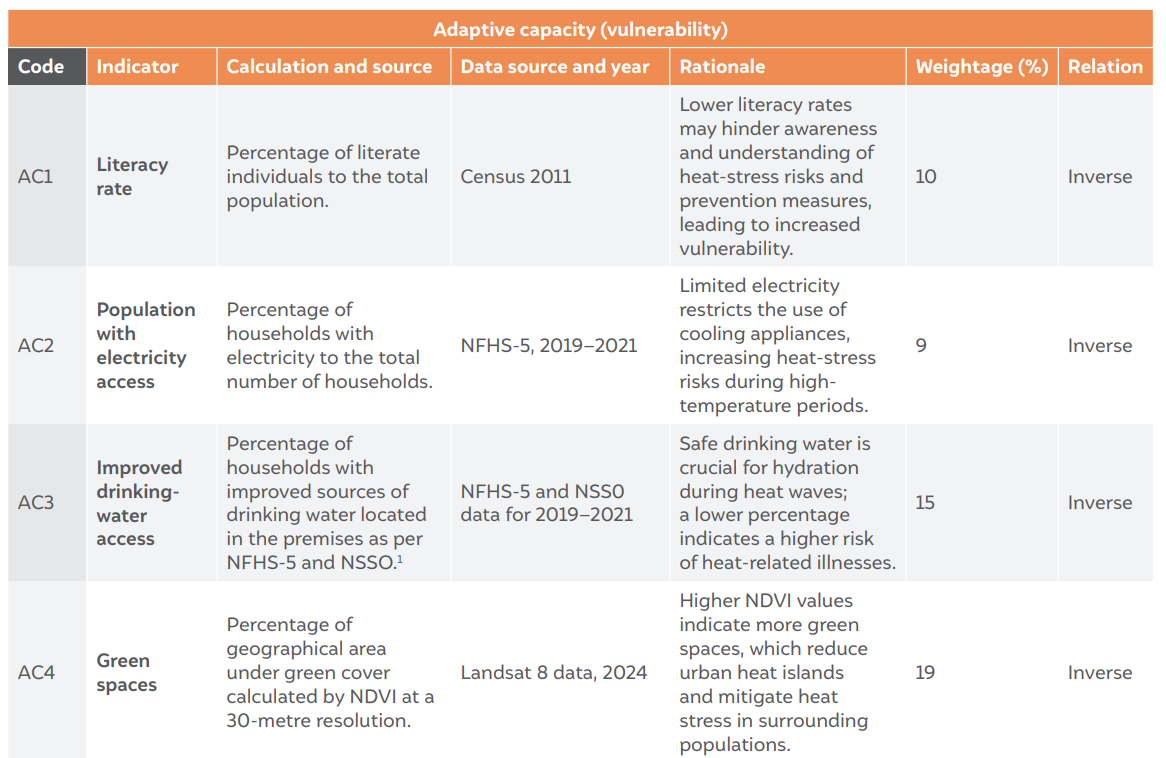
Tables 3 to 5 provide an overview of the selected indicators, detailing their data sources, rationale, relationship to risk, and the weightage assigned to each within the overall risk quantification framework. We prioritised indicators with consistent and reliable district-level data to ensure they could be compared and rigorously analysed.
We validated selected indicators through a stakeholder consultation of experts from academia and non-governmental organisations in India. These experts represented diverse, multi-disciplinary backgrounds which included climate science, public policy, water resources, disaster management, and public health..
A critical aspect of this study was assigning relative weights to indicators across the three core components—hazard, exposure, and vulnerability—to account for their differing contributions to heat risk. Given the diverse range of indicators, we employed the analytic hierarchy process (AHP)—a structured decision-making method that enables experts to compare indicators in pairs and assign relative importance scores. It is a semi-quantitative approach that allowed us to engage stakeholders in determining the relative weights of the indicators.
The AHP method allows stakeholders to assess the relative weight of multiple criteria by making pair-wise comparisons—such as ‘indicator X is more important than indicator Y’— and convert these comparisons into numerical weightings (Kaspercyk and Knickel 2022). This methodology has been widely applied in multi-criteria decision-making, planning, resource allocation, and conflict resolution (ODPM 2004).
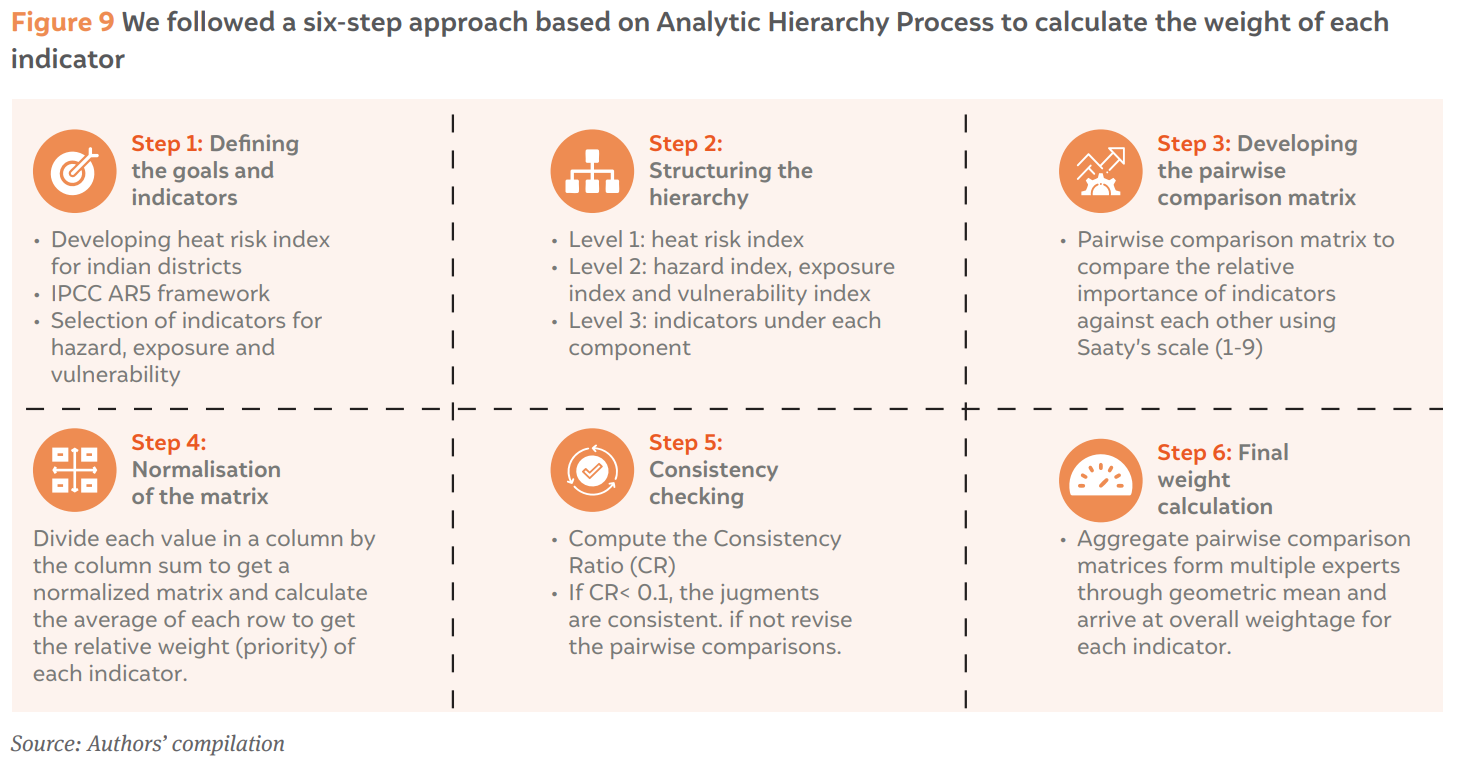
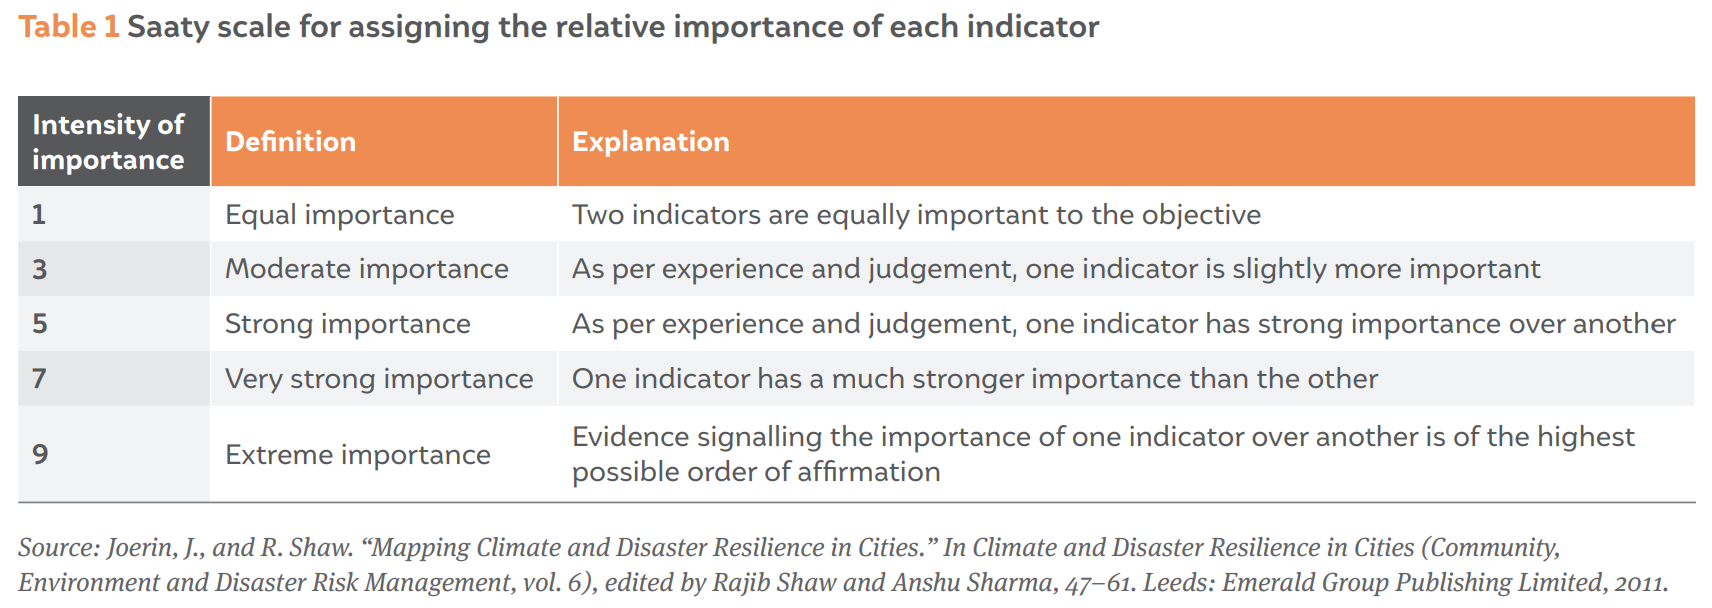
To compute indicator weights in the AHP, we constructed an n × n comparison matrix, where n represents the number of indicators within a specific risk component. We compared indicators in pairs using a predefined numerical scale within this matrix.
This scale—developed by Saaty—assigns values ranging from 1 to 9 (Table 1) to represent the relative importance of each indicator (1987). The AHP method splits the decisionmaking process into smaller components, allowing experts to systematically compare indicators in pairs and assign scores based on their perceived importance. This structured approach ensures that indicators are weighed consistently and transparently within the risk assessment framework.
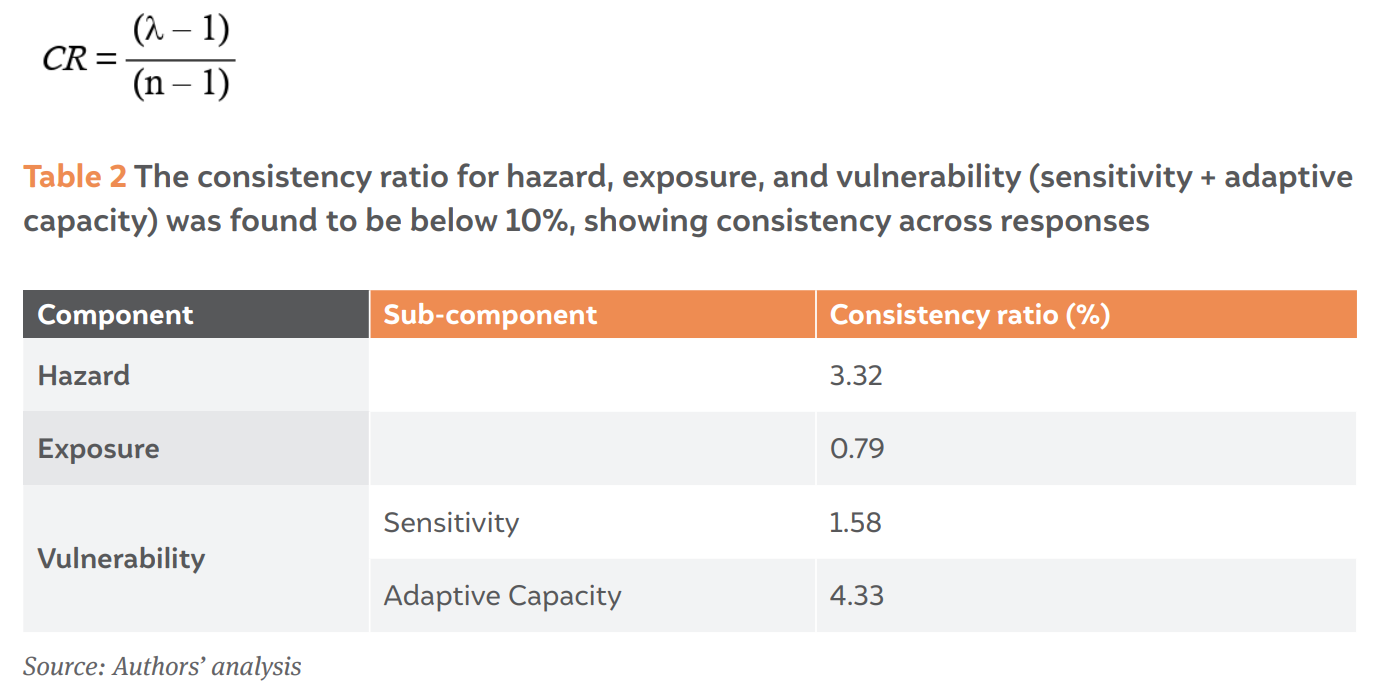
To compute the final indicator weights, we aggregated the responses from individual stakeholders to determine the weight percentage assigned to each indicator across the three risk components. We combined the twelve responses using the geometric mean method, producing a consolidated preference matrix. The resulting indicator weights fell within the range of 0 to 1.
To ensure the reliability of stakeholder judgements, we computed the consistency ratio (CR) for the 12 responses received. A CR value below 10 per cent (or less than 0.1) indicates a consistent decision matrix. In this assessment, the CR for all the consolidated matrices remained within this threshold, confirming the robustness of the weighting process. We computed the CR using a formula where λ represents the maximum eigenvalue of the matrix and n denotes the number of indicators:
2.3 Mapping the heat hazard
A key component of this study is the detailed mapping of heat hazards, which is foundational for assessing heat-related risks. Since heat is a slow-onset and dynamic phenomenon, capturing its variability and compounding effects requires a structured and nuanced approach. This necessitates the definition of precise thresholds and criteria for hazard indices to ensure a robust and comprehensive assessment.
To achieve this, we developed a long-term dataset to track extreme heat occurrence not only in traditionally high-risk regions such as northwest India but also in areas which are not heat-prone but are now experiencing increasing heat extremes. Our methodology accounts for the changing characteristics of heat hazards by analysing shifts in key indices over the last decade (2012–2022) compared to the climatic baseline (1982–2012). This approach allowed for a more comprehensive and data-driven analysis of evolving heat risks.
We mapped heat hazards using a step-by-step methodology, ensuring consistency and accuracy in capturing emerging heat trends across different regions.
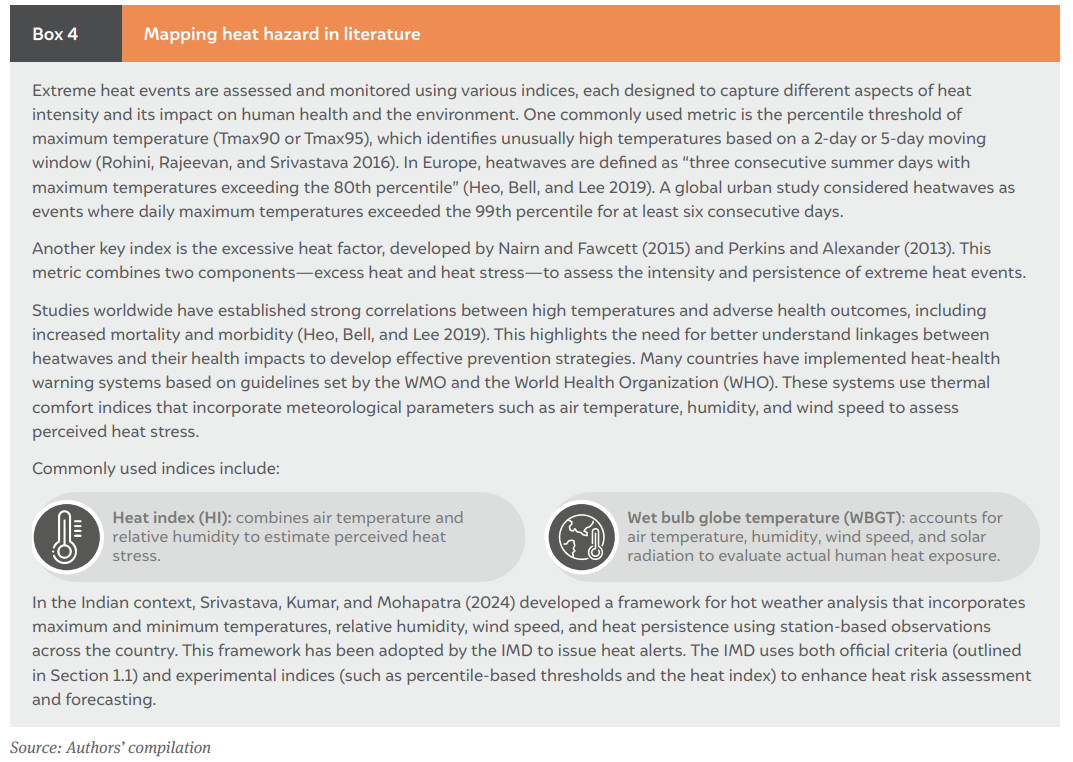
We began by reviewing the existing literature on the methodologies used to measure extreme heat. Our analysis revealed that researchers employ various approaches to define and quantify heat extremes, each with varying thresholds and metrics. A summary of these methodologies is presented in Box 4.
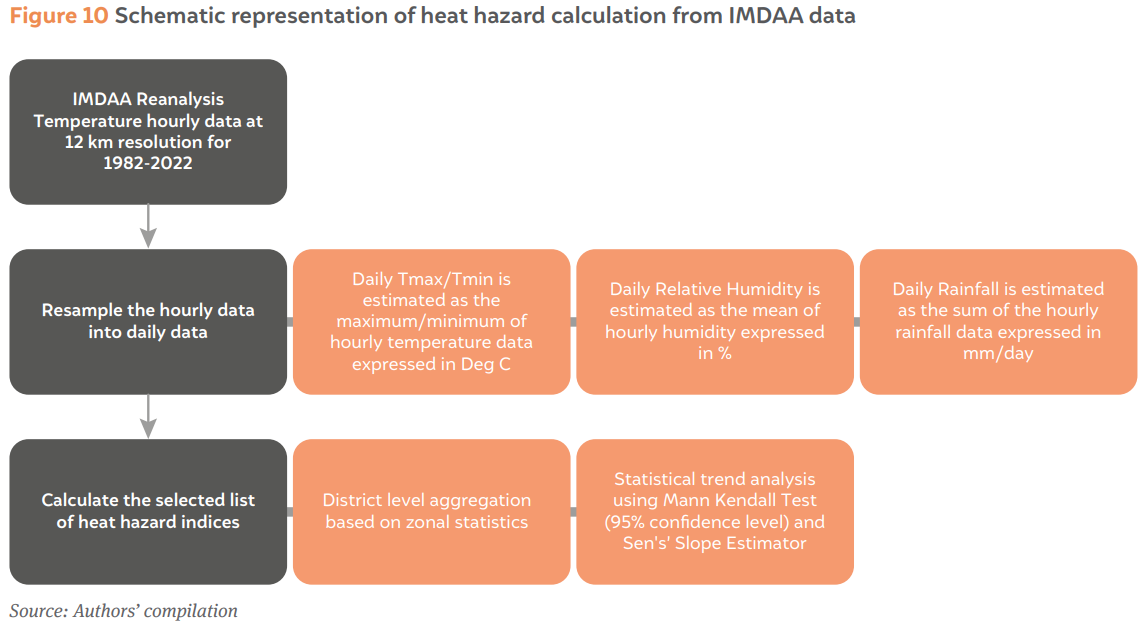
To conduct a comprehensive analysis of heat trends, we developed long-term daily gridded datasets using data from the Indian Monsoon Data Analysis and Assimilation (IMDAA) project to examine trends over 1982–2022. IMDAA provides data at a spatial resolution of 12 km, making it the most suitable dataset for district-level assessments and the highest resolution dataset available for the Indian subcontinent (Rani et al. 2021). We used the 95th percentile as the threshold for very hot days and very warm nights, which is found to be a good indicator of extreme heat events (Cardil, Terrén, and Kobziar 2014; Avashia, Garg, and Dholakia 2021; Tiwari 2023).
IMDAA is a collaborative effort between the Meteorological Office, UK, the National Centre for Medium Range Weather Forecasting, India, and the IMD. It is financially supported by the National Monsoon Mission of the Indian government’s Ministry of Earth Sciences (NCMRWF n.d.). For validation purposes, we also utilised the 100-km resolution gridded dataset developed by Srivastava, Rajeevan, and Kshirsagar (2009), ensuring consistent trend estimation and reliable results. We calculated the indices outlined in Table 3 using this data.
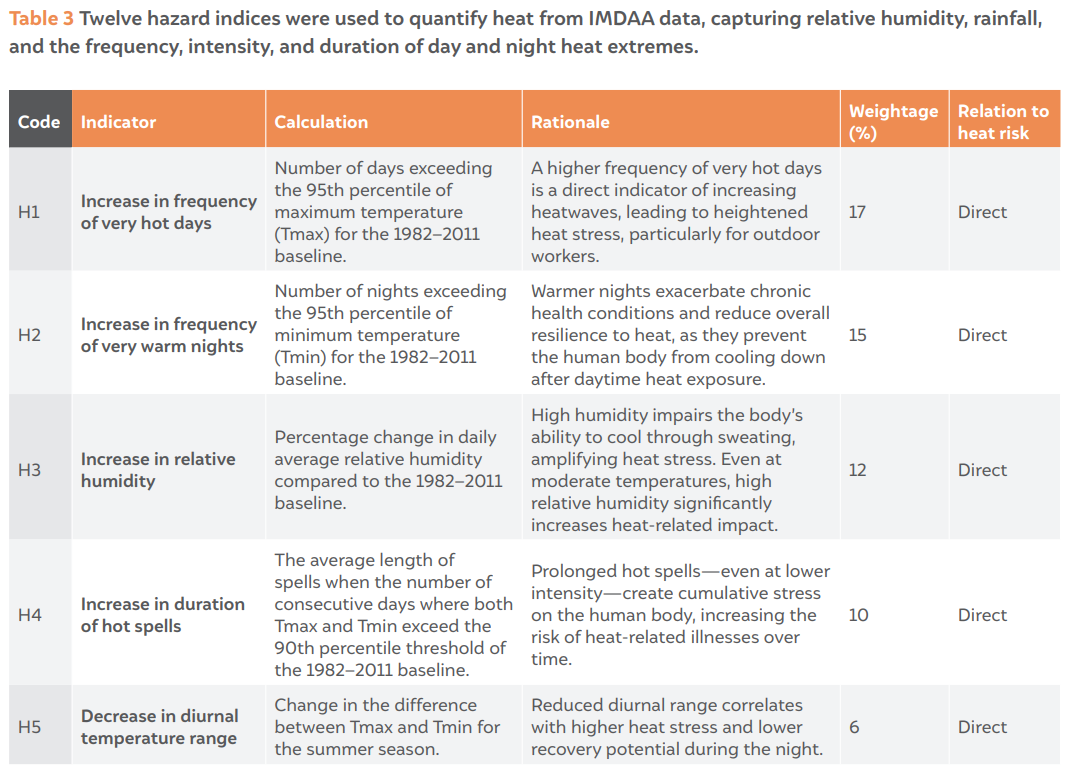
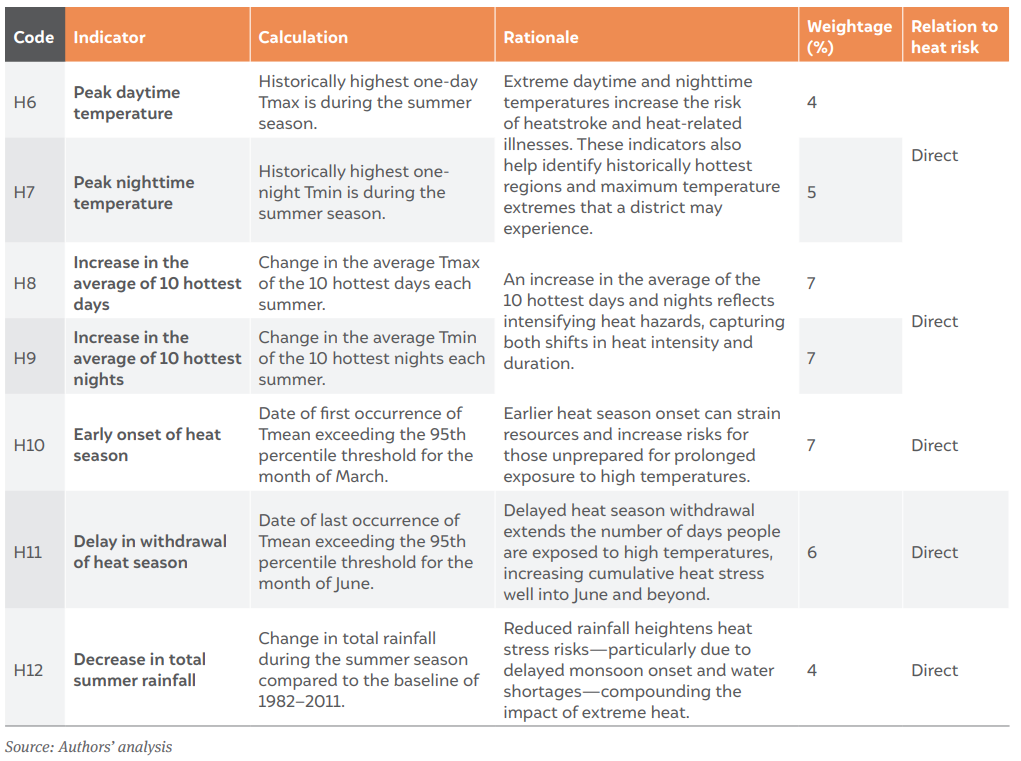
For the final stage of the analysis, we conducted a district-level assessment using the indices outlined in Table 3 to evaluate heat hazards in terms of their frequency, intensity, and duration. These indices were calculated using the Xclim library and combined with the Xarray module in Python (a programming language) to process the gridded climate data. Next, we aggregated the computed indices at the district level using a spatial zonal statistics method. This method overlays the gridded data onto district boundaries and identifies the grids falling within each district.
We delineated district boundaries using the Survey of India (SOI) shapefile, which provides geographic information system boundaries for approximately 734 districts across India, as of March 2025. This approach enabled us to conduct a localised assessment of heat hazards, allowing for a granular understanding of regional variations in heat risk across the country.
Following the estimation of heat indices, it was necessary to assess whether individual climatic indices exhibited a statistically significant trend that increased or decreased over the time for each district. This was achieved by applying the Mann-Kendall trend test, a non-parametric method widely used for detecting trends in time-series data at a 95 per cent confidence level (Mann 1945; Kendall 1975). We selected the Mann-Kendall test due to its suitability to analysing meteorological data, as it does not assume a normal data distribution. This makes it ideal for detecting trends in climatic indices (Meals et al. 2011). Unlike leastsquares regression—which may be influenced by extreme values—the Mann-Kendall test is a rank-based method, ensuring robustness against outliers. The test computes Kendall’s Tau rank correlation coefficient, which ranges between -1 and 1. A positive value indicates an increasing trend, while a negative value signifies a decreasing trend (Meals et al. 2011). To quantify the rate of change, we also estimated Sen’s slope, which represents the median slope across all pairs of data points in the time series (Meals et al. 2011).
The test uses a null hypothesis—that no trend exists—to determine statistical significance. A trend is considered statistically significant if the p-value is less than 0.05. The Mann-Kendall test has been extensively applied in meteorological and hydrological studies due to its effectiveness in detecting climate-related trends (Kumari et al. 2022; Mohan and Rajeevan 2017).
2.4 Developing the exposure and vulnerability indices
To generate information on exposure and vulnerability, we used a combination of geospatial datasets, Census 2011 data, and data from the National Family Health Survey (NFHS) 2019–2021.
For several exposure and vulnerability indicators such as population density, we relied on Census 2011 estimates. We projected these estimates for until 2022 by analysing the rate of change between the Census 2001 and 2011 estimates. We applied the compound annual growth rate method to estimate the demographic data for 734 districts as per the SOI’s official shapefile. For districts that were formed after Census 2011 and NFHS 2019, we used the area apportionment method of assigning demographic data based on the parent district’s population trends. To ensure accuracy, we refined the dataset using GIS shapefiles, socioeconomic reports, and Census district handbooks.
We used three datasets for indicators requiring geospatial analysis such as built-up density, green cover, and building footprint density: i) Sentinel 2A-based, ESRI-generated land use and land cover (LULC) data at a 10-metre spatial resolution; ii) normalised difference vegetation index (NDVI) and modified normalised difference vegetation index (MNDWI) based on Landsat 8 data at a 30-metre spatial resolution; and iii) Google’s building footprint data for the entirety of India, processed at a bounding box of 500 sq m.
Next, we aggregated these indices at the district level using the zonal statistics method, ensuring spatial consistency in exposure estimates. For vulnerability indicators, we primarily relied on Census 2011 and NFHS 2019–2021 datasets. Additional indicators such as the availability of health centres were sourced from the Indian government’s Open Government Data Platform, along with other national and regional datasets.
Tables 4 and 5 provide the sources, temporal coverage, and spatial resolutions of all selected indicators.
2.5 Developing the composite heat risk index
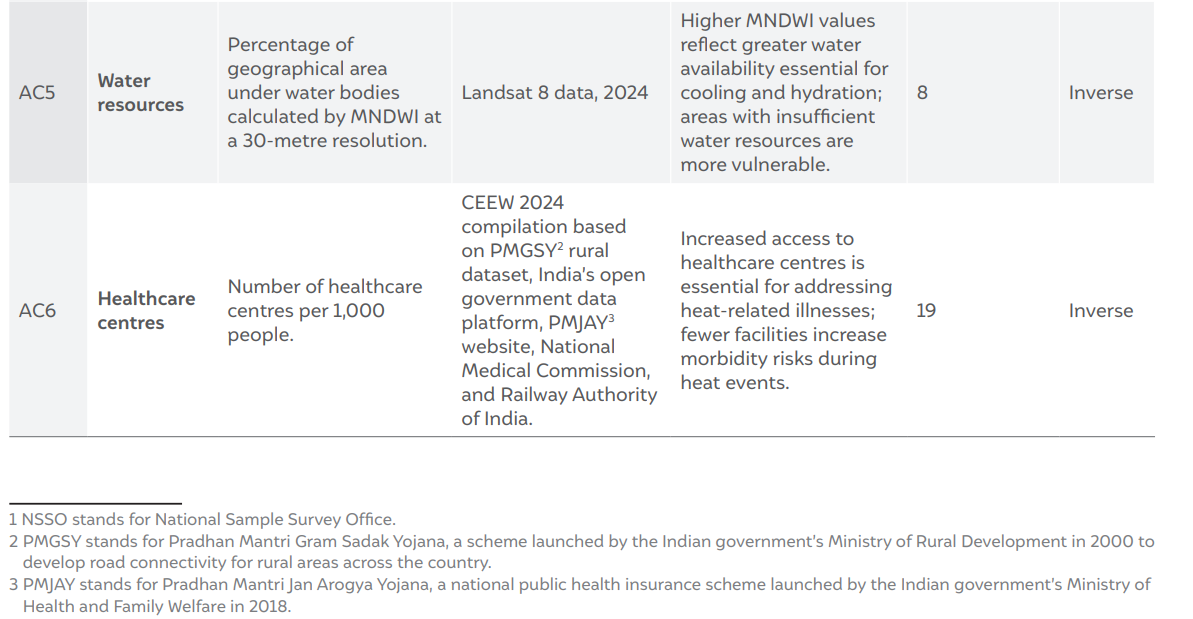
Following the development of datasets for the exposure, hazard, and vulnerability components, we normalised all indicators based on their relationship to heat risk—whether they are direct or inverse. We normalised indicators with an inverse relationship to risk using the min-max normalisation technique.
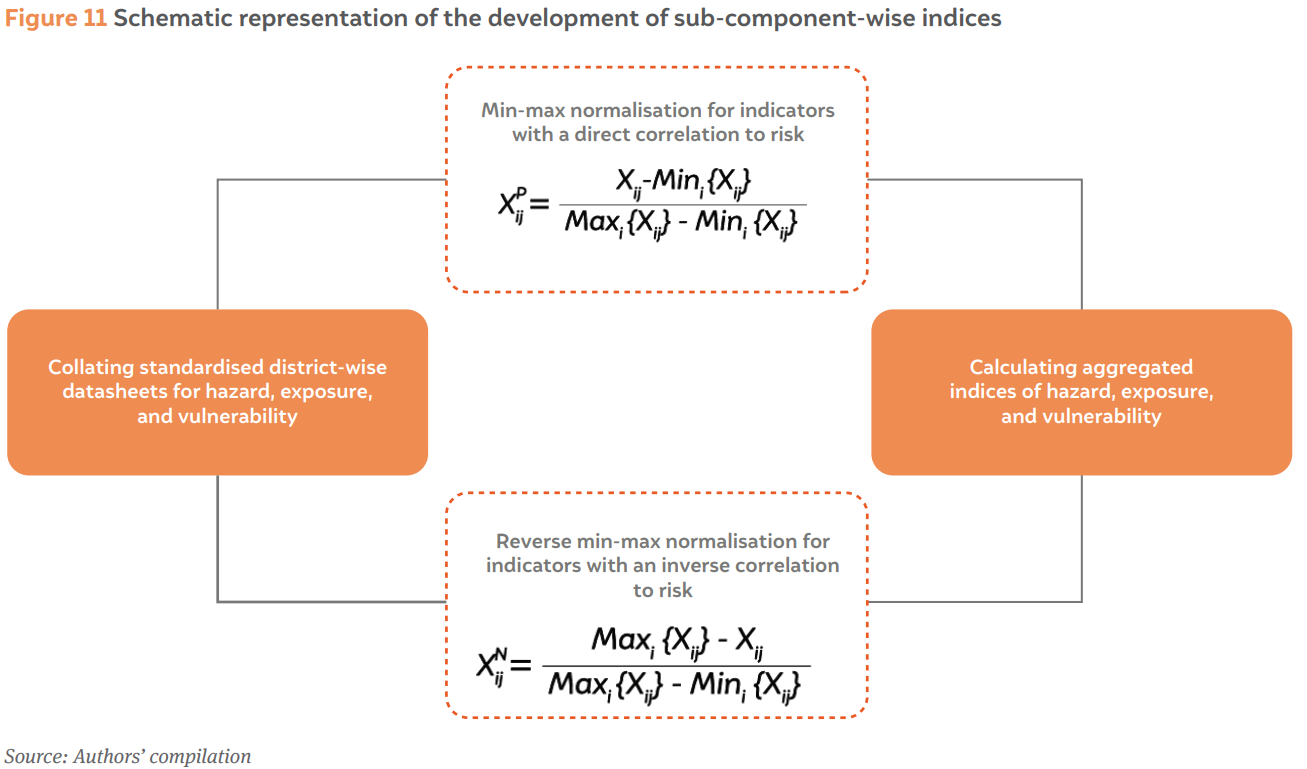
After normalising the indicators, we applied weights to each of them and computed sub-component scores for each district. We derived these scores by multiplying the subcomponent scores and normalising them using the min-max scale to ensure consistency across districts. We used this methodology to compute the HRI. We classified districts using the natural breaks method into very low, low, moderate, high, and very high risk categories. We assigned each district a score ranging from 1 to 5 to enhance interpretability based on risk levels. For state-level aggregates, we first aggregated district-level scores using a simple mean approach. Next, we identified the percentage of districts falling under the high and very high risk categories to constitute state-level rankings. This also provided a broader assessment of heat risk at the state level.
To analyse the drivers of heat risk in greater detail, we identified key contributing factors in high and very high risk districts. Indicators with normalised values equal to or above 0.8 were considered primary contributors to heightened risk levels. We have provided these insights in state-level handbooks for decision-makers (Annexure 1).
It is important to note that districts classified as very low or low risk are not entirely free from heat risks. Rather, their classification indicates that they are at relatively lower risk compared to other districts on a comparative scale.
2.6 Limitations of the methodology
This study maps extreme heat risks to the population by focusing on their exposure and outlines strategies for disaster risk reduction and public health resilience. However, our HRI does not include sector-specific indicators for agriculture, water, biodiversity, or power—a limitation we acknowledge. However, our findings lay the groundwork for the future development of sector-specific risk indices.
Further, we have relied on socio-economic and demographic data from the Census 2011 and projected these figures to 2022 using accepted statistical methods. While this data is outdated, no newer comprehensive survey is available.
Additionally, our risk assessment is based on a fixed set of indicators chosen through an extensive literature review and stakeholder consultations. Any changes to this set could alter the results.
In this section, we provide the findings from the analysis of heat hazard, exposure, vulnerability, and the composite HRI quantified for the summer months of March to June.
3.1 Changing patterns of heat hazard in India
Indian climate science has shown the significant impact of heat on various sectors and public health, with trends and hotspot analysis emerging as critical research areas. Most studies are based on the IMD’s 100-km gridded observation data, or in some cases, ERA-5 reanalysis data. In contrast, the indigenous IMDAA dataset—available at a 12-km resolution from IMD and NCMRF5 —has been predominantly used to assess monsoon trends. Its application for heat hazard analysis has been limited. This section presents our key findings derived from an analysis of India’s IMDAA reanalysis data.
For our analysis of heat hazards, we moved beyond using fixed temperature thresholds (such as 40°C, 30°C, or 37°C) and instead used district-specific thresholds based on percentiles. A percentile is a way to rank temperatures by comparing them to historical data. For example, if the 95th percentile is 38°C in a region, it means that 95 per cent of the time, temperatures are below 38°C, and anything above it is unusually hot for that area. This locally adaptive approach—endorsed by WHO, WMO, and IMD—ensures that risk assessments reflect regional climate conditions and acclimatisation levels.
Shifting patterns of daytime and nighttime heat extremes and intra-day temperature variability
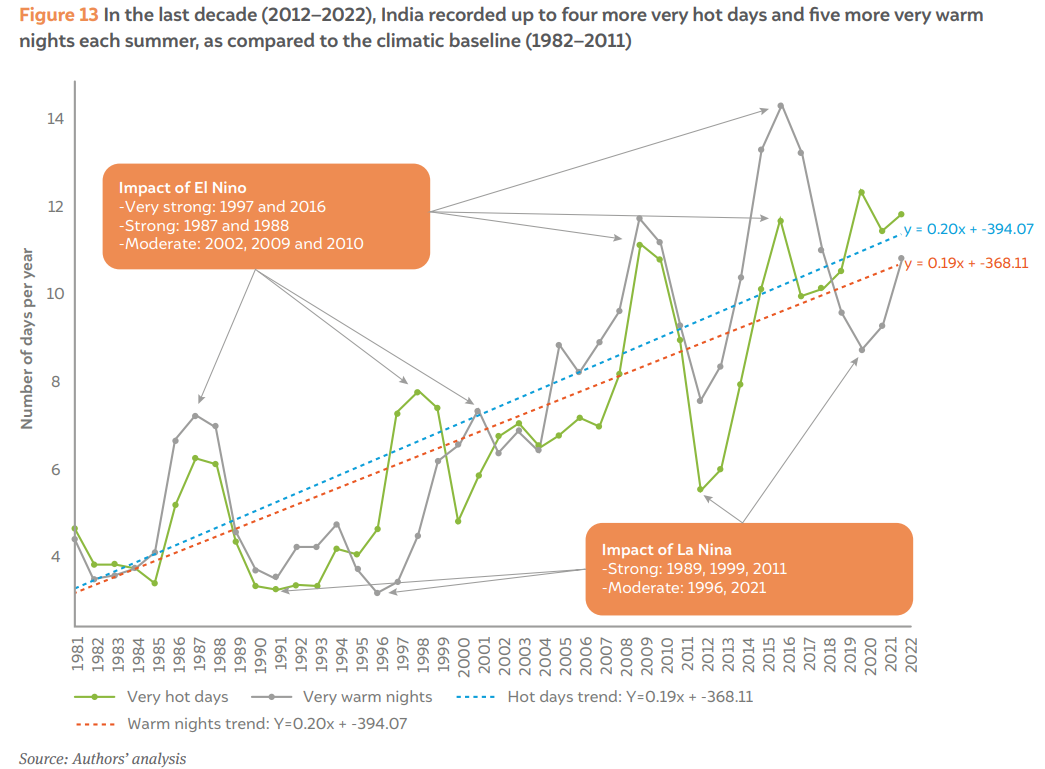
Our analysis indicates a linear increase in heat extremes across India. Considering national average data over the past 40 years (1981–2022), the number of very warm nights is rising at a faster rate than very hot days—particularly during the last decade. Very warm nights and very hot days are both defined as instances when temperatures exceed the 95th percentile of historical data. This phenomenon is influenced by natural variability, driven by El Niño and La Niña events (see Figure 14). For example, during strong El Niño years such as 1997 and 2016, the frequency of both very hot days and very warm nights was markedly higher than the average. This trend is especially concerning because elevated nighttime temperatures impede the body’s ability to recover from daytime heat, thereby increasing health risks—particularly among vulnerable groups.
In the last decade (2012–2022), district-level extreme heat trends have shifted significantly (see ES Figure 1) as compared to the climatic baseline (1982–2011). Over 70 per cent of Indian districts now experience at least five additional very warm nights per year, while 28 per cent of districts experience an increase of more than five very hot days annually. The rise in very warm nights is particularly pronounced in high-density urban districts (population exceeding 1 million), with Mumbai recording 15 additional warm nights per year, followed by Bengaluru (11), Bhopal (7), Jaipur (7), Delhi (6), and Chennai (4). Given that more than half of India’s population is projected to reside in urban areas by 2050, this trend signals a critical challenge. The urban heat island effect exacerbates nighttime temperatures. Cities absorb and retain heat during the day, which delays cooling after sunset.
Further, more than 20 per cent of districts have recorded simultaneous increases in very hot days and very warm nights, i.e., more than five instances of each per year. This is particularly evident along the western coastline and in Jammu & Kashmir and Ladakh. In Ladakh—a key renewable energy hub—both indicators have risen sharply, with an increase of over 15 days annually.
The increasing frequency of hotter days and warmer nights in India is a well-documented trend, with multiple studies reporting consistent findings. Krishnan et al. observed that between 1901 and 2018, India’s average temperature increased by approximately 0.7°C (2020). This warming is primarily attributed to greenhouse gas emissions, though it has been partially offset by the cooling effects of anthropogenic aerosols and LULC changes. Similarly, Panda, AghaKouchak, and Ambast found that heatwaves and warm spells exhibit distinct spatial and temporal patterns, aligning with model projections (2017). Notably, the 1998 warming hiatus period highlighted changes in heatwave characteristics, with drought conditions amplifying these trends.
Additionally, Mukherjee and Mishra (2018) examined climate model simulations and historical observations from the Coupled Model Intercomparison Project 5 and the Climate of the 20th Century Plus Detection and Attribution project. According to their findings, anthropogenic emissions are the major reason for the notable increase in concurrent hot day and hot night (CHDHN) events throughout India. The frequency of three-day CHDHN episodes is expected to increase fourfold by the middle of the century and twelvefold by the end of the twenty-first century under the high-emission scenario (RCP 8.5), highlighting the mounting effects of climate change.
In addition to climate change, urbanisation has emerged as a significant driver of warming, particularly for nighttime temperatures. Concrete surfaces absorb and retain heat during the day, releasing it gradually after sunset. This process contributes to the urban heat island effect, where urban areas consistently record temperatures higher than rural ones.
A recent analysis by Sethi and Vinoj (2024) highlights the role of urbanisation in amplifying warming trends. They estimate that urban expansion alone has led to a 60 per cent increase in warming across Indian cities. The effect is most pronounced in eastern tier-II cities, which have experienced the highest rates of urban-driven temperature rise.
To further examine the rising trend in very warm nights, we analysed the diurnal temperature range (DTR)—the difference between the daytime maximum and nighttime minimum temperature. Typically, peak daily temperatures occur in the afternoon as the atmosphere continues to absorb heat beyond noon, while minimum temperatures are recorded around dawn following the sustained loss of heat through the night. DTR is a key indicator of climatic change and serves as a critical thermal metric for assessing the impact on agriculture and human health.
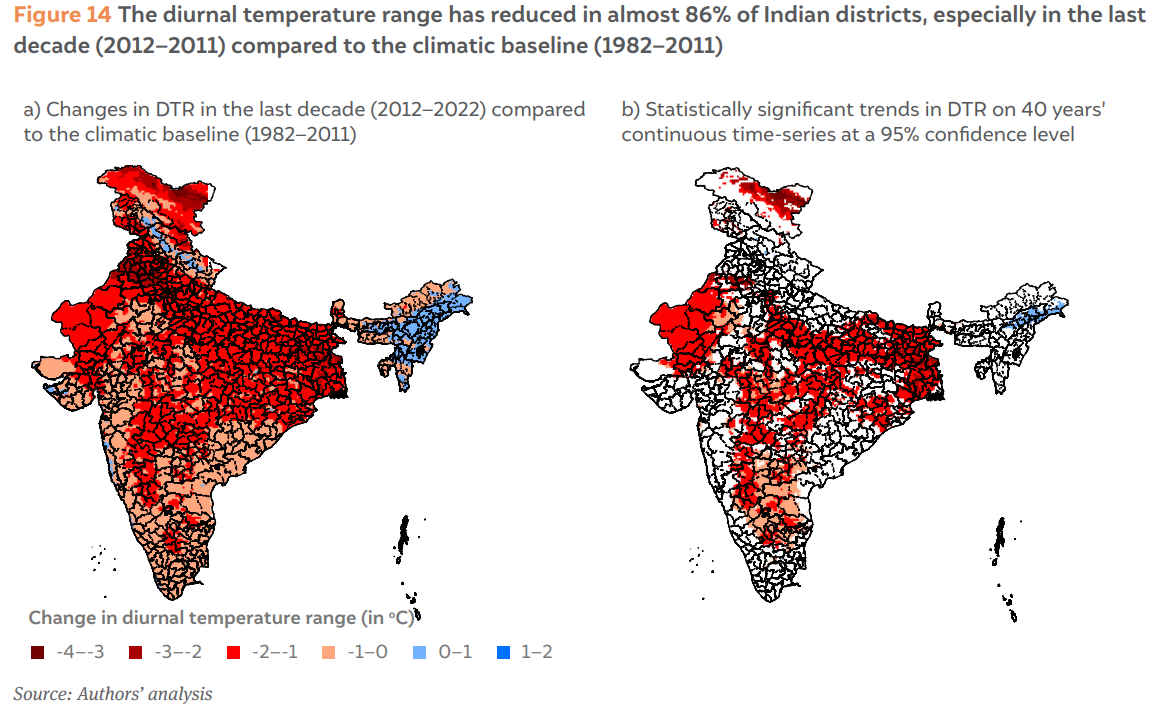
Our analysis shows that most Indian districts have experienced a decline in DTR, with only 14 per cent recording an increase. The most pronounced reductions are observed in Punjab, West Bengal, Uttar Pradesh, Bihar, and Haryana—all agriculturally significant states—primarily due to an increase in minimum temperatures (Tmin) coupled with a slight decline in maximum temperatures (Tmax). These findings are consistent with Mall et al., who identified rising Tmin as a key driver of DTR reductions between 1991 and 2016 (2021).
A declining DTR (narrowing temperature gap) is typically driven by rising nighttime temperatures, which prevent the human body from cooling down after hot days. Studies have linked a declining DTR with an increase in all-cause and cardiovascular mortality. Further, changes in DTR influence vector-borne diseases such as malaria and dengue, since mosquitobreeding cycles are sensitive to temperature. A declining DTR reduces grain-filling durations in staple crops like wheat, rice, and maize, leading to lower yields. Warmer nights also increase plant respiration rates, leading to higher energy loss and reduced photosynthesis efficiency.
Changes in duration and intensity of hot spells
While the frequency of very hot days and very warm nights has increased, capturing the persistence and intensity of heat hazards requires a broader assessment. To this end, we define a hot spell as consecutive days during which daytime and nighttime temperatures exceed the 90th percentile threshold. Prolonged periods of extreme heat can impact human health just like isolated extreme temperature events. Additionally, we examined changes in the average temperature of the 10 hottest days and the 10 warmest nights over time.
Our findings indicate that over the last decade (2012–2022), hot spell durations have increased by more than three days in 38 per cent of districts, relative to the baseline period (1982–2011). This trend is particularly evident in districts across Gujarat, Punjab, Karnataka, Tamil Nadu, Delhi, Uttar Pradesh, Madhya Pradesh, and Rajasthan. However, in terms of heat intensity, the increase remains relatively modest. The temperature rise in the 10 hottest days ranges from 0.4°C to 1°C, while the increase in the average temperature of the 10 warmest nights is slightly higher—between 0.4°C and 1.2°C. These findings suggest that while heat events are becoming more frequent and prolonged, their intensity has not increased substantially.
Changing patterns of relative humidity
Relative humidity is an essential indicator of the compounding effects of extreme heat. When the body temperature exceeds 37°C, sweating helps cool it down. However, high humidity slows this process, making it harder for the body to release heat (Figure 17).
Figure 15 Majority of India has seen an increase in relative humidity across summer months (March to June)
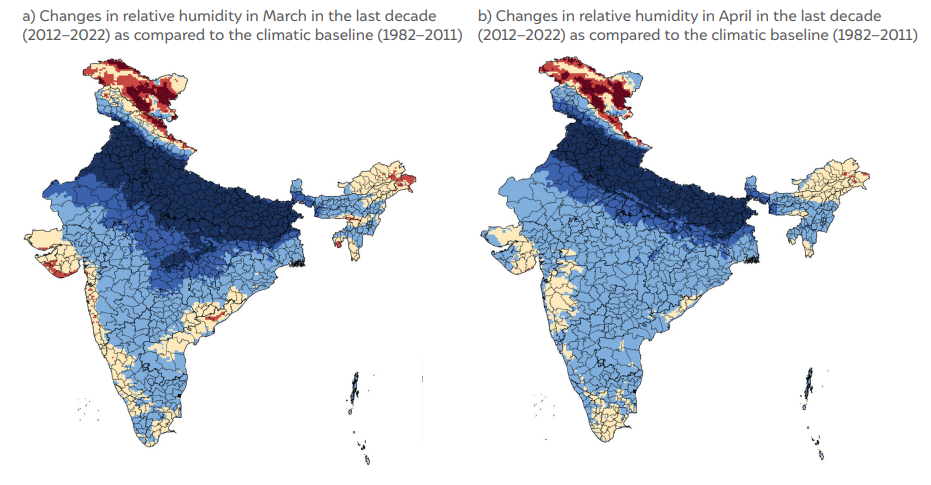
The analysis of relative humidity (RH) has been a key gap in existing literature, primarily due to the limited availability of dense observational network data and the reliance on ERA5 reanalysis datasets, where RH is derived from dew point temperature rather than direct observations. This study utilises IMDAA data to examine changes in average RH across the four peak pre-monsoon months—March, April, May, and June.
Relative Humidity (RH) is defined as the ratio of actual vapour pressure (e) in the air to the saturation vapour pressure (es).
RH = e / es
RH varies both diurnally and seasonally and is inversely related to air temperature (T a), as es increases with rising temperatures.
Rising global temperatures have led to an increase in evaporation, which in turn has increased humidity in many regions (Held and Soden 2006). Elevated atmospheric humidity reduces the body’s ability to cool itself through sweat evaporation, aggravating heat strain and increasing health risks.
Many studies have assessed humidity-induced heat stress using Steadman’s heat index, which integrates air temperature and relative humidity to quantify the perceived temperature or ‘feels-like’ effect (Steadman 1979). However, the validity of Steadman’s heat index is limited in the Indian context, particularly in interior regions such as Central and Northwest India, where summer air temperatures often exceed 26°C and relative humidity frequently drops below 40 per cent. Previous studies have noted this limitation (Ganguly et al. 2009; Mahapatra et al. 2018).
We found that the average relative humidity has increased by more than 4 per cent in 50 per cent of Indian districts over the last decade (2012–2022) as compared to the long-term average (1982–2011). This trend is particularly significant in North India—especially in the IndoGangetic Plains (see ES Figure 4)—where agricultural workers spend long hours outdoors. Delhi has experienced a nearly 9 per cent increase in relative humidity. Coastal areas typically experience 60–70 per cent relative humidity during summer. In North India, summer relative humidity was normally around 30–40 per cent. However, relative humidity levels are now reaching 40–50 per cent, exacerbating heat stress—particularly in May and June.
The findings of our study align with previous research, notably by Jaswal and Koppar (2011), who analysed data from 215 meteorological stations across India. Over 90 per cent of stations showed a statistically significant increase in specific humidity, relative humidity, and the dry bulb temperature, with the most noticeable increases occurring during the summer months. Their trend analysis from 1969 to 2007 offers compelling evidence of rising air moisture content. The north, northwest, central, and southeast regions of India experience the greatest, most consistent increase in specific humidity and relative humidity. In contrast, Northeast India and Jammu & Kashmir were observed to have declining relative humidity. These findings are in line with our study.
Studies attribute higher evapotranspiration rates to climate change, the urban heat island effect, irrigation practices, and horticultural activities, particularly in northern India (Bal, Prasad, and Vinod 2022).
3.2 Sub-component-wise findings from the indices for hazard, exposure, and vulnerability
We constructed hazard, exposure, and vulnerability indices as key sub-components of the composite HRI. We derived the index by applying weighted scores to individual hazard indicators, ensuring a comprehensive representation of heat risk factors. Figures 18 to 20 present the individual findings from all three indices, providing a detailed assessment of the factors that contribute to overall heat risk.
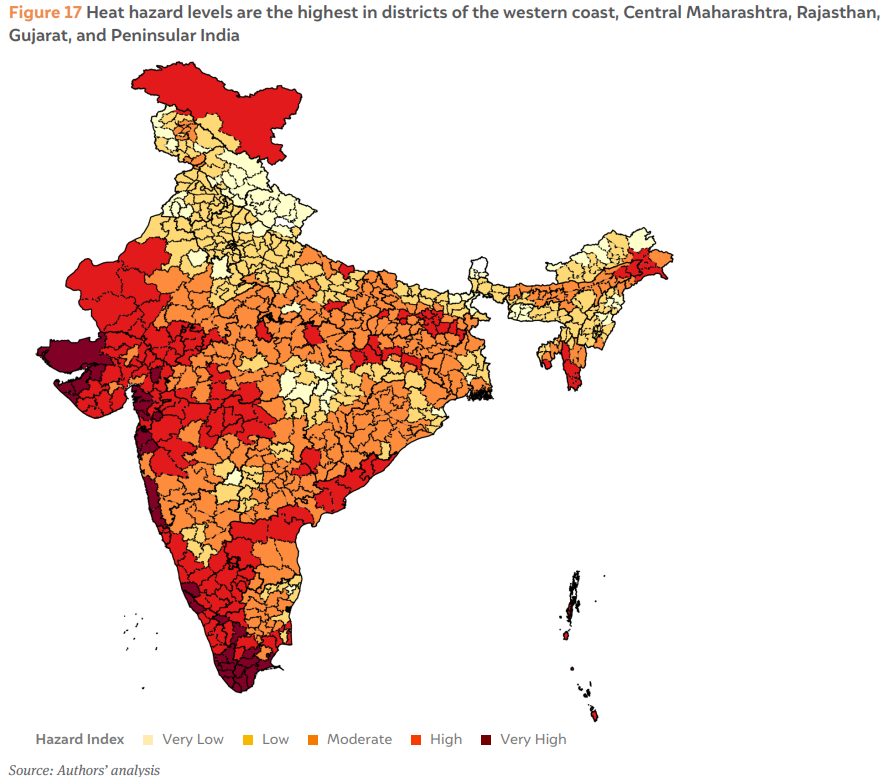
Aggregating the climatological analysis of heat patterns, our findings indicate that the heat hazard index is highest in districts along the western coast and Peninsular India. This trend is primarily driven by the increasing frequency of very warm nights and a declining DTR. Additionally, Rajasthan, Vidarbha, and Andhra Pradesh rank high on the index due to their historic susceptibility to extreme heat, since plains geography creates favourable conditions for prolonged heat events. In contrast, hilly regions generally exhibit low to very low heat hazard levels, except Arunachal Pradesh—the only state in Northeast India that the IMD has classified as heatwave-prone.
These findings underscore shifting patterns in extreme heat in India, extending beyond historically known hotspots such as Vidarbha to include coastal districts, which are emerging as significant heat prone areas.
Land and coastal heatwaves are increasing under the influence of global warming. Atmospheric research reveals that coastal heatwaves—characterised by elevated humidity— can exacerbate the effects of extreme temperatures on human health. In India, heatwaves tend to emerge in the northwest and propagate towards the northeast or southeast, which highlights the need to study how heatwaves evolve, keeping in mind the difference between coastal and land heatwaves (Dar and Apurv 2024; Zhang, He, and Guan 2025).
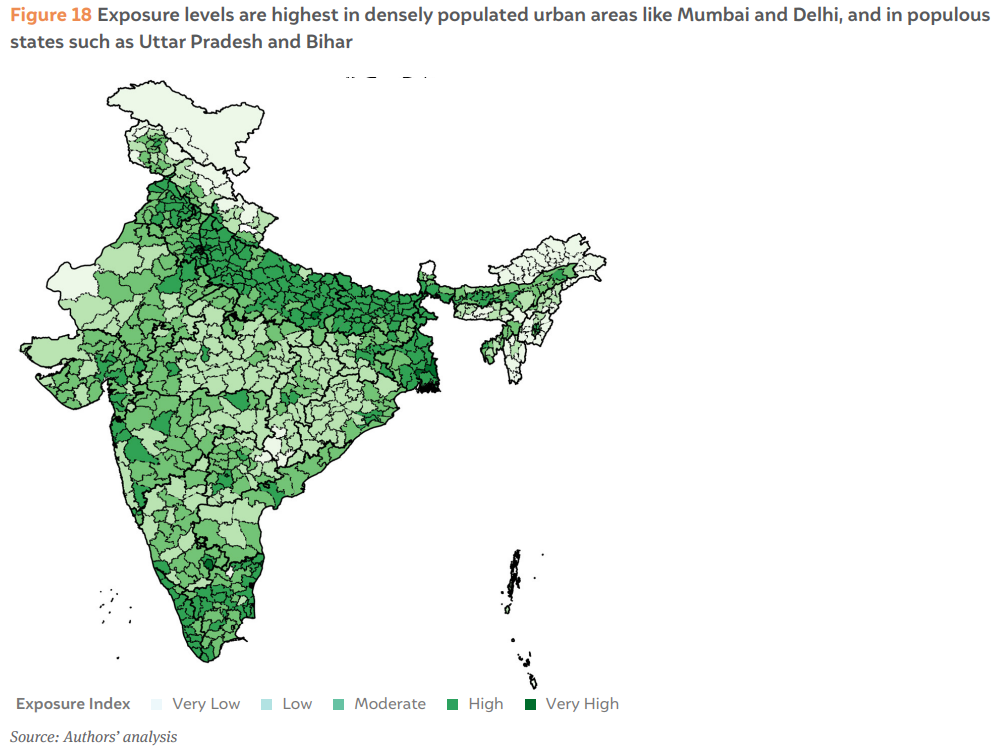
While heat hazard analysis forms the foundation of this study, it is the interactions between hazard, exposure, and vulnerability that ultimately determine heat risk. Our analysis shows that exposure—defined by population density, building density, and gross district domestic product—is highest in districts across the Indo-Gangetic Plains as well as in metropolitan regions such as Mumbai, the National Capital Territory of Delhi, and Kolkata. High population density and economic activity amplify the impact of extreme heat, putting more people and livelihoods at risk.
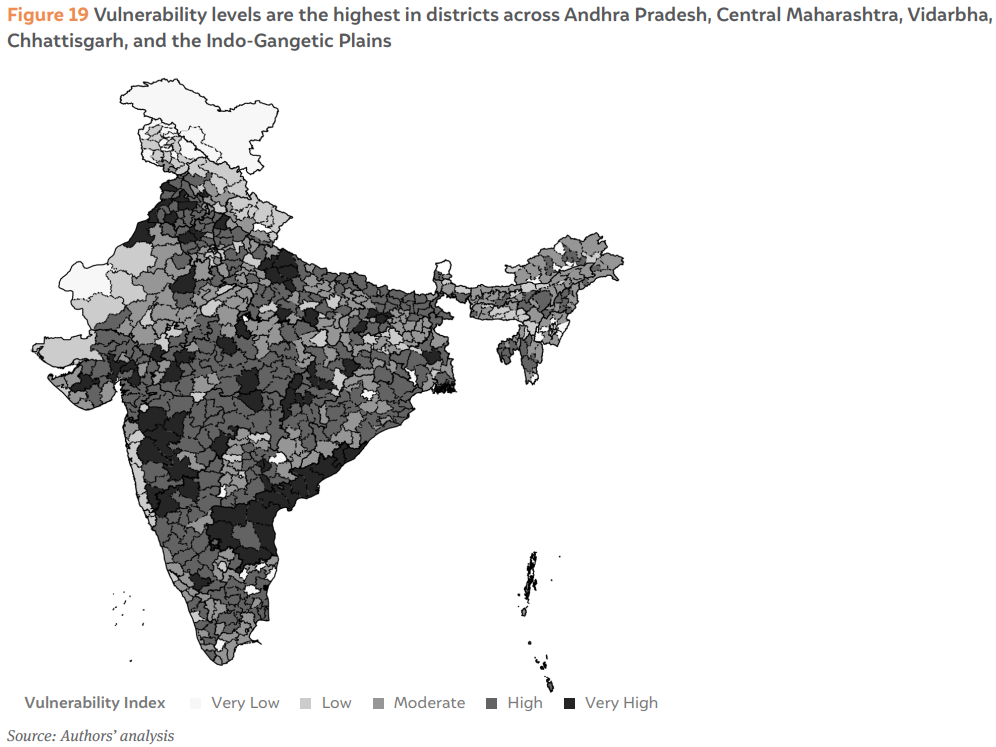
We identified districts in central Maharashtra, Andhra Pradesh, Chhattisgarh, Punjab, Haryana, Uttar Pradesh, and Bihar as high to very high in terms of vulnerability
In these regions, vulnerability is driven by two key factors.
Sensitivity
Districts in central Maharashtra, Vidarbha, and Andhra Pradesh exhibit high sensitivity due to the presence of a large outdoor working population that is predominantly engaged in agriculture and thus more susceptible to heat stress. Additionally, empirical studies in India have identified the eastern zone as the most vulnerable area in the country (Biswas and Nautiyal 2023). The Department of Science and Technology’s study, Climate Vulnerability Assessment for Adaptation Planning in India Using a Common Framework, highlights that the states with relatively high vulnerability are located in the eastern parts of the country, namely, Jharkhand, Mizoram, Orissa, Chhattisgarh, Assam, Bihar, Arunachal Pradesh, and West Bengal (DST 2020).
These findings are reflected in the IMD’s historical disastrous heatwaves data, documented in its Climate Hazards and Vulnerability Atlas of India. Andhra Pradesh ranks the highest among Indian states with 700–1,000 heatwaves days between 1969 and 2019, each associated with at least one fatality.
Health and socio-economic vulnerabilities
In Punjab, West Bengal, Kerala, Karnataka, and Tamil Nadu, vulnerability is linked to a high prevalence of non-communicable diseases such as anaemia, hypertension, and diabetes, which exacerbate heat-related health risks. Chhattisgarh’s vulnerability is notably high due to its large ST and SC population. Social and economic discrimination has limited their access to adaptive resources.
Conversely, districts demonstrate lower vulnerability when their population’s adaptive capacity is high. Key determinants of adaptive capacity include: i) high green cover, which moderates local temperatures; ii) greater availability of healthcare infrastructure, measured as the number of health centres per 1,000 people; iii) widespread household electrification, which ensures access to cooling mechanisms; and iv) improved access to drinking water within the household premises. These factors help lower vulnerability scores in several districts, highlighting the critical role of infrastructure, healthcare, and access to basic services in mitigating heat risk.
3.3 Composite heat risk index
This section presents the findings from our composite HRI for all Indian districts. We derived the index by aggregating the values of its key sub-components—hazard, exposure, and vulnerability—as per the IPCC AR5 risk assessment framework.
Hazard, exposure, and sensitivity (part of vulnerability) positively correlate with risk, meaning that higher values of these components contribute to increased heat risk. In contrast, adaptive capacity (part of vulnerability) negatively correlates with risk, indicating that districts with greater adaptive capacity experience lower heat risk. While declining adaptive capacity amplifies risk, reductions in hazard, exposure, and sensitivity mitigate the overall risk from extreme heat. ES Figure 2 presents the district-level HRI for India, and Table 6 provides the state-wise aggregated findings.
Roadmap of the methodology to assess the climate co-benefits of the SUP ban in Tamil Nadu
Unlocking finance for NbS in Indian Cities
Locally-led Climate Action in the Global South
Towards Climate-resilient Indian Industries:
Roadmap of the methodology to assess the climate co-benefits of the SUP ban in Maharashtra