Home
Council on Energy, Environment and Water Integrated | International | Independent
Paper

Mitigation pathways towards national ambient air quality standards in India

Pallav Purohit, Markus Amann, Gregor Kiesewetter, Peter Rafaj, Vaibhav Chaturvedi, Poonam Nagar Koti, Zbigniew Klimont, Jens Borken-Kleefeld, Adriana Gómez Sanabria, Wolfgang Schöpp, Robert Sander
December 2019 | Clean Air

Suggested Citation: Purohit, Pallav, Markus Amann, Gregor Kiesewetter, Peter Rafaj, Vaibhav Chaturvedi, Hem H. Dholakia, Poonam Nagar Koti, Zbigniew Klimont, Jens Borken-Kleefeld, Adriana Gomez-Sanabria, Wolfgang Schöpp, Robert Sander. 2019. “Mitigation pathways towards national ambient air quality standards in India.” Environment International,, Vol 133, Part A, 105147. https://doi.org/10.1016/j.envint.2019.105147

Overview

This study explores pathways towards achieving the National Ambient Air Quality Standard (NAAQS) in India in the context of the dynamics of social and economic development. To conduct such an assessment, it employs a multi-disciplinary scientific framework consisting of two well-established scientific modelling tools. 1) The Global Change Assessment Model (GCAM) model that investigates the socio-economic drivers of pollution, with particular emphasis on the energy sector. 2) The Gas-Air Pollution Interactions and Synergies (GAINS) model to assess the effectiveness of policy interventions on population exposure and health impacts. Further, it analyses India's air quality in the current situation, the macroeconomic trends driving future evolution, the likely effects on air quality for the current policies, and the scope for intervention measures.

Spatial origin of ambient PM2.5 exposure in the Indian States, 2015 (ranked by decreasing shares of pollution inflow)

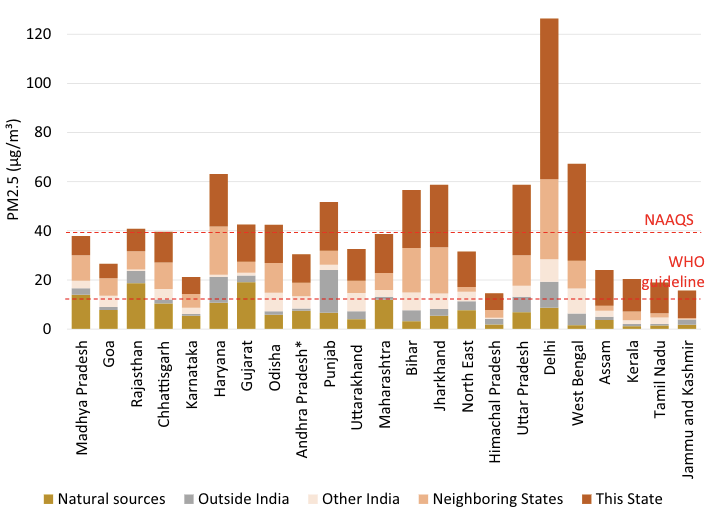
Source: Author's analysis

Key Highlights

  • In 2015, more than half the Indian population (~ 670 million people) was exposed to ambient PM2.5 concentrations exceeding India's NAAQS.
  • Only less than 1 per cent enjoyed air quality conforming to the WHO guideline value of 10 μg/m3.
  • The largest sources of PM2.5 were the residential sector (52 per cent) with its incomplete combustion of solid fuels, and the industrial sector (18 per cent).
  • Agricultural activities such as livestock farming, fertilizer application, and manure management, etc predominantly released NH3 emissions.
  • The Indian government has currently implemented effective emission controls, but rapid economic growth is compensating its impacts.
  • Compliance with 2018 legislation will be essential to stabilise pollution levels despite economic growth. By 2030, full compliance could avoid a 70 per cent increase in the number of people living in areas that exceed NAAQS.
  • However, even with full implementation, the 2018 legislation will not be sufficient to deliver significant air quality improvements as the average population exposure to PM2.5 will not decline by more than 14 per cent in 2030.
  • Effective solutions require regional cooperation between cities and states. A significant share of PM2.5 particles found at any specific location originates from distant sources, which are often outside the immediate jurisdiction and control of the local authorities.
  • Any effective reduction of PM2.5 levels in ambient air and the resulting health burden needs to balance emission controls across sectors and sources.
  • Available policies and measures may bring air quality under NAAQS compliance. Advanced emission control technology (ACT) could further lead to emission reductions and improvements in air quality (about 10μg/m3 in 2050)
  • Sustainable development measures (SDS) can deliver a wide range of benefits. Combined with ACT, SDS measures could provide NAAQS-compliant air quality to about 85 per cent of the Indian population and reduce mean population exposure to PM2.5 by about one third compared to 2015.
Effective implementation of the post-2015 legislation will reduce population exposure to PM2.5 in India by up to 50 per cent in 2050. Further improvements are offered by advanced emission control technology measures (about 10μg/m3 in 2050) and sustainable development measures (about 7μg/m3in 2050).

Sign up for the latest on our pioneering research

Explore Related Publications