Council on Energy, Environment and Water Integrated | International | Independent
Suggested Citation: Biswas, Spandan and Aarathi Srinivasan. 2026. Advancing Solar Cell Manufacturing in India: Bridging Gaps in Cell Technology and Lowering Manufacturing Costs. New Delhi: Council on Energy, Environment and Water.
India’s solar module manufacturing capacity has expanded rapidly. However, domestic solar cell manufacturing capacities continue to lag behind, creating import dependence and supply chain vulnerabilities. To scale up, domestic manufacturers have to contend with high manufacturing costs while adapting to a rapidly changing technology landscape. Currently, higher costs for capital and consumables drive up Indian solar cell production costs in comparison to global counterparts, while structural challenges like import dependence, skill gaps, and lagging R&D lead to difficulties in developing indigenous capability.
This study proposes targeted actions for policymakers, solar cell manufacturers, equipment suppliers, and academia to make Indian solar cell manufacturing competitive on both cost and technology.
India has rapidly expanded its solar energy deployment over the past decade, emerging as one of the world’s largest and fastest-growing markets. However, this growth in deployment has not matched the growth of domestic manufacturing across the supply chain. Such a mismatch risks creating supply chain vulnerabilities in downstream segments, such as module manufacturing and deployment, due to continued import dependence (Premier Energies 2024; Vikram Solar 2024; Waaree Energies 2024a). As of March 2026, solar module manufacturing is the most established supply chain segment in the Indian solar PV industry, with a manufacturing capacity of 173 GW (MNRE 2026b). In comparison, nameplate solar cell manufacturing capacity is only ~30 GW, forming only 20 per cent of the module manufacturing capacity (authors’ analysis from Waaree Energies 2025; MNRE 2025a; Sinovoltaics 2025; ETEnergyWorld 2024; MNRE 2026a). For the remaining 80 per cent, module manufacturing would have to depend on imported cells primarily from China. Figure ES1 demonstrates the gap in growth between module and cell manufacturing.
Figure ES1. Module manufacturing capacity has outpaced cell manufacturing capacity by more than five times, creating high demand for new cell production
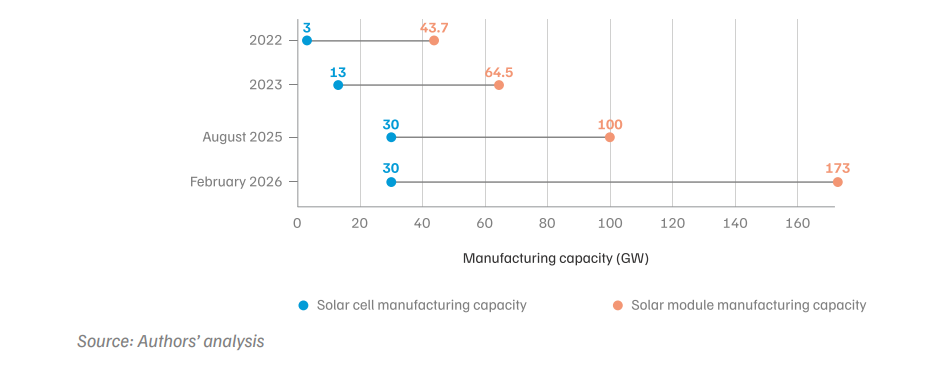
Scaling up solar cell manufacturing is thus necessary to solve this issue and improve supply chain resilience. Such scaling up is also critical for increasing domestic value addition through solar manufacturing, as nearly 60 per cent (InfoLink Consulting 2025c) of the solar module cost is attributable to the solar cells.
However, domestic solar cell manufacturers face a global landscape marked by declining prices and rapidly evolving technology—the global cell technology landscape has shifted, with PERC (passivated emitter rear contact) being replaced by TOPCon (tunnel oxide passivated contact) as the commercially dominant technology within two years (2023 to 2025). In 2 Image: CEEW contrast to this evolution, domestic solar cell manufacturing remains PERC-based, and faces higher manufacturing costs compared to Chinese counterparts. As a result, domestic solar cell manufacturing faces risks of technology lock-in and lack of cost competitiveness.
Hence, vertical integration into solar cell manufacturing must be accompanied by the development of technological capabilities and the reduction of manufacturing costs to build long-term competitiveness. The objective of this report is to identify the key priority areas and strategic interventions that should be targeted by policymakers and domestic solar manufacturers to achieve this twin goal.
This study adopts a techno-economic lens to arrive at the key findings, drawing from secondary literature and stakeholder consultations. Further, the interventions have been mapped by considering domestic policies, actions taken by other nations, and their relevance to the identified gaps.
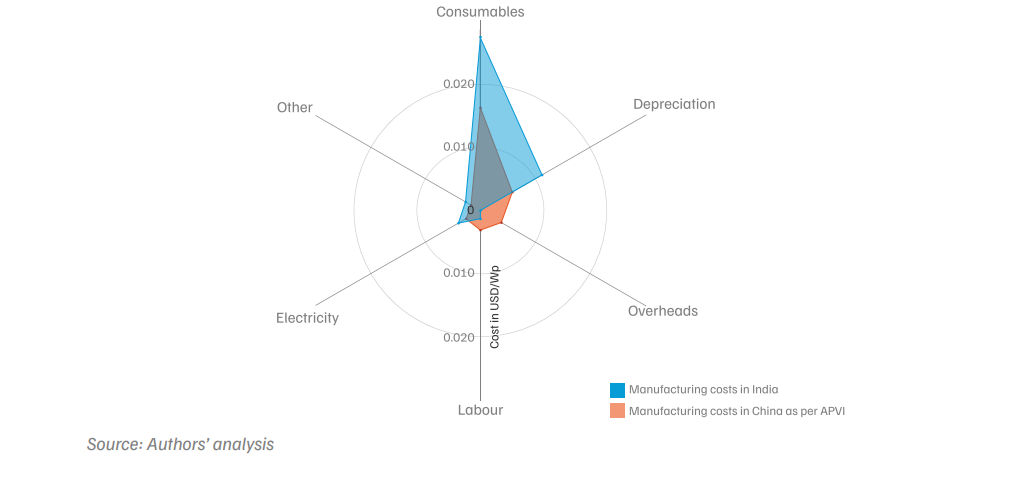
Figure ES2. Higher costs in consumables and depreciation make cell manufacturing ~40% more expensive in India than China
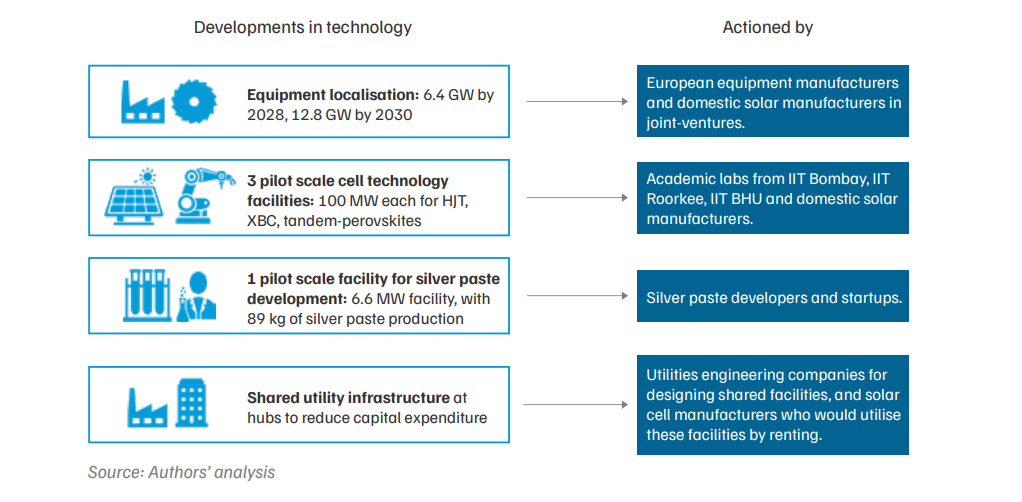
1. MNRE could develop shared infrastructure for machinery localisation, cell technology development, and upfront capital-cost reduction: A national framework should be created to bridge the gap between laboratory research, pilot-scale validation, and commercial deployment. The key priorities are as follows.
2. MNRE could offer one-time capital subsidy to PLI winners to bridge capital expenditure gaps: Based upon our calculation, a one-time capital subsidy of 15 per cent would assist in bridging the capital expenditure gaps between Chinese manufacturers and domestic PLI winners. Execution of the PLI-allocated manufacturing capacity would double the solar cell manufacturing capacity, from nearly 30 GW to 60 GW.
Figure ES3. Framework for developing machinery, technology, materials, and reducing upfront manufacturing costs
3. MNRE could develop skilling programmes and training centres to upskill process engineers and build domestic technological capacity: Scaling solar cell manufacturing will require a substantial increase in skilled process engineers and technicians. Dedicated training centres should be established in key manufacturing states, supported by industry partnerships and specialised curricula targeting process optimisation, equipment handling, and advanced cell technologies. The MNRE, in collaboration with the All India Council for Technical Education (AICTE), can take charge of curriculum and courses development, while the Ministry of Education (MoE) and Ministry of Skill Development and Entrepreneurship (MSDE) can then serve as stakeholders responsible for implementing the courses through establishing the dedicated training centres.
4. Ministry of Commerce and Industry (MoCI) could push for strategic asset acquisition and technology transfer in trade policy: MoCI can negotiate easing of regulations for acquisition of distressed foreign manufacturing assets and intellectual property through trade and investment negotiations. This will push private players to acquire distressed companies. Such acquisitions can accelerate technology upgrading, reduce capital costs, and enable faster entry into advanced cell technologies without duplicating global R&D investments.
By shifting policy focus from module-led expansion towards technology-driven, vertically integrated solar cell manufacturing, India can stabilise its domestic manufacturing base, reduce strategic vulnerabilities, and position itself as a competitive player in a diversifying global solar value chain. Timely and coordinated action across policy, industry, and academia will be critical to ensuring that today’s manufacturing scale translates into durable industrial leadership over the next decade.
The global transition to renewable energy has positioned solar photovoltaic (PV) technology as a cornerstone in addressing the trilemma of balancing energy security, affordability, and environmental sustainability. Unlike fossil fuels, disruptions in the supply of renewable energy technologies such as solar PV do not immediately affect a country’s energy system, contributing to energy security (IEA 2024). The levelised cost of electricity (LCOE) of solar PV was around USD 61 per megawatt-hour (MWh) in 2024, much lower than LCOE from fossil fuel sources like coal, which is around USD 118 per MWh in 2024 (Lazard 2024), showcasing its affordability. Along with this, solar PV systems do not directly emit greenhouse gases during energy generation, making them an ideal alternative to fossil fuels for reducing carbon emissions.
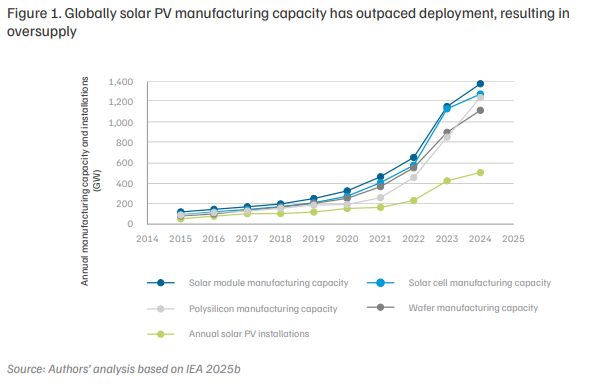
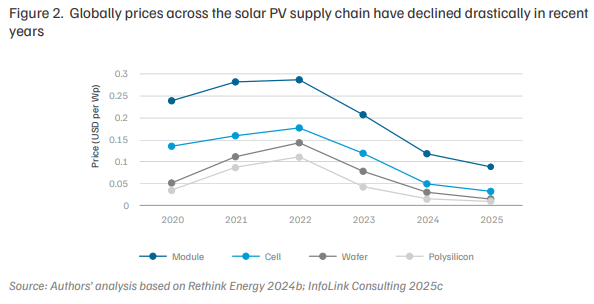
Solar PV installations have surged worldwide, with annual solar PV installations rising from 51.8 gigawatts (GW) in 2015 to an estimated 507.2 GW in 2024 (IEA 2025b). This has been driven by rising solar PV module manufacturing capacity, which has grown from nearly 120 GW in 2015 to 1,379 GW in 2024 (IEA 2025b), as shown in Figure 1. While manufacturing capacity has grown to support higher deployment, annual solar PV deployment remains less than half of total capacity across the solar supply chain. This imbalance has led to oversupply, driving down average market prices for each component, as shown in Figure 2.
Manufacturing growth is largely driven by Chinese producers who, by capitalising on government incentives, have achieved economies of scale, resulting in the solar PV supply chain becoming heavily concentrated in China. Out of the total global manufacturing capacity, 92 per cent of polysilicon production, 98 per cent of ingot and wafer production, 91.8 per cent of solar cell manufacturing capacity, and 84.6 per cent of solar module assembling capacity are located in China (SolarPower Europe 2025). Despite the manufacturing overcapacity in China, the declining prices have also affected profitability of Chinese manufacturers such as Jinko Solar, LONGi, JA Solar, and Trina Solar, who are locked in fierce competition to retain market share amidst the issue of manufacturing overcapacity. The fall in polysilicon prices, while reducing the cost of production, has undervalued the inventories of Chinese manufacturers. This has led to heavy investment in technological innovations to outperform peers in terms of efficiency and manufacturing costs. The development of such technological innovations has been captured in the next subsection.
1.1 A dynamic market: Solar cell efficiencies rise due to ever-evolving technology market
Solar PV technology can be categorised as either silicon-based or thin-film-based. Globally, silicon-based solar PV is the dominant technology, with a market share of nearly 97.5 per cent, while thin-film technologies make up the rest (Fraunhofer ISE 2024). The supply chain for silicon-based solar PV modules consists of producing polysilicon from metallurgical grade silicon, melting polysilicon to make ingots, slicing them into wafers, utilising the wafers to make solar cells, and assembling the solar cells into modules using bill-of-material (BOM) components such as solar glass, encapsulant materials such as ethylene vinyl acetate sheet (EVA) and polyolefin elastomer (POE), backsheets and junction boxes. Due to its prevalence, this report exclusively focuses on silicon-based PV technology.
Solar cell technologies are constantly evolving in terms of efficiency, costs, and market share. Among silicon-based cells, the different cell technologies that have been commercialised are passivated emitter rear contact (PERC), tunnel oxide passivated contact (TOPCon), heterojunction (HJT), and different variants of Back Contact (BC) on either TOPCon or HJT, termed as XBC. There have been changes in wafer technology too, with the industry shifting from multi-crystalline wafers to monocrystalline wafers. The commercialisation and gradual development of these different cell technologies have been reflected in increasing photovoltaic conversion efficiencies. The photovoltaic conversion efficiency refers to the percentage of incident solar energy a solar cell or module can convert into electrical energy, and it has risen from a meagre 14 per cent in 1977 to nearly 27.8 per cent in 2025 (Green et al. 2025). The improvements in photovoltaic conversion efficiency offered by advanced solar cell designs contribute to a lower LCOE (Wang et al. 2011) which acts as an incentive for the industry to focus on manufacturing and adopting these solar cell technologies.
Rapid R&D and commercialisation have led to solar cell efficiencies rising from 21.7% in January 2023, to 24.5% in June 2025, across different evolving technologies globally.
Global manufacturers are pushing for continuous technological innovation to push efficiencies up for solar cell technologies, and this is captured in Figure 3.
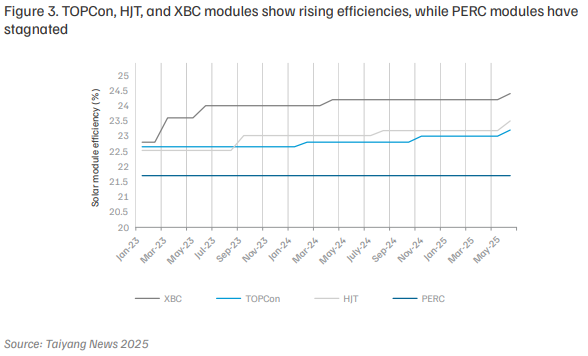
PERC, which dominated the global market till 2023, appears to be the most stagnant technology in terms of efficiency improvement. Since 2023, TOPCon has taken over as the leading commercially available technology, with an estimated market share of nearly 60 per cent (VDMA 2025). This has been due to both the higher efficiencies promised by it, and its similar manufacturing cost to PERC. This evolution in market share is captured in Figure 4. While HJT and XBC exhibit higher cell efficiencies than TOPCon, they have low market shares due to their higher manufacturing costs. However, they are predicted to grow in the future, making up nearly 50 per cent of the global market post 2030 (VDMA 2025).
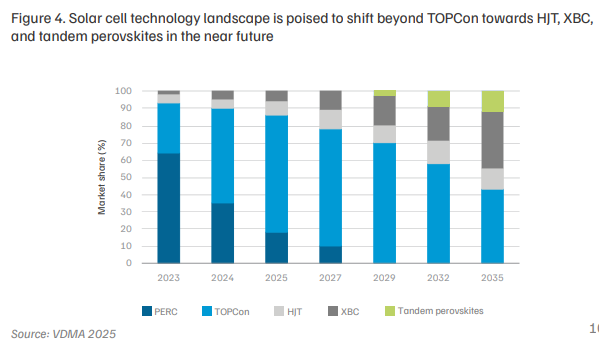
The eventual rise of HJT and XBC cell technologies is predicated on their achieving cost competitiveness with TOPCon. Beyond the current commercially available technologies, alternative technologies such as tandem perovskites are also predicted to enter the global market post 2030. Tandem perovskites have the potential for solar cell efficiencies higher than conventional silicon-based solar cells (PV Magazine 2024), and are yet to reach maturity.
The change in market share for each technology thus depends on their efficiencies, their scale of maturity, and how complex the manufacturing process is. The transition from PERC to TOPCon was facilitated by the similarities in their manufacturing processes, and similar capital expenditure—the average capital expenditure for PERC and TOPCon are USD 34.5 million per GW (CRISIL 2024) and USD 33.5 million per GW (CRISIL 2024; APVI 2024), respectively. In contrast, while HJT has fewer process steps, it has a much higher average capital expenditure, at USD 72 million per GW (CRISIL 2024).
Compared with silicon-based solar cells, the futuristic tandem perovskite cells are estimated to have lower production costs. The capital expenditure for setting up a perovskite manufacturing plant is estimated to be one-fifth of the capital expenditure required for a silicon solar manufacturing plant (Rethink Energy 2024a). Further, perovskite manufacturing processes operate at much lower temperatures than conventional silicon solar manufacturing, meaning lower energy consumption and operating costs (Mitsui & Co Global Strategic Studies Institute 2024). Lower energy consumption also entails a lower emissions profile associated with perovskite manufacturing. Further technical details and description of all the solar cell technologies mentioned (PERC, TOPCon, HJT, Back Contact, and perovskite) are provided in Annexure 3.
The historical and predicted changes in market share reveal the dynamic nature of solar cell technology, with Chinese manufacturers focusing on technological breakthroughs to increase conversion efficiency, while optimising for cost. Indian manufacturers thus must now contend with this dynamic technology landscape while competing with historically low market prices. The next subsection will detail how the domestic solar PV sector has evolved in terms of deployment, manufacturing, and technology.
1.2 How has India fared within this sector?
The Government of India has set a Nationally Determined Contribution (NDC) target of achieving 500 GW of cumulative electric power generation from non-fossil fuel sources by 2030, and solar photovoltaic sources are expected to contribute 292 GW (over 50 per cent) to this target (CEA 2023).
Supply-side policies such as Production-Linked Incentive (PLI) scheme have incentivised domestic manufacturers to carry out vertical integration across the solar PV supply chain. Demand-side policies include domestic content requirement (DCR) schemes such as Pradhan Mantri Kisan Urja Suraksha evam Uthaan Mahabhiyan (PM-KUSUM) and Pradhan Mantri-Surya Ghar Muft Bijli Yojana, which require domestic solar cells and modules to be used for rooftop solar PV installations and distributed renewable energy installations.
Additionally, similar to the Approved List of Models and Manufacturers (ALMM) List I, which acts as a non-tariff barrier for domestic modules against imports, the government plans to implement the ALMM List-II from June 2026 to create demand for domestic cells (MNRE 2024a).
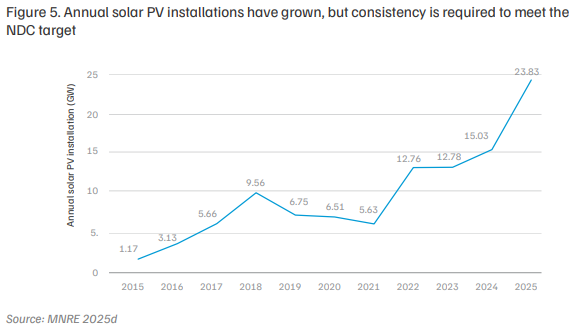
As of February 2026, India’s installed solar capacity stands at 140.60 GW (MNRE 2025c), and the annual solar PV installation in FY 2025 was 23.83 GW, as given in Figure 5. Thus, around 151.4 GW needs to be installed over the next four years to meet the NDC target, which entails an annual average deployment of nearly 37.85 GW.
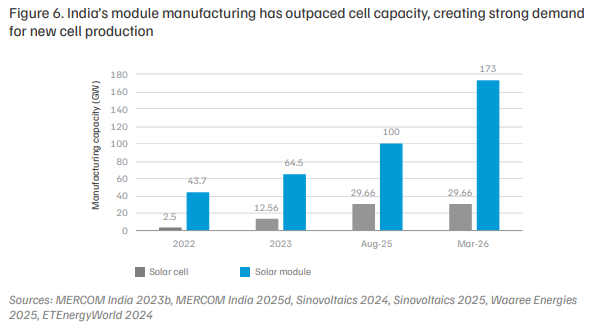
While deployment rates are short of the required installations, module manufacturing capacity enlisted in ALMM List-I reached 173 GW in March 2026 (MNRE 2026b). However, 80 per cent of this would be dependent on imported solar cells from China as the domestic solar cell manufacturing capacity stands at 29.66 GW (Waaree Energies 2025; MNRE 2025a; Sinovoltaics 2025; ETEnergyWorld 2024; MNRE 2026a), as shown in Figure 6. This gap in the domestic module and cell manufacturing capacity needs to be bridged in a timely fashion to reduce industry’s exposure to supply chain vulnerabilities, as well as ensure compliance with upcoming policy mandates like the ALMM List-II.
Domestic cell manufacturing is mainly PERC-based, with a few manufacturers producing TOPCon. Previously dominant BSF (back surface field) solar cell technology, has very minor production share now. A breakdown of the manufacturing capacities for different cell technologies has been provided in Figure 7.
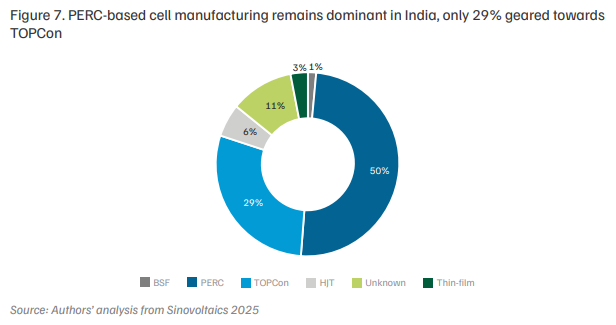
Out of 29.66 GW of solar cell manufacturing capacity, BSF accounts for 0.43 GW, PERC for 14.76 GW, TOPCon for 8.5 GW, HJT for 1.72 GW, thin-film (cadmium telluride) for 3.3 GW, while around 0.9 GW is unknown—not clarified by solar cell manufacturers. A detailed manufacturer-wise breakdown is provided in Annexure 1. Recognising the global trend of the rising importance of TOPCon, several Indian manufacturers have announced expansion plans to set up TOPCon-based manufacturing facilities—amounting to nearly 22 GW—by March 2027. A detailed manufacturerwise breakdown of such expansion plans has been provided in Annexure 2.
The government has also imposed a Basic Custom Duty of 20 per cent and Agriculture Infrastructure Development Cess (AIDC) of 7.5 per cent on imported solar cells, to protect domestic cell manufacturing (Ministry of Finance 2025). Further, on 29 September 2025, the Directorate General of Trade Remedies (DGTR) recommended antidumping duties up to 30 per cent on imported Chinese solar cells (DGTR 2025). If the ADD is levied, the cumulative tariff of 57.5 per cent would lead to an increase in the price of imported cells from USD 0.039 per Wp (InfoLink Consulting 2025b) to nearly USD 0.06 per Wp, which is near the lower end of the domestic solar cell price (nearly USD 0.07 per Wp), as of November 2025 (CRISIL 2025). While the duties make imported Chinese solar cells comparable to domestic solar cells in terms of price, domestic solar cell manufacturing remains more expensive than Chinese cells, and the removal of duties would ultimately lead to non-competitiveness. Therefore, domestic solar cell manufacturing currently faces a twin-problem of higher manufacturing costs and a lag in adoption of current mainstay solar cell technology.
57.5% import tariffs on imported solar cells have narrowed the gap with domestic market prices – yet, higher production costs and technology adoption lag constrain capacity expansion and competitiveness.
1.3 Twin problem of high manufacturing costs and technology lag
To reap the benefits of indigenisation, the twin problems of higher manufacturing costs and technological lag must be addressed, and for that, their causes must be identified. The research objective of this report is to identify what causes these two problems and identify strategic interventions that policymakers and domestic manufacturers can carry out that would solve them. Due to the dominance of silicon-based solar cell technology (97.5 per cent of the total market share worldwide), the report focuses on costs, components, technology, and machinery aspects of silicon-based solar cell manufacturing only.
Overcoming these challenges will help the domestic manufacturing industry achieve indigenisation of solar cell manufacturing, leading to supply chain resilience. Furthermore, this would enable Indian manufacturers to capitalise on the prevailing ‘China Plus One’ sentiment in international markets, and become a significant player in diversifying global solar supply chains. This would help domestic manufacturers to expand their export markets. Historically, more than 97 per cent of India’s solar exports across FY 2023, FY 2024, and FY 2025, have been geared towards the United States (Sharma, Gulia and Garg 2024). However, due to 18 per cent tariffs being levied on Indian exports to the USA (Ministry of Commerce 2026), along with ongoing anti-dumping duties (ADD) and countervailing duties on Indian solar cells and modules by the US Department of Commerce and US International Trade Commission (USITC) (USITC 2025), this export market has now come under threat. Vertical integration, starting with the production of solar cells, would also aid in the creation of new jobs, stimulate investment, and create market opportunities.
We carried out a comprehensive literature review to identify the current solar cell technology landscape. This included identifying the cost-drivers of solar cell manufacturing in Chapter 2, and identifying key technological issues for domestic solar cell manufacturers in Chapter 3. We further complemented findings from the literature review with stakeholder consultations, and identified the specific factors contributing to high domestic manufacturing costs and persistent technological lag. Finally, we have provided key recommendations that will help policymakers and stakeholders navigate these challenges to establish a resilient and future-proof solar cell manufacturing industry. We drew up these recommendations by considering existing domestic policies, comparing what policy measures other nations have taken, and the key gaps identified from the analysis.
Prices for components across the solar supply chain have hit historic lows, as detailed in Figure 2. Market prices of Chinese solar cells were around USD 0.038 per Wp (Infolink Consulting 2025c) in November 2025, much cheaper than domestically manufactured solar cells, which can have market prices as high as USD 0.07 per Wp. Even after the implementation of a total of 57.5 per cent of duty (BCD and ADD) on imported solar cells, the price of imported solar cells is in the range of 0.06 USD per Wp, which is still cheaper than the price range of domestic solar cells. The market price of solar cells is determined by both supply and demand, and the production cost of solar cells. As 91.8 per cent of global solar cell manufacturing capacity is concentrated in China, the supply side price dynamics are influenced by Chinese manufacturers.
However, this pricing regime is beginning to shift. China’s decision to phase out value-added-tax (VAT) export rebates for solar wafers, cells, and modules from 1 April 2026, after an earlier cut in late 2024, has already raised export and domestic pricing along the entire supply chain, and is shifting sourcing and trade patterns worldwide. China previously reduced the export tax rebate for PV products to 9 per cent from 13 per cent in December 2024, as part of its broader efforts to curb overcapacity and deflationary price wars amid international trade tensions (PV Magazine 2025a; Reuters 2026). Spot-price data now reflects this, with rise in mono-PERC cell prices to averages near USD 0.047 to 0.056 per Wp (InfoLink Consulting 2025c). It is expected that cell prices will increase along with modules once rebates are removed. Project equipment and panel procurement costs are also expected to increase by 9 to 15 per cent (MERCOM India 2025a) in the short term.
While these developments may narrow the price differential at the margin, the structural gap between Chinese and Indian manufacturing costs remains substantial. For Indian manufacturers to compete sustainably, irrespective of short-term price corrections driven by Chinese policy, it is essential to reduce domestic production costs. This makes it imperative to systematically analyse and elucidate the differences in the cost structures of solar cell manufacturing in India and China. The subsequent sections, therefore, break down the key drivers of production cost in both geographies.
2.1 Breaking down cost drivers of Chinese and Indian solar cell manufacturing
The first difference between domestic and Chinese manufacturing set-up is the level of vertical integration. Leading Chinese manufacturers are vertically integrated across wafer, cell, and module production (InfoLink Consulting 2023), while Indian solar cell manufacturers have to depend on imported wafers. As Chinese manufacturers are vertically integrated, their cost of manufacturing solar cells does not include the cost of wafer sourcing.
The cost of manufacturing solar cells includes costs due to capital expenditure (which, when accounted for across the lifetime of a manufacturing facility, are termed as depreciation), consumables (such as wafer, silver paste, and other chemicals), labour, electricity, overheads, and other costs, such as maintenance of the manufacturing facility, overheads such as R&D, and costs due to shipping and tariffs (APVI 2024). Figure 8 provides a comparison of cost-of-manufacturing TOPCon solar cells in Chinese and Indian manufacturing set-ups. Given that TOPCon is the currently dominant solar cell technology and is expected to have a market share of at least 50 per cent till 2030, cost of manufacturing estimations for Chinese and Indian set-ups are based on TOPCon solar cell technology (VDMA 2025).
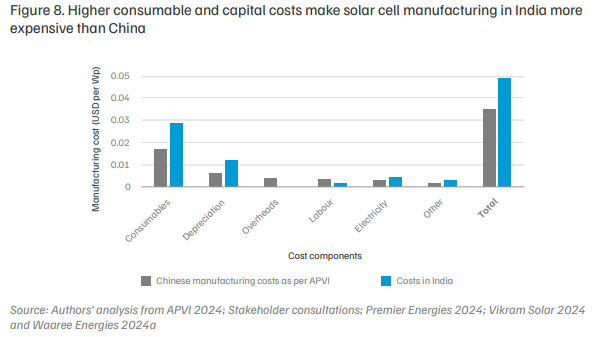
Consumables for the Indian estimate include both wafer and silver paste, while consumables for the China estimate include only silver paste. Other consumables, such as the chemicals in which wafers are dipped, form a very miniscule portion of the total costs, and hence are not included in the calculation. Further, depreciation for capital expenditure for Chinese set-ups is based upon literature, while depreciation for Indian manufacturing set-ups is calculated on the basis of capital expenditure estimation announced by Indian manufacturers in their draft red-herring prospectus (DRHP) documents. The depreciation calculation is shown in Annexure 5.
Consumables and capital expenditure are the major cost drivers that make Indian solar cell manufacturing more expensive than Chinese solar cell manufacturing. The next sections will explore the reasons behind this.
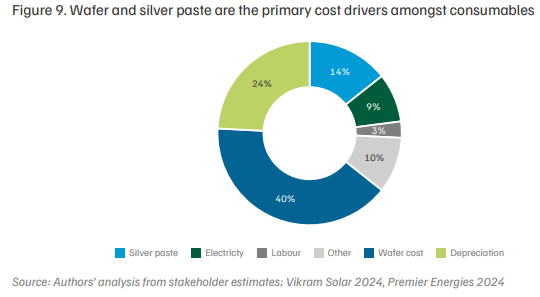
2.2 Cost attributed to various consumables
1. Wafer
For domestic solar cell manufacturing, wafer consumption is the highest cost driver, as shown in Figure 9. Domestic cell manufacturers depend on imported wafers, predominantly from China, which has 95 per cent of the global wafer manufacturing capacity (IEA 2024). The concentration of wafer manufacturing in China makes it vulnerable to disruption, and entails that a majority of the value addition for the domestic solar supply chain is situated outside. For example, a 7.7-magnitude earthquake on the Richter scale hit Myanmar on 28 March 2025, affecting China’s wafer production areas, particularly regions like Sichuan, Ningxia, Yunnan, and Inner Mongolia (InfoLink Consulting 2025b). The earthquake caused equipment issues such as wire breaks and furnace explosions, affecting production output, supply-demand balance, and thus leading to a 5–10 per cent increase in wafer price (JA Solar Tech 2025). Policy changes, including the lapse of the BCD exemption on imported silicon inputs and un-diffused wafers from 1 April 2026 will impact the cost of imports, leading to a direct cost escalation for Indian solar cell manufacturers (Ministry of Finance 2026). The measure compresses profit margins and structurally favors vertically integrated domestic producers with wafer capacity.
Wafer sizes have kept increasing, with a predicted market shift from M10 wafers, which have a dimension of 182 mm x 182 mm, towards G12 wafers and G12 rectangular wafers, which have a dimension of 210 mm x 210 mm and 210 mm x 182 mm, respectively (VDMA 2025). The shift to larger and rectangular wafers has led to greater power output of solar cells, and provided flexibility for manufacturers to produce solar cells of varying sizes, tailored to their module size requirements. Due to rapid changes in wafer size and shape, and changes to equipment required to process the wafers, manufacturers face uncertainty (VDMA 2025).
2. Silver paste
Silver paste is made using silver particles, glass frit, and an organic binder, and is produced by mixing, rolling pulp, and other processes (Maysun Solar 2023b). The process of making silver paste requires optimisation of the size and shape of silver paste particles, and has strong intellectual property protections (CEEW 2022). For a TOPCon solar cell, keeping aside the cost of importing wafers, silver paste consumption can contribute at least 20 per cent of the entire cost outside China (APVI 2024).
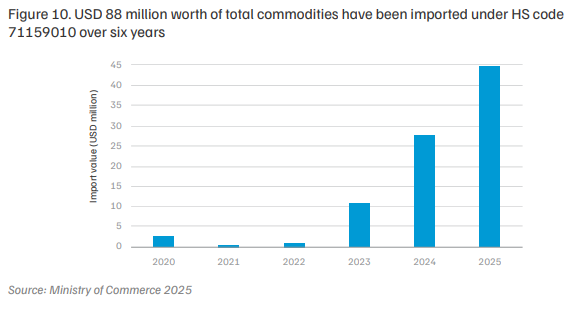
Import dependence for silver paste
Domestic manufacturers are completely import-dependent for sourcing silver paste from a few regions like China, Hong Kong, Taiwan and Singapore1 , predominantly under two HS codes2 : 71069290 and 71159010 (Ministry of Commerce 2025). The total value of commodities imported under these two HS codes are showcased in Figure 10 and Figure 11. The description of each of the HS codes are:
• 71159010: Other articles of precious metal or metal clad with precious metal.
• 71069290: Silver (including silver plated with gold or platinum), unwrought, semimanufactured, or powder form.
1. According to stakeholder consultations.
2. The Harmonised Commodity Description and Coding System, generally referred to as ‘Harmonised System’ or simply ‘HS’ is a multipurpose international product nomenclature developed by the World Customs Organization (WCO). It comprises more than 5,000 commodity groups, each identified by an eight-digit code, arranged in a legal and logical structure, and is supported by well-defined rules to achieve uniform classification (World Customs Organization 2025).
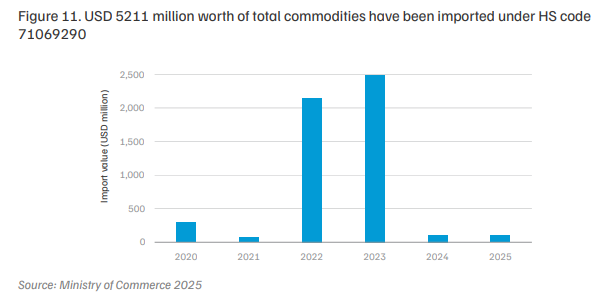
Analysis of import share changes across years for commodities under both HS codes reveals that imports under HS code 71069290 are distributed across multiple countries, as shown in Figure 12. This suggests that the HS code encompasses a range of commodities beyond silver paste. Given that silver paste is primarily sourced from China, the presence of significant import shares from other countries indicates the inclusion of other materials under this classification.
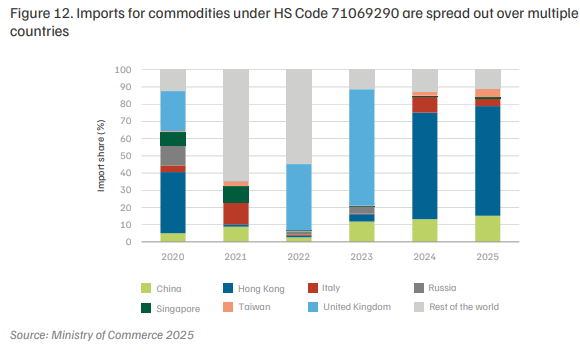
In comparison, imports under HS code 71159010 have consistently been dominated by China over the years, as illustrated in Figure 13.
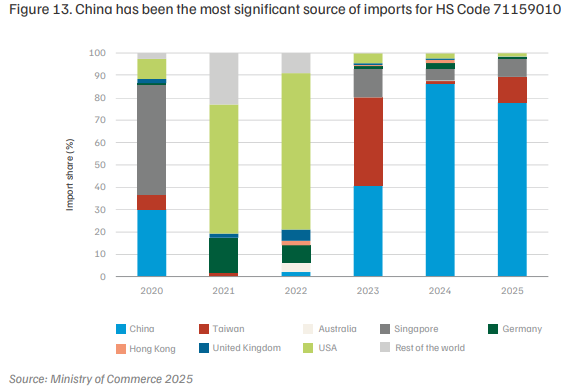
Overall, the difference in import volume and import share between the two HS codes signals a lack of clarity in classifying conductive silver paste into HS codes, which causes a lack of traceability of silver paste imports for solar PV manufacturing.
Cost contribution of silver paste to solar cell manufacturing
As of February 2026, front-side silver paste for fingerprinting, front-side silver paste for busbars, and rear-side silver paste were priced at USD 2,473 per kg (Shanghai Metals Market 2025b), USD 2,566 per kg (Shanghai Metals Market 2025a), and USD 1,712 per kg (Shanghai Metals Market 2025c), respectively. For Indian solar cell manufacturers, silver paste effectively costs 24 per cent more than Chinese competitors. This is due to a combined effect of import duties on silver paste, and subsidies granted to Chinese manufacturers upon sourcing silver paste from Chinese players. Assuming a 13.5 mg per Wp (VDMA 2025) consumption of silver paste for TOPCon solar cell, the base cost contributed by silver paste alone for cell manufacturing is USD 0.0314 per Wp. Further, silver paste imported to India under the two HS codes is subject to a 10 per cent customs duty (Central Board of Indirect Taxes and Customs 2025), raising costs to USD 0.0345 per Wp. In comparison, Chinese manufacturers benefit from subsidies of approximately 11.5 per cent on silver paste sourced domestically (APVI 2024), reducing their effective cost to USD 0.0278 per Wp. A comparison of these silver paste costs, base price and post-duty cost in India, and subsidised cost in China, is presented in Figure 14.
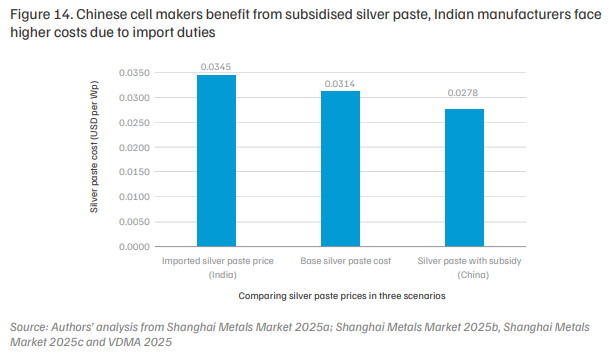
The removal of import customs duty on silver paste can bring the cost differential between Indian and Chinese players down from 24 per cent to 13 per cent.
Rising silver demand due to solar PV
Apart from rise in silver costs due to import dependence, there is a demand-supply imbalance, leading to rise in prices. At the end of 2025, total silver demand across various applications was 32,554 tonnes, eclipsing total silver supply at the end of 2025, which was 29,217 tonnes (The Silver Institute 2025). Further, silver demand from solar PV applications reached 17 per cent of total demand in 2025, rising from 8 per cent in 2016, as shown in Figure 15.
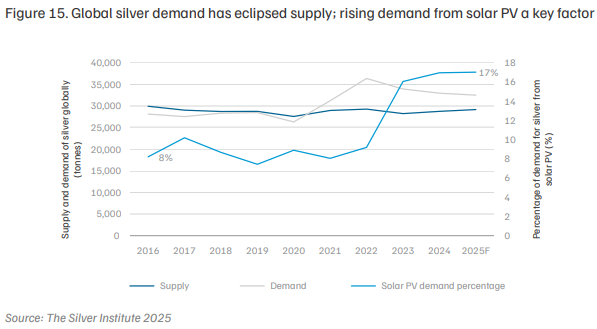
Figure 15 shows silver demand overtaking the supply, coinciding with the rise in silver demand from solar PV, which may entail a potential risk from rising silver prices. A long-term solution would be to either reduce silver paste consumption, or explore alternative materials to lower costs.
Technological advances in the reduction of silver paste consumption
One of the technical advances underway is the shift from multi busbar (MBB) technologies, which consist of nine busbars per solar cell of the thickness of 0.3 to 0.4 mm, to smart multi busbars (SMBB), which consist of 16 to 20 busbars per solar cell, enabling the usage of finer busbars of the thickness of 0.24 mm (Maysun Solar 2023a). Finer busbars reduce silver paste use, minimise shading, and lower electrical resistance, leading to lower costs and higher efficiency. A further shift from SMBB to zero busbar (0BB) technology is expected, as it eliminates the need for busbars by connecting the silver fingers with the ribbons attached to the modules, further reducing silver consumption, shading, and electrical resistance. Zero busbar technology can reduce silver paste consumption by 30 per cent, but is currently in the early stages of industrialisation, optimising the exact process of connecting the ribbons to the silver fingers (Maysun Solar 2024).
Assuming a silver consumption of 13.5 mg per Wp for TOPCon, a 30 per cent reduction through 0BB technology will lead to a reduction in silver consumption to 9.45 mg per Wp. This leads to a 30 per cent reduction in silver paste cost, pushing it down to USD 0.0242 per Wp and USD 0.019 per Wp for Indian and Chinese players respectively. However, R&D for such technologies are being led by Chinese manufacturers; Indian manufacturers lag behind in research and development due to a lack of industry and academia collaboration, a lack of R&D investment, and focus on scaling up commercialised technologies.
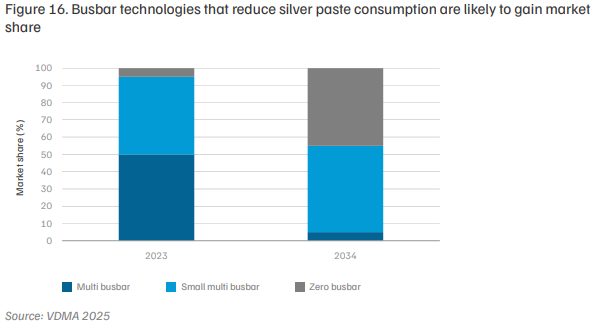
The market share for both SMBB and 0BB technologies is expected to increase from approximately 45 and 5 per cent respectively in 2024 to approximately 50 and 45 per cent in 2035 (VDMA 2025), with a decrease in the market share for MBB technologies from 50 to nearly 5 per cent in 2034 (VDMA 2025), as shown in Figure 16. Implementing advanced busbar technology in domestic cell manufacturing requires sourcing suitable equipment as well as developing the technical expertise to operate it. Chinese manufacturers are a step ahead in commercialising such technologies due to their close collaboration with their equipment suppliers, thus ensuring higher performance and, in this particular case, lower costs.
Another novel method of reducing silver paste consumption is replacing silver paste with a mixture of silver and copper paste (Taiyang News 2023a). In such pastes, copper particles are coated with silver, reducing the amount of silver required. These pastes, now entering commercialisation, are primarily aimed at HJT solar cells, which consume more silver than TOPCon cells (Taiyang News 2023a). Currently, hybrid silver and copper paste metallisation ratios of 20 per cent and 70 per cent are commercially available for HJT solar cell manufacturing (Taiyang News 2025a).
Adopting novel technological innovations such as 0BB and hybrid silver-copper pastes, can reduce silver consumption by 30% and 80% respectively.
3. Chemical consumables
The chemical consumables used in solar cell manufacturing consist of hydrochloric acid (HCl), hydrogen fluoride (HF), nitric acid (HNO3 ), potassium hydroxide (KOH), deionised water, and gases such as Diborane (B2 H6 ) and Silane (SiH4 ). Hydrochloric acid, hydrogen fluoride, nitric acid, and potassium hydroxide are used in surface damage etching and texturing, the initial steps of solar cell manufacturing. Chemicals such as deionised water are required in edge isolation, performed after emitter formation through diffusion (Taiyang News 2023b). Chemical gases like diborane and silane are used as feedstock material for emitter formation and passivation layer deposition. According to stakeholders, these gases are imported from outside, stored in bottling plants, and then transported to manufacturing facilities in tankers. Transportation and storage of these chemicals increase the indirect costs through warehousing and tanker requirements, creating a logistical challenge. For example, silane is an explosive chemical which must be stored offsite, and transported at USD 0.09 per km per tonne. This cost gets embedded into the overall manufacturing cost.
Table 1 compares the capital expenditure3 estimated from analysing the DRHP documents of two domestic manufacturers, Vikram Solar (Vikram Solar 2024) and Premier Energies (Premier Energies 2024). The original tables have been attached in Annexure 4.
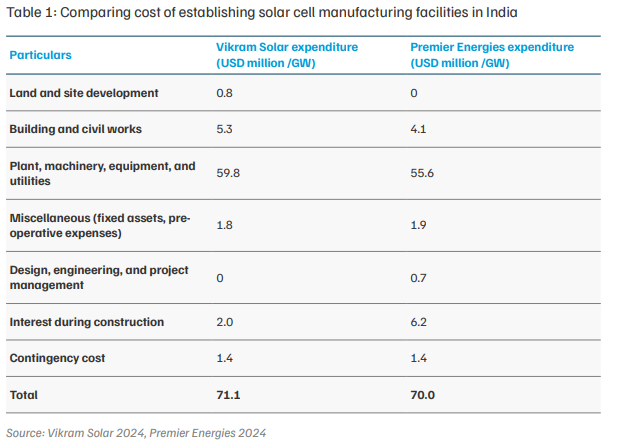
From Table 1, the average capital expenditure for establishing TOPCon cell manufacturing facilities is around USD 70 million per GW. In China, estimated capital expenditure for TOPCon cell manufacturing facilities can range from USD 25 million per GW (APVI 2024) to an average of USD 42 million per GW (CRISIL 2024). Thus an average of USD 33.5 million per GW of capital expenditure can be considered, which is nearly 48 per cent of India’s capex. Hence, Indian manufacturers require almost double the capital expenditure to set up solar cell manufacturing facilities compared to Chinese manufacturers. As the capital expenditure incurred for equipment and machinery significantly varies in India and China, the depreciation calculated based on their useful life under the straight-line method will also significantly vary. As depreciation is a revenue expenditure, it will affect the profitability of the company.
Stakeholder consultations reveal that the lower capital expenditure in China is due to the country’s larger manufacturing facilities, with dozens of GWs (Renewable Energy Institute 2024), leading them to reach economies of scale quicker. India’s largest solar cell manufacturing capacity is 5.4 GW, and the average size of a facility is around 2 GW (Sinovoltaics 2024), leading to longer time to achieve profitability. Additionally, Chinese manufacturers benefit from lower infrastructure costs, lower equipment costs sourced from Chinese manufacturers with no shipping costs, and subsidies for capital expenditure for building, civil works, and land, all of which reduce capital expenditure.
Domestic solar cell manufacturing faces the following challenges, based on the analysis carried out in this report.
The challenges portrayed in the previous chapter elucidate how domestic solar cell manufacturing is at risk of technological lag and non-competitiveness in terms of price. To address these challenges, we put forward four recommendations. These are drawn up for a period of 10 years, from 2026 to 2035, as estimated changes in market share are available till 2035 from literature (VDMA 2025).
Developing shared infrastructure for solar cell technology development would help in supporting indigenisation of solar cell manufacturing equipment, accelerating lab-scale innovations for solar cells and metallic pastes to commercial-scale manufacturing, and reducing capital expenditure associated with commercial-scale cell production.
Shared infrastructure can consist of expensive equipment such as advanced deposition tools, metrology equipment, reliability test facilities, and utility infrastructure, that individual firms or universities may not be able to easily afford. Firms would leverage processes, machinery, and technology developed through shared infrastructure, scaling them from pilot to commercial production. Such a framework will allow industries to participate in R&D without each firm spending on R&D individually, provide timely feedback on manufacturability, yield, and cost, and ultimately shorten the time period between proof-of-concept and commercial production.
The framework would enable the following four recommendations, that feed into the overall targeted roadmap that has been sketched out.
Further analysis of the investment needed, the targets, and additional policy support for these have been explained in the next sub-sections.
Along with creation of shared infrastructure, the MNRE, in collaboration with the MHI, can establish a dedicated ‘capital goods for solar cell manufacturing’ programme under the National Capital Goods Policy. The National Capital Goods Policy was established to boost the production of essential capital goods, such as machinery and equipment, across industries. In the fiscal year 2024–25, INR 184 crore or USD 21 million was allocated for the schemes being supported by the National Capital Goods Policy. Out of this, INR 134.55 crore or USD 15.8 million were released for utilisation in sub-schemes (Press Information Bureau 2025), which consisted of setting up centres of excellence and common engineering facilities, augmenting existing testing and certification centres, etc.
Figure 18. Due to favourable policy support, capital goods production across all subsectors has increased, with total production increasing by 72%
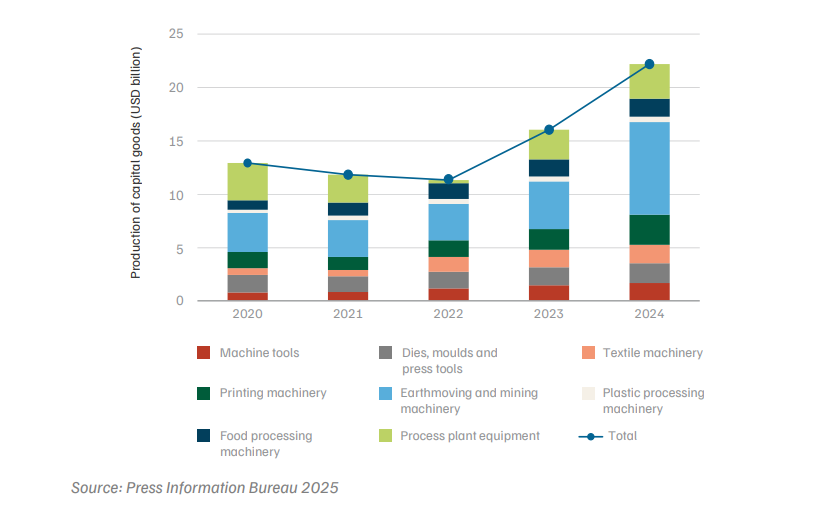
Due to such policy support, the production across all the eight different sectors has increased between the fiscal years 2019–20 and 2023–24 from USD 12.71 billion to USD 21.87 billion, as shown in Figure 18. Similar to these sectors, key equipment required in solar cell manufacturing, such as wet chemical tools, diffusion furnaces such as PECVD, LPCVD, ALD and PVD, and screen printers, can be included in the scheme by creating a separate sub-section under capital goods.
Stakeholders stated that one entire equipment line can produce 1.2 GW of solar cells annually. Given 30 GW of solar cell manufacturing is currently present, this would require production capacity of at least 25 equipment lines. Estimates suggest that an additional 86 GW of solar cell manufacturing capacity maybe commissioned by 2030 (PV Tech 2025), which would require nearly 70 equipment lines. Hence, a total of 95 equipment lines of production capability may be required. Domestic solar cell manufacturers spend an average of USD 41.5 million for sourcing one equipment line (Premier Energies 2024; Vikram Solar 2024), ensuring a market opportunity for local equipment producers from USD 1 billion to USD 4 billion.
A comprehensive EU-India free-trade agreement was concluded on 27 January 2026 (European Commission 2026). The agreement creates a platform to speed up supply-chain diversification, bilateral clean-tech manufacturing, and bankable European investments into India’s fast-growing solar market, supporting both equipment trade and joint technology development. The growth of Indian solar cell manufacturing presents a USD 1 billion to USD 4 billion market opportunity for solar cell equipment, incentivising foreign technology leaders in equipment manufacturing to set up production in India, and thus facilitating technology transfer. For the EU, accessing India’s rapidly expanding module capacity offers a non-Chinese supply source for certain components. For India, easier access to European high-quality balance-of-system (BOS) equipment and specialised components (high-efficiency cells, industrial PV glass, smart inverters) will support larger, higher-value projects.
India should strategically leverage the Memorandum of Understanding signed by National Solar Energy Federation of India (NSEFI) and SolarPower Europe (NSEFI 2025) to accelerate solar cell manufacturing equipment localisation and technology transfer. The platform can be used to attract European equipment manufacturers to establish production facilities in India, supported by structured knowledge-exchange and regulatory facilitation. To ensure market uptake, the government should introduce a preferential sourcing mechanism for domestically manufactured solar cell equipment, aligned with the PLI framework, enabling PLI-supported manufacturers to procure localised machinery. This would simultaneously increase domestic value addition, reduce import dependence, and create a viable market for local equipment manufacturers.
To compete in international markets, it is important for Indian solar cell manufacturing to become a technology leader from 2030 onwards. Given the predicted rise in market shares of highefficiency technologies such as XBC and HJT, and the potential commercialisation of perovskites post-2030, policy support for research and development for these technologies would be crucial. The policy support should consist of the creation of at least one pilot-scale (100 MW) cell manufacturing centre for each cell technology, led by premier academic institutions and solar cell manufacturers, to accelerate the commercialisation of advanced technologies. Localising foreign equipment will support the initiative by providing equipment for pilot lines, and aiding the development of new machinery for next-generation technologies.
Indian academia and manufacturers have shown interest in development and eventual commercialisation of tandem-perovskites. In December 2024, Waaree announced a strategic CSR relationship with IIT Bombay for R&D on perovskite solar cell technology (Waaree Energies 2024b), while in September 2022, Reliance acquired a 20 per cent stake in Caelux, a US-based enterprise that works on R&D and the commercialisation of solar perovskite technologies (MERCOM India 2023a). Further, in 2023, a perovskite start-up from IIT BHU called P3C acquired fund-raising of USD 250,000, with a further commitment of USD 3 million on a successful trial. The start-up seeks to demonstrate and develop flexible perovskite solar cells (Perovskite-info 2023). Despite the presence of R&D interest across academia and industry, no pilot mass production lines have been commissioned. In the absence of swift action, the Indian solar industry may fall behind other countries and China. Hence, prudent policy action that leads to establishing the first pilot perovskite facilities is essential.
According to stakeholder consultations, establishing one pilot scale facility of a 100 MW can require USD 100 million. Hence, the establishment of three pilot-scale cell manufacturing facilities may require around USD 300 million, and this would have to be funded by the domestic industry. In return for funding the establishment of pilot-scale facilities, successful technologies can be picked up for commercial production by industry players through patent-sharing or IP-sharing agreements. MNRE could act as a nodal agency, bringing industry players and the academia under the same umbrella. MNRE can further select the manufacturers who would contribute to financing pilot schemes and patent-sharing agreements, on the basis of those who have experienced revenue growth and showcase interest in adapting new solar technologies. Labscale activities related to tandem-perovskite solar cell development are taking place in India, and such a platform may help in eventual commercial production of these solar cell technologies. For example, a lab-scale tandem perovskite solar cell with 30 per cent efficiency was developed by ART-PV (Advanced Renewable Tandem Photovoltaics), a start-up incubated at IIT Bombay under the National Centre for Photovoltaic Research and Education (NCPRE) (Taiyang News 2025b). The relevant ministries should also leverage the EU-India agreement to co-fund pilot lines for advanced cell architectures, joint certification labs to mutually-recognise performance and reliability testing.
Policy action taken in this regard should support the development of solar cell technologies in the following phases:
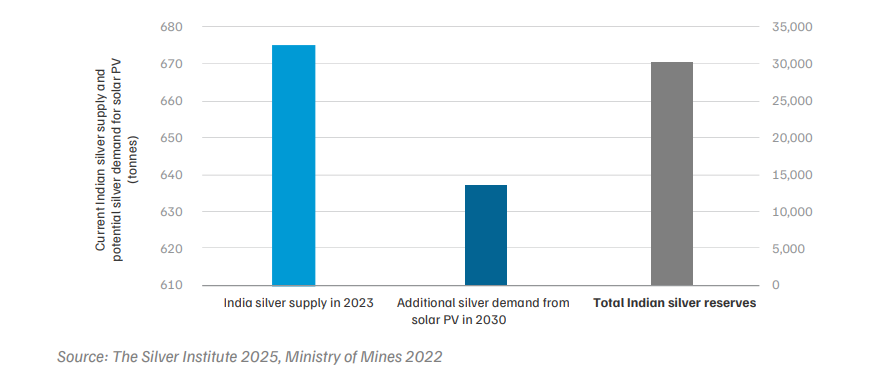
India’s total silver supply and reserves are sufficient to meet additional silver demand from solar PV in 2030, as showcased in Figure 19, if silver paste production is localised and commercialised. Therefore, strong policy support for pilot-scale activity can set the stage for the commercialisation of domestic silver paste production. Additionally, reducing silver paste usage through developing either copper-silver paste hybrids or innovative metallisation methods such as smart busbar and zero busbar metallisation, can be a way forward for reducing cost-of-manufacturing. These technologies can be developed only after building domestic silver paste manufacturing capability.
Figure 19. Indian silver supply and reserves can meet demand from solar cell manufacturing
A pilot-scale facility capable of developing and testing silver pastes with 99 per cent accuracy, 95 per cent confidence interval, and a population ratio of 50 per cent, would require a testing sample size of around 2,256.25 solar cells per day, which is equivalent to 18,050 W of solar cells per day (as one solar cell has wattage of 8 Wp). Thus, a pilot-scale facility of the scale of 6.6 MW per year and production capability of 89 kg silver paste per year (as the average silver paste consumption for TOPCon solar cells is 13.5 mg per Wp) would be required for research and development of indigenous silver paste. Such pilot-scale facilities would allow for testing of the final product over multiple production cycles, enabling industrial process validation.
Lab-scale activity is currently present for development of silver paste, as evidenced by the presence of ‘AnyD’, a lab-scale start-up that develops conductive silver paste for PV applications, among other things. This start-up was established at IIT Bombay in 2023 (AnyD Materials 2023). Upon determining the technology and financial requirements, pilot-scale centres co-led by industry and academia should be established to scale up and commercialisation. MNRE, along with industry players, can create a financing mechanism for indigenous silver paste production. In the long term, support should be extended to R&D on silver-copper paste hybrids to reduce manufacturing costs.
Action taken by industry, academia, and policymakers for indigenous silver paste development should thus contribute to the following achievements.
Alongside the development of indigenous silver paste, a distinct HS code should be established for imported silver paste used in solar cell manufacturing, and import duties should be eliminated in the short term to help reduce manufacturing costs. From 2026 to 2028, the HS code classification should be clarified, and import duty on silver paste should be removed entirely. By 2030, duties can be gradually reintroduced, starting with a 5 per cent rate in 2028, increasing to 10 per cent by 2030. From 2030 to 2035, the 10 per cent import duty should be maintained to provide continued support and protection for domestic silver paste production, encouraging long-term self-reliance.
Shared infrastructure for capital machinery localisation can be further mobilised to create an industrial ecosystem. Industrial parks, where equipment would be localised by European equipment manufacturers and domestic solar cell manufacturers, can provide equipment at lower costs to domestic manufacturers. This would be balanced on the equipment manufacturer’s side by a long-term partnership agreement that ensures providing products at a lower cost does not affect their market opportunity.
The industrial parks can be located in already existing clusters of solar manufacturing, in states like Gujarat or Tamil Nadu. They should also house shared utility facilities accessible to solar cell manufacturers. Such utilities would include chillers, compressors, diesel generators, gas cabinets, chemical delivery systems, a centralised ultra-pure water plant, compressed dry air systems, effluent treatment plants capable of handling aggregate chemical loads, a highcapacity substation to provide electricity to multiple facilities, and process cooling water systems. Utilities can contribute 30 to 40 per cent of the total capital expenditure of setting up solar cell manufacturing facilities (Vikram Solar 2024; Premier Energies 2024). Shifting to an operational model where manufacturers pay only connection charges and usage fees, rather than capital expenditure, would help them scale-up faster, access economies of scale, and produce solar cells competitively.
Similar support for shared facilities for other industrial sectors already exists in India, including for electronic component manufacturing (MeitY 2020), textiles (Ministry of Textiles 2025), MSMEs (Ministry of Micro Small and Medium Enterprises 2022), and food processing parks (Ministry of Food Processing Industries 2020). State industrial development corporations under state governments can co-finance and build shared utilities and provide regulatory fast-tracks for establishing industrial parks, while MNRE can act as a central nodal body to oversee the strategic framing of the scheme. Special Purpose Vehicles and private developers would execute and operate such facilities, and recover the shared utility costs via connection fees and usage tariffs under PPP models.
A total of 48.30 GW of solar cell manufacturing has been enlisted under PLI tranches I and II, out of which 17.62 GW of solar cell manufacturing has already been established (Biswas and Kale 2025). While the production-linked incentive (PLI) scheme does give financial support for domestic solar manufacturing (MNRE 2022), it is a post-production and post-sales incentive based on the performance of solar modules, and hence does not help manufacturers bridge the upfront capital expenditure gap. To ensure the establishment of the remaining 30.68 GW of solar cell manufacturing capacity, one-time capital subsidy should be provided to PLI-enlisted manufacturers. This would add on to the nearly ~ 30 GW of present solar cell manufacturing capacity — hence execution of PLI-supported projects can double the solar cell manufacturing capacity to nearly 60 GW.
There has been a precedent set for capital subsidies in other domestic industries. The Modified Special Incentive Package Scheme (M-SIPS) offered capital subsidies of up to 25 per cent to promote domestic electronics manufacturing, including solar PV components (MeitY 2019). This significantly reduced the upfront capital investment and encouraged manufacturers to expand their value chain. Further, the Electronic Component Manufacturing Scheme (ECMS), introduced by the Ministry of Electronics and Information Technology (MeitY 2026), combined production incentives and capex subsidies.
The PLI-supported manufacturers should be given a capital goods subsidy of 15 per cent. The disbursement of the PLI is dependent on the number of sales, local value addition, and the technology of the modules sold (on grounds of efficiency and temperature coefficient), by a particular manufacturer. For an average manufacturing facility of 2 GW, assuming a utilisation rate7 of 30 per cent, the total amount disbursed through PLI (for the sale of modules of efficiencies more than 21.5 per cent) is at nearly USD 51.1 million, calculated in Annexure 7. This is with the assumption that all the modules that are produced at the assumed utilisation rate are sold. The capex for the same manufacturing facility will be USD 140 million, as the capex per GW is USD 70 million, as shown in Table 1. Hence, out of the 140 million, a PLI support manufacturer has to spend only USD 88.9 million in setting up a 2 GW project, entailing a capital expenditure of USD 44.45 million per GW. This is still not enough to lower capital expenditure to Chinese levels, which is around USD 33.5 million per GW, with a differential of nearly USD 11 million per GW. This differential is nearly 15 per cent of the per GW capex, hence such a subsidy would assist in bridging the gap. The subsidy can be provided to the manufacturer over five years, as that is the depreciation time for the production equipment for solar cell manufacturing (APVI 2024).
Targeted support towards only PLI-enlisted manufacturers is recommended as they have already committed towards establishment of manufacturing capacity. For non-PLI enlisted manufacturers, the previous recommendation of capex reduction through shared utility and equipment infrastructure is applicable.
Several manufacturers of equipment and machinery across the world are in financial distress, with largely negative EBITDA (Earnings Before Interest, Taxes, Depreciation, and Amortisation) and reduced cash balances. Indian firms such as Waaree and Reliance have taken advantage of such situations to acquire manufacturers like Meyer Burger (MERCOM India 2025b) and REC silicon (Ornate Solar 2021), respectively, which has enabled technology transfer.
These firms, despite financial instability, possess advanced cell and module technology knowhow, state-of-the-art manufacturing machinery, and well-established production facilities that can be acquired at a fraction of their original cost during insolvency or restructuring proceedings. By acquiring such assets, Indian companies can rapidly upgrade their technological capabilities without the heavy capital expenditure normally required for new R&D or high-cost equipment leasing. Such actions can help support the creation of pilot-scale lines, similar to how Reliance is operating the sole HJT solar cell manufacturing facility, after its acquisition (MERCOM India 2025c). MoCI can negotiate easing of regulations for the acquisition of distressed foreign manufacturing assets and intellectual property through trade and investment negotiations. This will push private players to acquire distressed companies. Such acquisitions can accelerate technology upgrading, reduce capital costs, and enable faster entry into advanced cell technologies without duplicating global R&D investments.
This approach not only reduces the per-unit cost of solar cell manufacturing but also accelerates domestic production of high-efficiency modules under initiatives like Make in India and the PLI scheme. Moreover, leveraging the existing R&D knowledge and patents of these distressed firms can help Indian manufacturers achieve global quality benchmarks while driving cost competitiveness across the value chain. In the long run, such strategic acquisitions could position India as a hub for integrated, low-cost, high-efficiency solar manufacturing, reducing dependence on imports and strengthening its role in the global renewable energy market.
Trade and investment negotiations can include provisions to facilitate technology transfer, investment cooperation and investor protections that make cross-border acquisitions (including of distressed firms) easier. Most countries regulate mergers and acquisitions through insolvency and bankruptcy laws, foreign investment or merger control regulations, and competition laws. In most cases, there should be no restriction in acquiring foreign assets through court-supervised sale process subject to disclosure and approval by insolvency administrators. While such is the case, incorporating clauses in trade and investment agreements can simplify the process.
National curriculum and courses targeting skill development across the various levels of expertise should be developed in coordination with industry stakeholders, educational institutions, and the government. Such skill development training centres can be located in states which are already solar manufacturing hubs, such as Gujarat and Tamil Nadu. Industry stakeholders such as foreign equipment manufacturers can be specifically targeted to impart training and contribute to course developments related to tooling, process optimisation and process engineering.
Programmes with varying durations should be developed, targeting different participant profiles. These can include short-term certificate courses for upskilling existing employees and Bachelor’s or Master’s programmes for imparting advanced knowledge of process optimisation and process engineering, thus training future process engineers. The MNRE, in collaboration with the All-India Council for Technical Education (AICTE), can take charge of the development of the curriculum and courses. The Ministry of Education (MoE) and the Ministry of Skill Development and Entrepreneurship (MSDE) can then serve as the stakeholders responsible for implementing the courses in selected academic institutions across the country.
Further upskilling can be implemented by cross-border, systemic skill training. Similar activities have been carried out in the automobile manufacturing industry through a memorandum of cooperation (MoC) on Manufacturing Skill Transfer Promotion Programme, signed in 2016 between the MSDE and Japan’s Ministry of Economy, Trade and Industry (METI), carried out by Maruti Suzuki (Maruti Suzuki 2021). MNRE can similarly leverage existing bilateral agreements with countries such as Germany, which have expertise in solar manufacturing due to the presence of R&D organisations such as Fraunhofer ISE and ISC Konstanz, and equipment suppliers like Rena.
In conclusion, India’s solar cell manufacturing sector faces a global landscape shaped by falling prices, rapid technological shifts, and evolving trade dynamics. Our analysis underscores that while India has made significant progress through policy instruments such as the PLI, ALMM mandates, and tariff protections, structural challenges persist in technology indigenisation, costcompetitiveness, and ecosystem readiness. Addressing these gaps requires a coordinated, multidimensional strategy that integrates industrial policy, trade diplomacy, research and development, and skill creation.
Our proposed recommendations align with this strategy and interlink with each other. Together, these recommendations form an integrated industrial strategy anchored in a national framework that links research, manufacturing, capital goods, skills, and trade policy into a single execution framework. Shared national hubs create the backbone for machinery localisation, pilot manufacturing of advanced cell technologies, and metallisation R&D, while firm-led spokes translate these innovations into gigawatt-scale production. Building shared utility facilities at such hubs would also enable reduction of capital expenditure incurred by domestic manufacturers, helping them become cost-competitive. A targeted capital subsidy would ensure that PLI-enlisted manufacturers can complete planned capacity additions. Parallel investments in specialised skill development ensure that process capability keeps pace with technological ambition. In combination, these measures transform the domestic solar cell manufacturing ecosystem from purely capacity expansion into a coordinated, technology-led industrial system capable of sustained global competitiveness.
Expanding domestic cell manufacturing would ensure supply chain resilience and higher domestic value addition – solar cells contribute nearly 60 per cent of the total module cost. By scaling up, reducing manufacturing costs, and accelerating technology adoption, India's solar cell manufacturing can support both domestic energy transition and build a globally competitive solar ecosystem.
Import duties on silver paste drive up consumable costs. Lack of economies of scale and limited access to subsidised infrastructure drive up capital expenditure. These two factors together lead to higher manufacturing costs.
Domestic manufacturers are dependent on imported equipment. This results in manufacturers remaining dependent on the know-how required to carry out installation and process optimisation. This results in slower commissioning of facilities for newer advanced cell technologies such as TOPCon. The lack of know-how also results in limited ability to upskill process engineers and technicians, who are critical for scaling up cell manufacturing capacities. In addition, weak public and private solar R&D leads to constraints in the timely adoption of next-generation technologies.
Establishing shared manufacturing infrastructure to reduce utility costs, localise equipment, and shared pilot-scale R&D facilities would be essential to become cost and technology-competitive. Further, targeted capital subsidies, developing dedicated skilling programmes, and strategic technology transfers would complement these measures.
Establishing a Sodium-ion Battery Ecosystem in India
Making India a Hub for Critical Minerals Processing
State of the Sector: Critical Energy Transition Minerals for India

Strengthening India's Clean Energy Supply Chains