Council on Energy, Environment and Water Integrated | International | Independent
Suggested citation: Harikumar, Aravind, Chris Teresa Varghese, Vandana Vidhani, Bhanu Sharma. 2025. How can India Accelerate Electric Three-wheeler Adoption? Behavioural Insights from Amritsar. New Delhi: Council on Energy, Environment and Water.
Policy initiatives to electrify India's road transport sector largely focus on addressing technological and economic barriers to electric vehicle (EV) adoption. It is often assumed that these are sufficient to influence users to switch to EVs. In this report, we argue that this is not always the case. We studied the case of d3W drivers in Amritsar who – despite being offered subsidies, incentives, and economic opportunities – are reluctant to switch to e3Ws. We show that there are behavioural biases that impede the rational decision to switch to EVs.
We study contextual behavioural factors using the MINDSPACE framework and present the stated barriers, observed evidence, and underlying biases impeding the switch to an e3W in Amritsar. Using the BCW framework, we suggest five categories of actions for four types of stakeholders and showcase how various strategic interventions, such as direct user experience pilots, informational campaigns, and peer and community engagement, can potentially nudge e3W adoption rates. The efforts helped Amritsar reach its critical threshold of e3Ws adoption, and progress is likely to continue in future without substantial subsidies. The framework, methods, and solutions are transferable to other vehicle segments and their electrification in other Global South cities. Amritsar's trial impacts can serve as a benchmark for planning scalable interventions to accelerate e3W adoption in other Indian cities.
Electrifying India’s road transport sector is crucial to achieving net-zero emissions by 2070 (PIB 2023). CEEW’s analysis shows that increasing EV penetration to 30 per cent by 2030 can reduce 16 million tonnes of greenhouse gas emissions and 17 per cent of particulate matter emissions in India (Soman et al. 2020). It is often assumed that policy initiatives that address technological and economic barriers to electric vehicle (EV) adoption are sufficient to influence users to switch to EVs. In this report, we argue that this is not always the case. We show that there are behavioural biases that impede the rational decision to switch to EVs. Behavioural biases are systemic inclinations in human decision making that operate outside of the tenets of logic, plausibility, and reasoning based on probability (Hans et al. 2022).
In this report, we study the EV transition in the passenger three-wheeler (3W) segment in India, with a focus on Amritsar’s passenger 3W fleet. In 2019 Amritsar introduced a passenger electric three-wheelers (e3Ws) scheme–the Rejuvenation of Auto-Rickshaws in Amritsar through Holistic Intervention (RAAHI). This offered existing 3W drivers a subsidy of INR 1.4 lakh to replace diesel three-wheelers (D3Ws) with e3Ws, eliminating the challenges associated with high upfront costs for drivers making the switch. It aimed to drive the adoption of 7,500 e3W by scrapping existing d3Ws rather than promoting the sale of new e3Ws. Furthermore, the total cost of ownership (TCO) of electric 3Ws (e3Ws) is up to 46 per cent lower than that of diesel 3Ws (d3Ws) and can increase the daily savings of drivers by 30 per cent (Harikumar et al. 2022). Despite the attractive economics of e3Ws, only 30 d3W drivers switched to e3Ws, five year since the initiation of Amritsar’s e3W subsidy scheme in 2019.
We collected qualitative evidence through interviews and focus group discussions (FGDs) with d3W and e3W drivers to understand the barriers and motivations driving the adoption of e3Ws. In April 2023, we also used evidence from a survey of 533 d3W drivers to show how some of the barriers stated by d3W drivers are exaggerated by underlying behavioural biases.
This report covers the first three phases of the Target, Explore, Solutions, Trial, and Scale (TESTS) framework for designing and evaluating behaviour change interventions (Kettle and Persian 2022). We present our findings using the MINDSPACE1 framework (Dolan et al. 2012) and recommend actions to nudge d3W drivers to adopt e3Ws.
Improve understanding of economic rationale through communication
Strategic behaviour change communication can enable d3W drivers to effectively understand the economic rationale for switching to e3Ws. Discrete mental accounting bias can be addressed by equating diesel savings with e-auto EMI. Strategic communications can be centered on how the savings from reducing diesel usage can be used to pay for e3W EMIs and explaining to them the economic loss they would incur by continuing to operate their d3Ws.
For example, CEEW worked directly with drivers to communicate the operational and economic benefits of e3Ws. It developed radio jingles for mass communication of economic benefits and to leverage pride amongst 3W drivers. We also developed three informational hoarding designs highlighting the daily savings experienced by 3W drivers who have transitioned to e3Ws.
Improve drivers’ understanding of e3W performance by promoting direct user experience.
Evidence indicates that when individuals experience driving an e3W, it improves their understanding of e3W performance, including range of the vehicle. Such hands-on exposure to e3Ws can help address the priming effect of e-rickshaws as well as the anchoring effect of d3Ws. Further, direct user experience can help drivers better judge if e3Ws can meet their daily trip requirements.
For example, CEEW introduced a 'direct user experience pilot' between February to June 2024. Ten hired e3Ws were commissioned to allow 300 d3W drivers to test and operate e3Ws first-hand for three days each. This helped them understand savings and earnings potential and address behavioural biases. As of March 2025, more than 1300 3W drivers have switched to e3Ws from d3Ws (based on ASCL data in August 2025).
Build and publicise public charging infrastructure.
Building limited yet strategically located charging points that are affordable, accessible, and visible can significantly boost e3W uptake by addressing the range anxiety of drivers with inadequate home charging infrastructure or high daily utilisation. Publicising the development and locations of charging infrastructure through public maps can reassure drivers that their charging requirements can be easily met.
Our d3W drivers’ survey in Amritsar highlighted that merely 20 per cent of drivers make trips longer than the battery range of popular e3W models. To meet their needs and manage range anxiety, we identified four key locations for e3W charging stations. These locations are critical as they also offer public charging access to drivers (16 per cent) who live in rented accommodations and face difficulties in accessing EV charging at home.
Harness informal networks to enhance the pride associated with owning an e3W.
Informal networks can be harnessed through pradhans and existing e3W drivers can champion the e3W experience and educate drivers about associated benefits. Communications focused on enhancing the pride associated with owning an e3W can address the ego bias stemming from the smaller size of e3Ws.
CEEW, in collaboration with ASCL, initiated the e3W Mela to showcase new e3W models and dealers, and facilitate licence renewals. Special counters for peerto-peer interaction gave d3W drivers the opportunity to engage with existing e3W owners (Table ES 2). Additionally, we engaged pradhans, local 3W stand leaders, to shape social norms and influence 3W drivers' purchase decisions. As a result, pradhans spearheaded the transition, and peer-to-peer perception shifts were effectively mobilised.
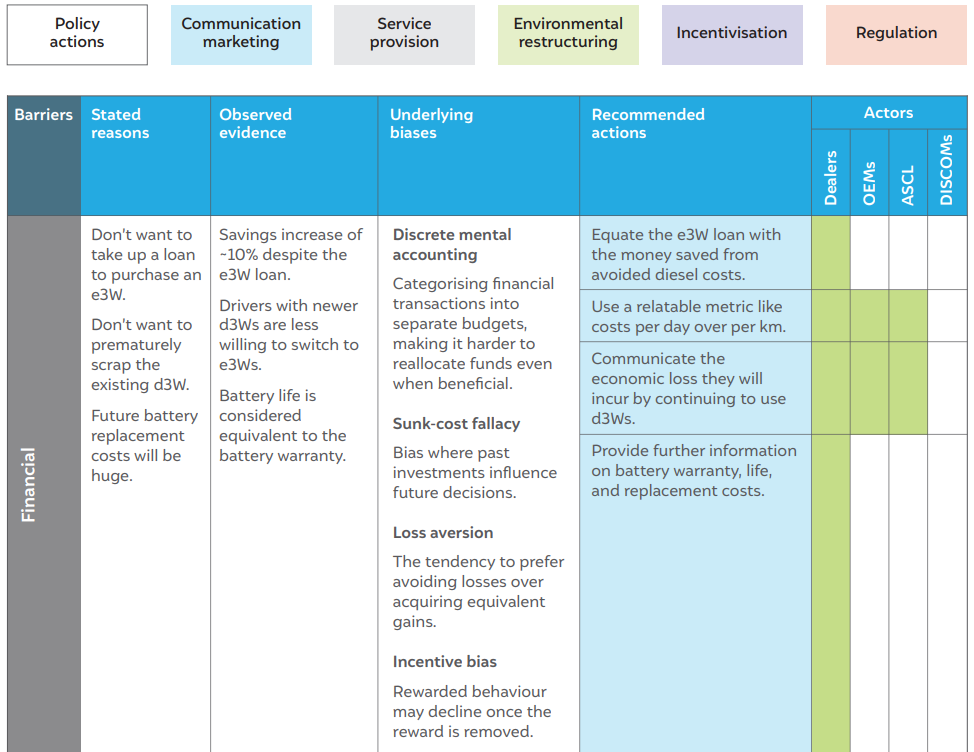
Table ES1 Behaviour change strategies for e3W adoption in Amritsar using the Behaviour Change Wheel framework2
Source: Authors’ analysis
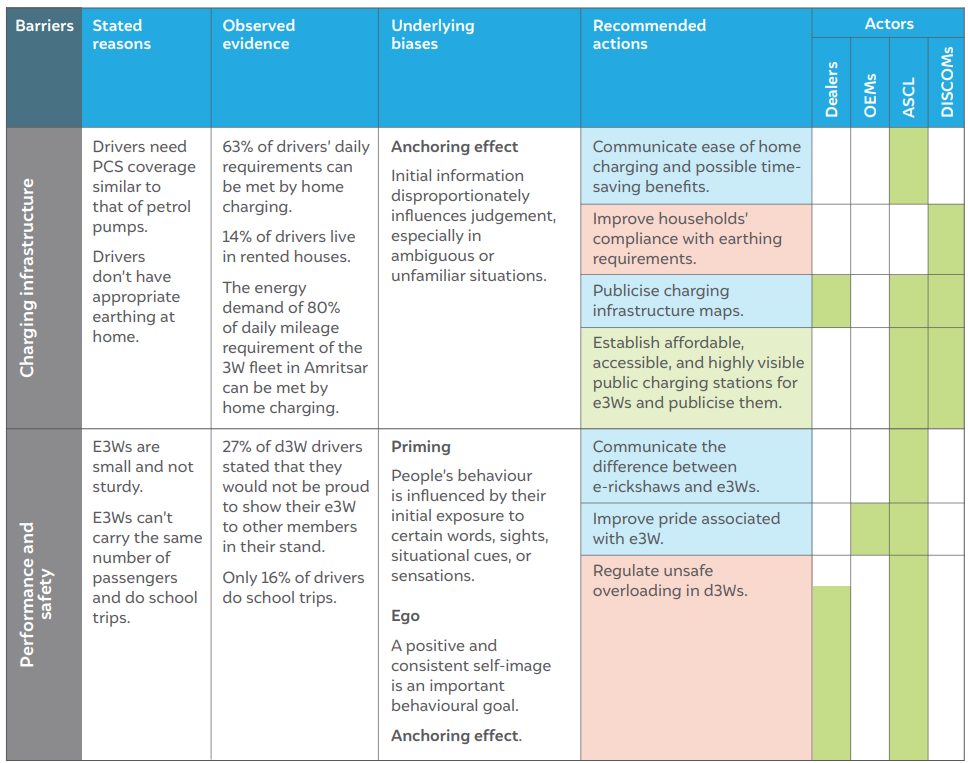
Table ES2 Behavioural biases that can be leveraged to accelerate the e3W transition
| Barriers | Other behavioural biases | Recommended actions | Actors | ||
|---|---|---|---|---|---|
| Dealers | OEMs | DISCOMs | |||
| Messenger bias |
Nearly half of the d3W drivers surveyed stated that they would be highly likely to transition to e3Ws if their pradhan (local community leader) had an e3W. Diesel drivers frequently approach e3W drivers with queries regarding e3Ws. Nearly half of the d3W drivers found out about e3Ws through their peers. |
Use e3W drivers and pradhans as agents of change. Communicate e3W benefits through them. | |||
| Give high referral incentives to existing e3W drivers. | |||||
| Social norms | 42% of d3W drivers feel that their peers are switching to e3Ws. | Communicate factual e3W adoption numbers. | |||
| Source: Authors' analysis | |||||
Most of the evidence on nudging EV adoption focuses on four-wheelers and comes from developed countries. To the best of our knowledge, there is no literature on the behavioural factors affecting the uptake of e3Ws in India. Scientific trials are needed to understand the effectiveness of interventions to nudge e3W adoption. Such assessments can aid in developing scalable and cost-effective strategies, and EV incentives may be diverted to domains where favourable techno-economics are yet to be achieved.
Public policies often seek to shape human behaviour (Sunstein 2019). Two prevalent strategies for promoting electric vehicle (EV) adoption are economic instruments—i.e., internalising the cost of negative externalities through Pigouvian taxes and creating monetary incentives—and command and control measures such as EV adoption mandates and phasing out or banning petrol and diesel vehicles. A third category of interventions, known as libertypreserving nudge policies, have gained momentum due to their ability to guide choices while respecting individuals' freedom. Their popularity stems from their cost-effectiveness and potential economic and welfare benefits. The United States Environment Protection Agency’s (US EPA) fuel economy labels (Long et al. 2021), the Leadership in Energy and Environmental Design’s certification (Scofield 2013), and India’s Bureau of Energy Efficiency’s (BEE) star labelling scheme (Rathi and Chunekar 2015) are pertinent cases.
Governments worldwide—including USA, UK, Australia, and India—have established behavioural insights teams to explore nudge-based, cost-effective policy interventions (Hallsworth 2023; Malhotra and Shah 2023). Nudge policies have proven effective in domains ranging from finance (Cai 2020) and health (Kwan et al. 2020) to mobility (Whillans et al. 2021). Globally, nudge interventions have aimed to steer consumers towards EV purchases (Filippini, Kumar, and Srinivasan 2021; DellaValle and Zubaryeva 2019).
Our research investigates the relevance of nudge policies in expediting EV adoption in India. Specifically, we reveal the underlying behavioural biases that potentially hinder the effectiveness of conventional policies, with a focus on the passenger three-wheeler (3W) segment in Amritsar.
In policymaking, classical economic models assume that individuals are rational beings who always act in their best interest. However, humans are not purely rational; they exhibit systemic, flawed responses in decision-making (Wilke and Mata 2012). Kahneman and Tversky coined the term ‘cognitive biases’ to describe these deviations from rationality (Shefrin and Statman 2003). Extensive empirical evidence from economic experiments in the 1980s and 1990s shows that consumers do not always act rationally, as assumed in classical models (Huck and Zhou 2011). Cognitive biases are also known as behavioural biases (GarciaSierra, van den Bergh, and Miralles-Guasch 2015). They are “systematic inclinations in human decision-making that often don’t comply with tenets of logic, plausibility or reasoning based on probability and represent systematic deviations from logical and probabilistic reasoning” (Hans Korteling and Toet 2022). We use the term ‘behavioural biases’ to refer to these systematic deviations from rational behaviour in the context of electric 3-wheeler (e3W) adoption by diesel 3-wheeler (d3W) drivers.
In the realm of EV adoption, it is imperative to scrutinise the behavioural biases that exaggerate the impact of obstacles, such as high upfront costs and inadequate charging infrastructure. To shed light on this critical issue, New Zealand’s Ministry of Environment used the ‘barriers–biases–interventions’ framework to uncover behavioural insights that could help accelerate EV adoption (Girvan and Hearnshaw 2018). Another report by the Sustainable Energy Authority of Ireland drew upon prior research to delve into the foundational factors contributing to behavioural biases and barriers in EV adoption (SEAI 2020). These included issues such as financial barriers, concerns related to range anxiety, challenges associated with accessing charging infrastructure, and dealership conditions. We have utilised such existing literature to identify the key aspects driving EV adoption, examine the obstacles that hinder EV uptake, uncover the hidden biases that contribute to these barriers, and put forward viable solutions to overcome them.
In the realm of behaviour science, numerous behaviour change models have been developed to evaluate biases and design interventions. The MINDSPACE framework—developed by the UK government’s nudge unit, Behavioural Insights Team (BIT) in 2010—summarises nine key factors influencing behaviour: messenger, incentives, norms, defaults, salience, priming, affect, commitment, and ego (Dolan et al. 2012). It has been applied across various domains (Andrawis et al. 2022; Smith et al. 2022; Hennessey et al. 2020), including energy demand reduction (Cullen, Allwood, and Borgstein 2011) and transport (Metcalfe and Dolan 2012; Maier 2012).
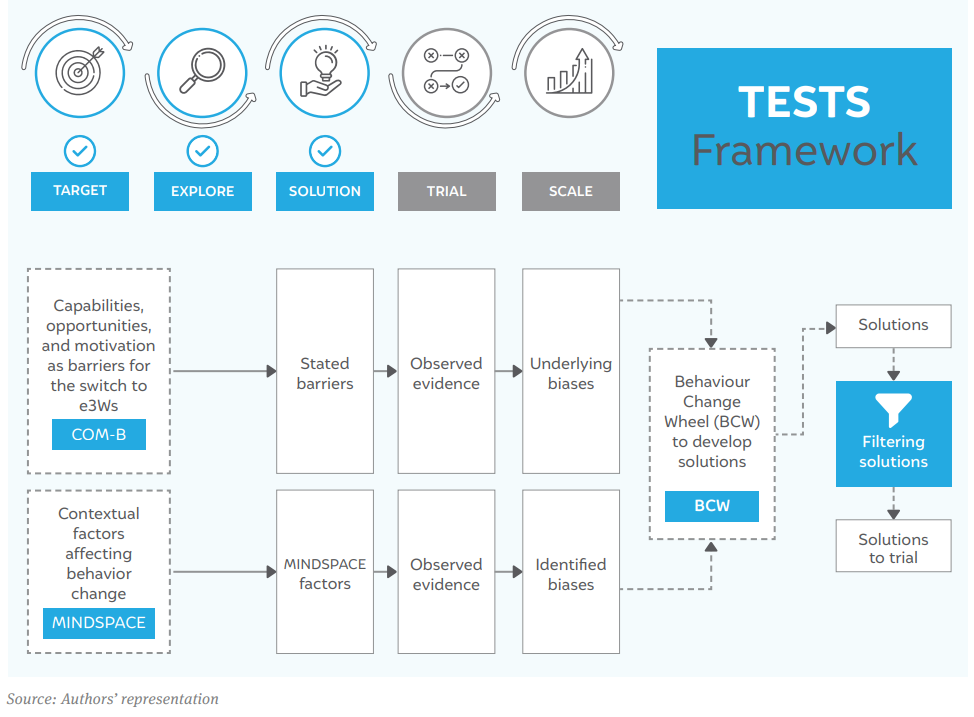
Alternatively, the EAST framework offers policymakers a straightforward approach to enhance policy effectiveness using behavioural science, emphasising that policies should be easy, attractive, social, and timely (BIT 2012). Additionally, the UK BIT has proposed the Behaviour Change Wheel (BCW) and the Capabilities, Opportunities and MotivationBehaviour (COM-B) frameworks as more comprehensive tools for designing behaviour change interventions (Michie, van Stralen, and West 2011). COM-B moves beyond nudges and delves deeper into the underlying factors that affect behaviour, including capability, opportunity, and motivation. The COM-B framework is a part of BIT’s Target, Explore, Solution, Trial, and Scale (TESTS) approach to tackling behaviour change problems (Kettle and Persian 2022).
Thus, this study uses both COM-B and MINDSPACE to identify biases and the BCW to develop solutions for the first three phases of the TESTS framework (see Figure 1). However, for the ease of understanding of EV stakeholders, we have classified the discussion on barriers and biases into four categories: financial barriers, range anxiety, charging infrastructure, and e3W performance and safety.
Figure 1 Using COM-B, MINDSPACE, and BCW within the TESTS framework in this study
This section summarises the relevant behavioural biases from the literature, which are later discussed in this report in the context of e3W adoption.
Table 1 The literature on behavioural biases discussed in this report
Source: Authors’ compilation
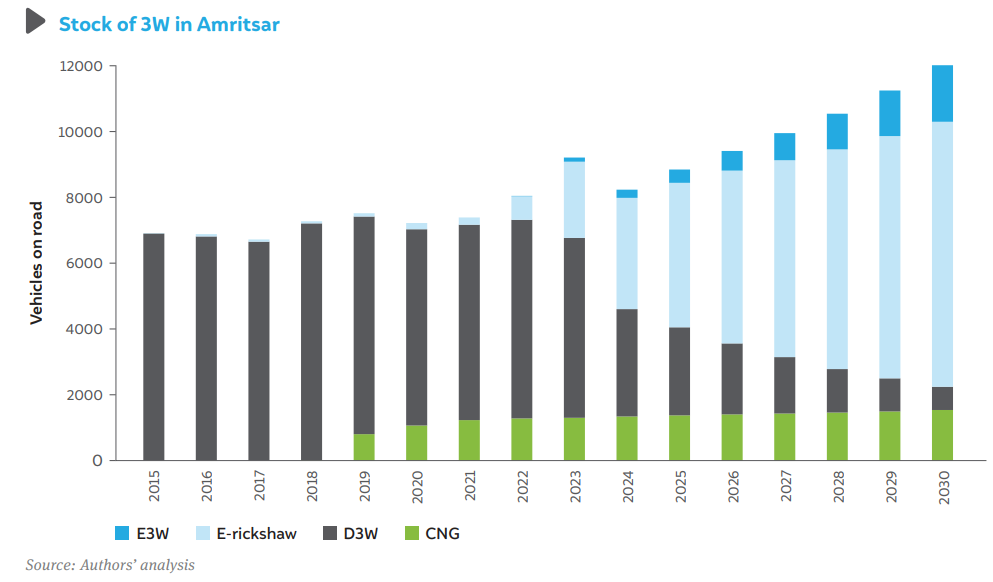
India's EV transition is prominent in the two (2W) and three-wheeler (3W) segments, with nearly seven times the number of EVs registered in 2022–23 compared to FY 2019–20 (Harikumar and Jain 2023; Ministry of Road Transport and Highways 2024). Out of the 14 lakh EVs registered in FY 2022–23, 43 per cent belonged to the 3W transport category (Ministry of Road Transport and Highways 2024). Notably, 68 per cent of the EVs registered in the 3W transport category are e-rickshaws (passenger), which form a distinct class from passenger 3Ws. E-rickshaws or an electric rickshaw is a three-wheeled battery operated vehicle that is open from the sides, has with a four seater capacity at the back, reverse gears, a hand brake or a foot brake, and a full front safety glass (Lahiri and Nath 2021). While e3W registrations grew 40-fold from 2015 to 2022, e-rickshaw registrations saw an astounding 600-fold increase. It is worth noting that most e-rickshaw drivers purchased them due to their high affordability compared to 3Ws and as a means to create job opportunities and support their livelihoods rather than to transition to a 3W alternative (Lahiri and Nath 2021). Consequently, e-rickshaws have primarily expanded India’s 3W fleet rather than facilitating a transition. Our discussion focuses on transitioning the existing internal combustion engine-based 3W fleet in India, excluding e-rickshaw adoption.
Electric three-wheelers (e3Ws) offer significant cost advantages, being up to 46 per cent cheaper than diesel three-wheelers (d3Ws) and providing drivers with a 30 per cent increase in daily savings (Harikumar et al. 2022). Moreover, state and central government incentives further bolster the economic case for switching to e3Ws. Launched in 2019, the Faster Adoption and Manufacture of Electric Vehicles (FAME-II) scheme offers e3W buyers incentives of INR 10,000 per kilowatt-hour (kWh) of battery size (Harikumar and Thakur 2019). Despite the apparent economic benefits, the transition to e3Ws has been slow. Thus, the 3W segment serves as the ideal context to uncover the underlying behavioural biases impeding the transition.
We investigate the 3W transition in Amritsar, India, where the Rejuvenation of Autorickshaws in Amritsar through Holistic Intervention (RAAHI) project by Amritsar Smart City Limited (ASCL) incentivises d3W drivers to transition to EVs. The RAAHI project is managed by the National Institute of Urban Affairs (NIUA) and is financed by the French Development Agency (AFD), the European Union, and ASCL. RAAHI’s e3W scheme offers a subsidy of INR 1.25 lakh and a scrapping incentive of up to INR 15,000, enabling d3W drivers to transition to e3Ws with zero down payment and low-interest financing. Despite these incentives and the favourable economics of e3Ws, only 30 out of the targeted 7,500 d3W drivers have transitioned to e3Ws from the scheme’s inception in 2019 until the initiation of this study.
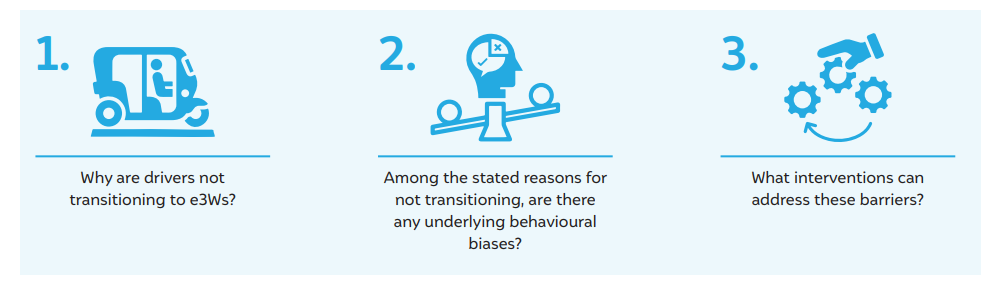
In this report, we study the case of Amritsar to answer the following research questions:
Section 2 discusses the data, methods, and framework for presenting the results. Section 3 discusses the results. Section 4 explores the extent to which the findings can be generalised. Section 5 recommends policy actions for stakeholders, and Section 6 concludes the report.
Our study employs an exploratory sequential mixed method design (Mihas 2019), combining focus group discussions (FGDs), semi-structured interviews, and an extensive quantitative survey of 533 d3W drivers. Drivers included in the study include those who own their vehicles and those who rent them. Although the study focuses on passenger 3W transition in Amritsar, this also includes drivers who ferry both passengers and goods in their vehicles.
Initially, FGDs and interviews helped us establish the situational context, providing us with valuable high-level insights into the status of e3Ws and the barriers and preferences related to their adoption. This qualitative data informed our comprehensive quantitative survey and guided the formulation of survey questions aimed at precisely assessing 3W operational patterns and preferences, perceptions of e3Ws, and behavioural factors impeding adoption.
To gain a preliminary understanding of the attitudes and perceptions of 3W drivers (both d3W and e3W) in Amritsar towards e3Ws, we undertook situational analysis through FGDs and interviews. Our analysis was guided by the community-based participatory research (CBPR) approach, wherein stakeholders are involved throughout the research process and have the opportunity to influence policy action. We approached d3W and e3W drivers at key locations in Amritsar the railway station, bus stand, and the Attari–Wagah border to identify participants for our FGDs and interviews. We conducted:
We gathered insights from multiple respondents about their daily work patterns, needs, the RAAHI scheme, and their perception of e3Ws. D3W drivers highlighted challenges in transitioning, while e3W drivers discussed the economic and health benefits of making the switch. We conducted semi-structured interviews to gather personal insights that were not shared in the FGDs. The semi-structured interviews lasted 30 minutes each, while the FGDs were for an hour, including introductions and clarifications. The FGD participants received INR 150 as compensation for their time. Following the FGDs and interviews, we coded the data using constant comparison analysis (Onwuegbuzie et al. 2009). We used open coding to identify codes in transcripts, which were then grouped into categories. Using the MINDSPACE framework,3 we organised the categories into themes, revealing the biases that prevented d3W drivers from transitioning to e3Ws in Amritsar. These themes guided our quantitative survey design.
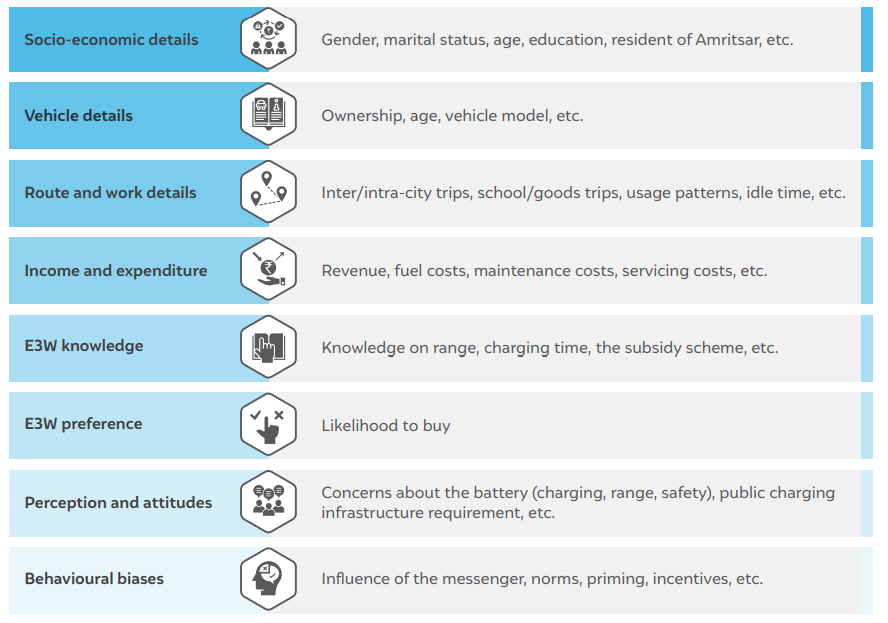
We conducted a quantitative survey to gain additional insights into the themes identified during the FGDs. The survey assessed biases using the MINDSPACE framework (Dolan et al. 2012) and was administered over a week by a third party (NYAS Research, n.d.). We collected data using a structured questionnaire via a mobile-based application (SurveyCTO, n.d.). The questionnaire encompassed the following thematic sections:
We estimated the target d3W population to be 6,650 vehicles. A total of 533 d3W drivers across key 3W auto rickshaw stands in Amritsar were surveyed. There is no existing list of 3W drivers in Amritsar, and information on their geographic distribution in the city is limited. Given this, we used purposive and convenience sampling techniques (Campbell et al. 2020). The survey’s questionnaire was administered in both Hindi and Punjabi. Each respondent was given INR 50 as compensation for their time, and each response lasted around 20 minutes.
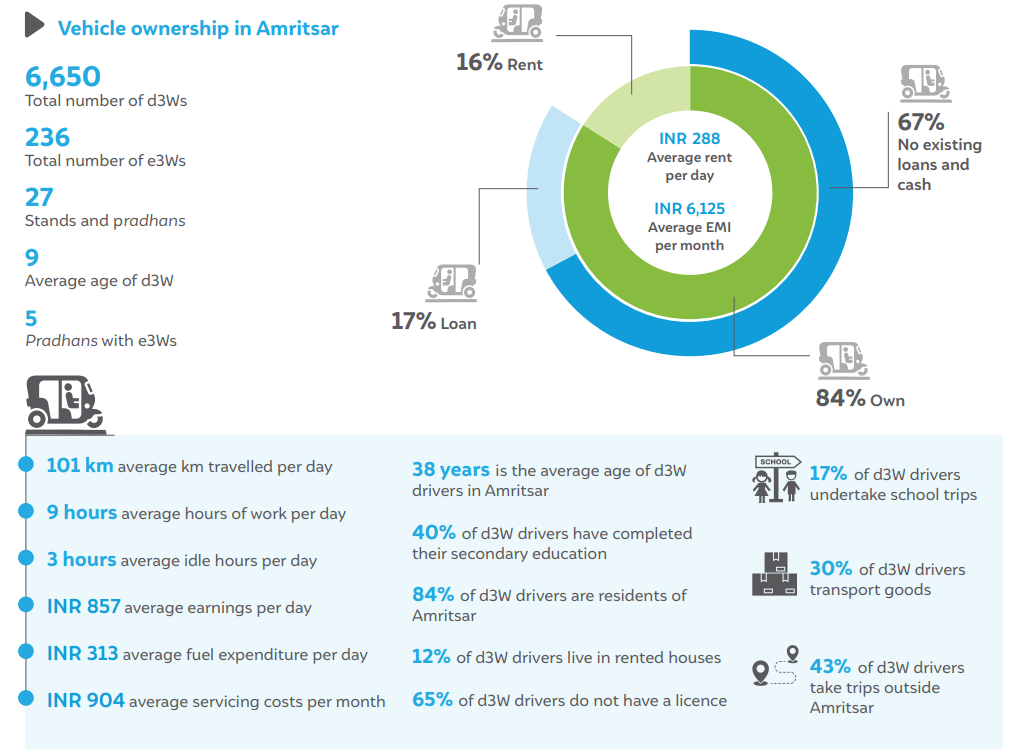
All the respondents were male, aged between 18 to 70 years (mean age of 38 years). More than half of the respondents were educated to the secondary level, one-fifth had completed primary education, and another one-fifth had no formal education. About 84 per cent of the respondents are residents of Amritsar. A descriptive summary of the 3W sector in Amritsar is given in Figure 2.
Figure 2 Snapshot of 3W segment in Amritsar in 2023
We employed a three-point ordinal scale for questions related to preferences, concerns, likelihood, etc. These points were ‘not likely’, ‘somewhat likely’, and ‘highly likely’. The scale used does not have a neutral point, but ‘don’t know’ was given as an option. This scale was not self-administered by the respondents. Additionally, we translated the survey into Punjabi during data collection. We performed the Cronbach’s alpha test to evaluate the construct validity and reliability of the scale. The value of the Kaiser–Meyer–Olkin statistic obtained was 0.770, which is greater than the acceptable threshold of 0.7.
A higher scale is usually preferred as it increases reliability and validity and reduces the likelihood of obtaining extreme responses (Weijters, Cabooter, and Schillewaert 2010). However, the optimal scale for any study depends on its nature and is selected so that it covers all necessary responses. Jacoby and Matell (1971) show that dichotomous or trichotomous versions of a scale, as opposed to a five-point Likert scale, do not affect validity and reliability. Since the survey was conducted by a third party, the absence of a neutral point was necessary to ensure the validity of responses, as respondents are more likely to choose the neutral option to avoid a negative response during a face-to-face interview or survey (Stocké 2007).
We employed a combination of hypothesis testing, multivariate analysis, and ordinal regression techniques. We analysed the data using the following statistical techniques: correlation, chi-square (cross-tabulations), T-test, and analysis of variance (ANOVA). We conducted all the tests at a 95 per cent significance level. We checked for multicollinearity among the independent variables and found no significant correlation.
This report presents results based on the first three phases of the BIT’s TESTS approach, i.e., target, explore, and solution (Figure 1). We use the COM-B framework to list the barriers stated by d3W drivers to e3W adoption. For easier comprehension of EV industry stakeholders, we classify these barriers into four categories–financial barriers, range anxiety, charging infrastructure, and e3W performance and safety. Within each of these broad barriers, we list the reasons stated by the d3W drivers, show evidence of how some of these are not factually true, and discuss the behavioural biases underpinning these stated barriers.
Additionally, we present evidence of how e3W adoption in Amritsar is influenced by behavioural biases. To arrive at solutions to nudge e3W adoption, we apply the BCW framework on both sets of biases, as identified using COM-B and MINDSPACE.
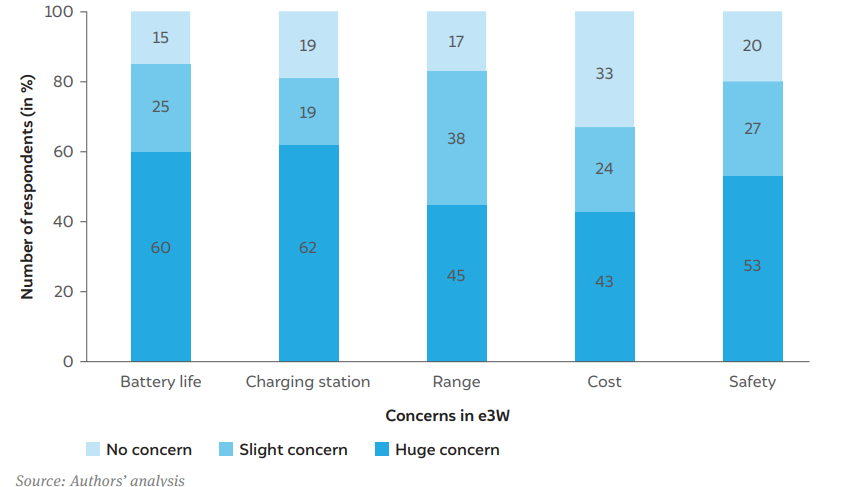
‘Battery life’ is included as a financial barrier, as d3W drivers were concerned with future costs. In the survey, more than half of the drivers selected ‘charging station’ and ‘safety of e3Ws’ as huge concerns (Figure 3). A large portion of drivers were also concerned about ‘range’ and the cost of e3Ws.
Figure 3 Drivers consider battery life, charging infrastructure, and safety as huge concerns with e3Ws
The first set of barriers highlighted by the d3W drivers pertains to the cost of switching to, owning, and operating an e3W. Due to the RAAHI scheme, high upfront costs (Kumar and Chakrabarty 2020) and the lack of financing options are not significant barriers to e3W adoption. However, during the qualitative interviews and FGDs, d3W drivers stated some other financial barriers to switching.
I. E3W loan
Stated barrier: Drivers prefer not to incur additional loans
During the FGDs, d3W drivers expressed concerns about taking on the additional financial responsibility of a loan when switching to an e3W. Specifically, they mentioned that the monthly installments (EMI) they would have to pay for the e3W could negatively impact their profitability. For drivers who already have loans on their d3Ws, the prospect of paying two EMIs–one for their existing d3W and another for a new e3W–was a source of worry. This concern was particularly significant for those with informal loans with high interest rates. D3W drivers who operate rented vehicles are ineligible for RAAHI scheme subsidies, as they cannot scrap the d3W they drive. Consequently, they face both financial constraints and high upfront costs.
Observed evidence: Immediate savings impact
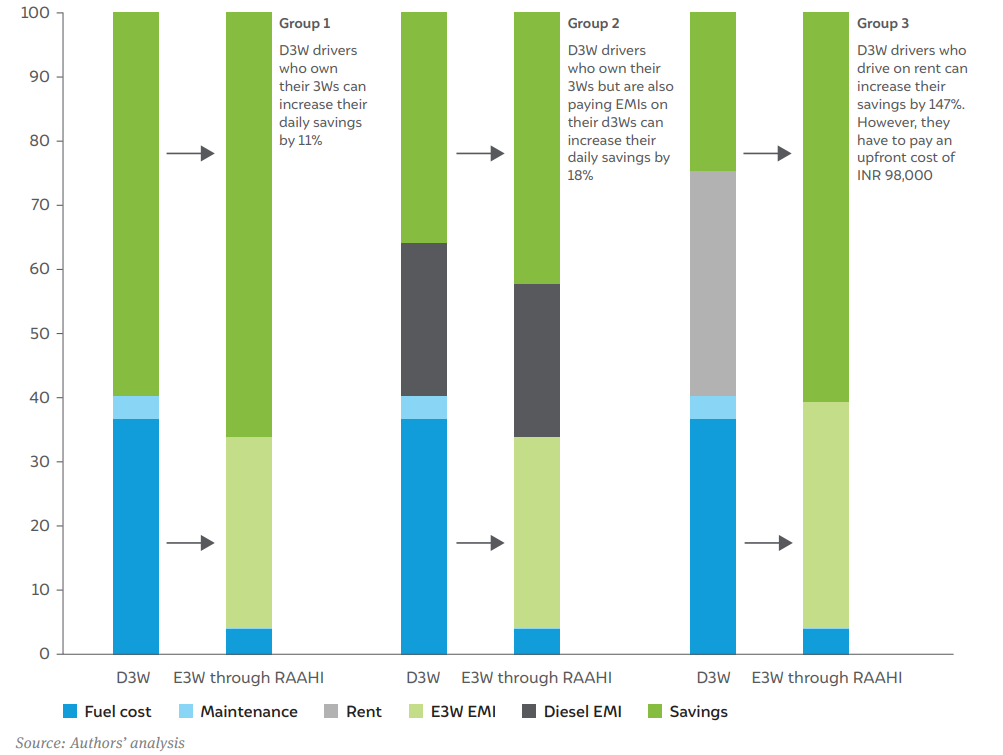
There are three groups of d3W drivers: those who own a d3W without a loan (67 per cent), those with existing loans (17 per cent), and those renting a d3W (16 per cent). The first two groups can participate in ASCL’s RAAHI scheme, which allows drivers to purchase an e3W with zero down payment and 9–12 per cent interest rates. The third group–ineligible for RAAHI incentives–can buy e3Ws directly at a 13 per cent interest rate and with a down payment of INR 98,000.
Here is our analysis of the daily savings change for all three groups, factoring in the additional EMI cost for the e3W (see Figure 4). The e3W EMI is the average of 2 e3W models empanelled under the RAAHI scheme.
Figure 4 Reduction in diesel fuel expenses is more than enough to cover the e3W loan
Underlying bias: D3W drivers in Amritsar are observed to categorise their expenses and earnings into discrete bundles
The FGDs show that there are different mental accounts like ‘revenue’, ‘loan’, ‘diesel costs’, etc. The switch to e3Ws reduces the ‘diesel costs’ account but adds to the ‘loan’ or ‘EMI’ accounts. As these two mental accounts are non-fungible, the d3W drivers are unable to compare them to understand that their daily savings will improve even after accounting for an e3W loan.
II. Premature scrapping of d3W
Stated barrier: D3W drivers do not want to prematurely scrap their d3W
D3W drivers argue that the INR 15,000 scrapping incentive falls far short of the actual value of their diesel vehicles. Many believe that it is financially unwise to prematurely scrap vehicles with plenty of life left and anticipate getting better returns in the secondhand 3W market instead.
Observed evidence: Transitioning to e3Ws offers consistent and continuous economic improvement over using d3Ws
Legally, 3Ws in Amritsar can operate for 15 years from the date of registration. Approximately 11 per cent of d3Ws exceed this limit, while around 63 per cent of d3Ws still have at least 6 years left. Despite d3W drivers expressing concerns about financial losses associated with early scrapping, our analysis contradicts this notion.
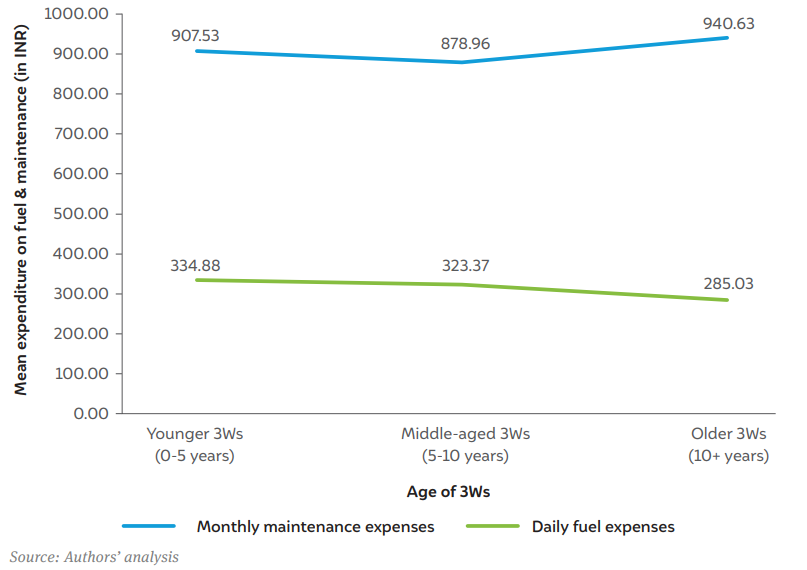
The analysis in Figure 4 considers an average daily fuel cost of INR 313 and monthly maintenance expenses of INR 903. Figure 5 demonstrates that the economic benefits of switching to e3Ws hold true regardless of the vehicle’s age. In other words, the fuel and maintenance costs incurred by d3Ws do not significantly differ with age. Consequently, drivers incur daily financial losses by holding onto their current d3Ws, dispelling the belief that early scrapping incurs an economic loss.
Figure 5 Fuel and maintenance costs for d3Ws do not significantly differ with age
Underlying bias: Sunk-cost fallacy
D3W drivers want to make the most out of their investment in their current vehicle. A common statement in our interactions with d3W drivers exemplified this bias: “Jab tak chal raha hain, chalne do” (For as long as it can run, let it run).
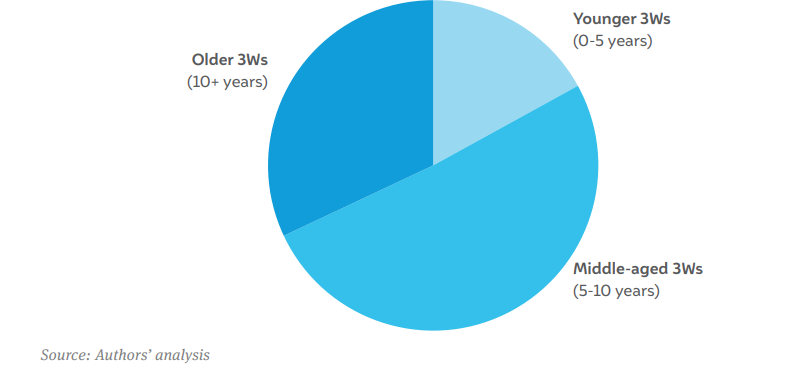
The average age of a d3W in Amritsar is about nine years. Based on vehicle age, we classified d3W drivers into three groups (Figure 6).
Figure 6 About a third of all d3W vehicles in Amritsar are older than 10 years
Only 11 per cent of the respondents with younger d3Ws said that they were likely to buy an e3W within a year, while 23 per cent with older d3Ws expressed a similar intention. To test whether the age of the vehicle influences the decision to switch to an e3W, we performed an ANOVA. The results indicated that there is a statistically significant difference between owners of older d3Ws and younger d3Ws regarding how likely drivers are to purchase an e3W and the age of the vehicle. We further conducted two robust equality of mean tests–the Welch test and the Brown–Forsythe test–to validate the findings of this ANOVA. Both tests confirmed the existence of a significant difference between the owners of older d3Ws and younger d3Ws in terms of their reported likelihood of buying an e3W. That is, vehicle age has a statistically significant influence on the likelihood of drivers buying an e3W.
Figure 7 D3W drivers with younger vehicles are less likely to buy an e3W within the next year
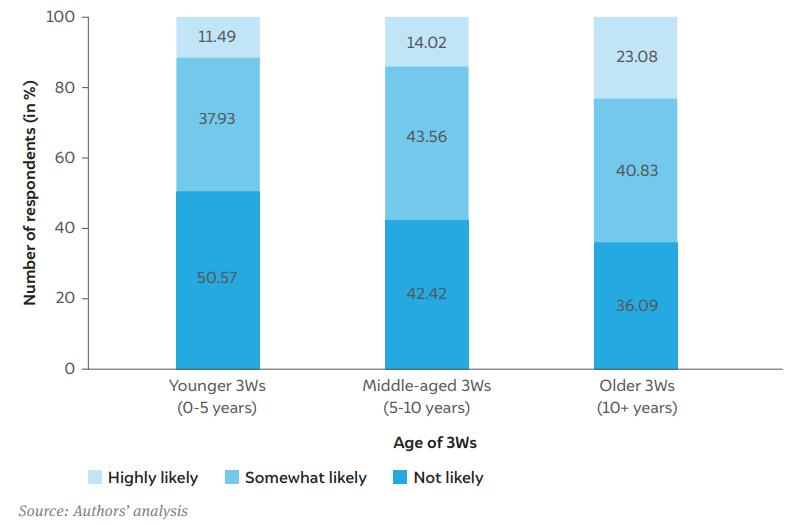
Drivers with younger d3Ws may have a higher sunk-cost fallacy due to the burden of existing d3W EMIs.
III. Battery replacement costs
Stated barrier: D3W drivers are concerned about future battery replacement costs
FGDs show that d3W drivers are concerned about the future costs of battery replacement after switching to e3Ws. Drivers additionally worry about e3W batteries being damaged by rain or improper charging practices.
Observed evidence: Uncertainty regarding battery life
About 60 per cent of the d3W drivers we surveyed stated that the battery life of e3Ws was a huge concern. E3W drivers assume that the battery life will be exactly three years because that is the warranty period offered by the empanelled e3W original equipment manufacturers (OEMs) (Piaggio 2023; Mahindra n.d.). Due to uncertainty regarding EV technology, d3W drivers tend to conflate battery warranty with the actual battery life, which connects with the broader issue of the lack of battery life standardisation and performance tests.
Underlying bias: Loss aversion
We measured loss aversion in risky choices through a coin toss experiment, where 3W drivers decided whether to accept or reject six hypothetical gambles (Q1 to Q6) with a 50–50 probability of gain and loss (Gächter, Johnson, and Herrmann 2010). The winning prize was fixed at INR 50, while the loss varied from INR 10 to INR 60 in Q1 to Q6, respectively. Using small financial stakes ensured that we measured loss aversion rather than risk aversion (Rabin 2013).
Around 8 per cent of d3W drivers accepted all the gambles or Q1 to Q5 but rejected Q6, while the remaining 92 per cent exhibited loss aversion. They rejected Q1-Q5, a potential win situation, exhibiting that they are afraid of losing money (loss aversion).The degree of loss aversion (Tversky and Kahneman 1991) among 3W drivers is measured at 2.6, indicating that they value losses nearly thrice as much as gains. This level of loss aversion is 25 per cent higher than that found among Indians by Wang et al. (2017).
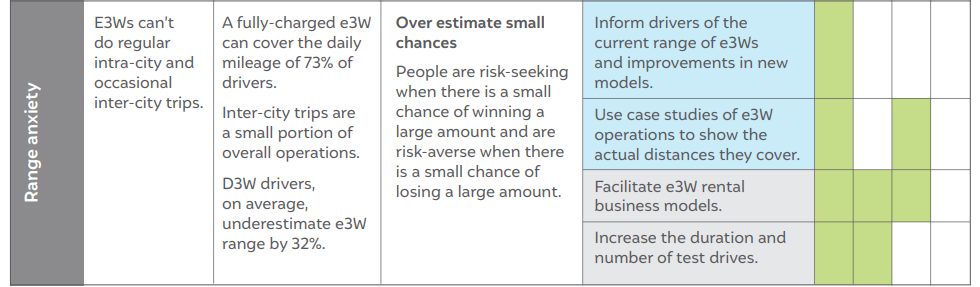
In the FGDs, drivers often stated the limited range of the available e3W models as a barrier to switching to e3Ws. About 45 per cent of the respondents indicated that they considered range as a major concern.
I. Intra-city trips
Stated barrier: Drivers consider e3W range inadequate for their daily requirements
About 61 per cent of drivers felt that e3Ws would not be able to do the same number of trips as their current d3Ws. The drivers perceive that this will lead to revenue loss.
Observed evidence: E3W range can meet the typical daily requirements of threefourths of d3W drivers
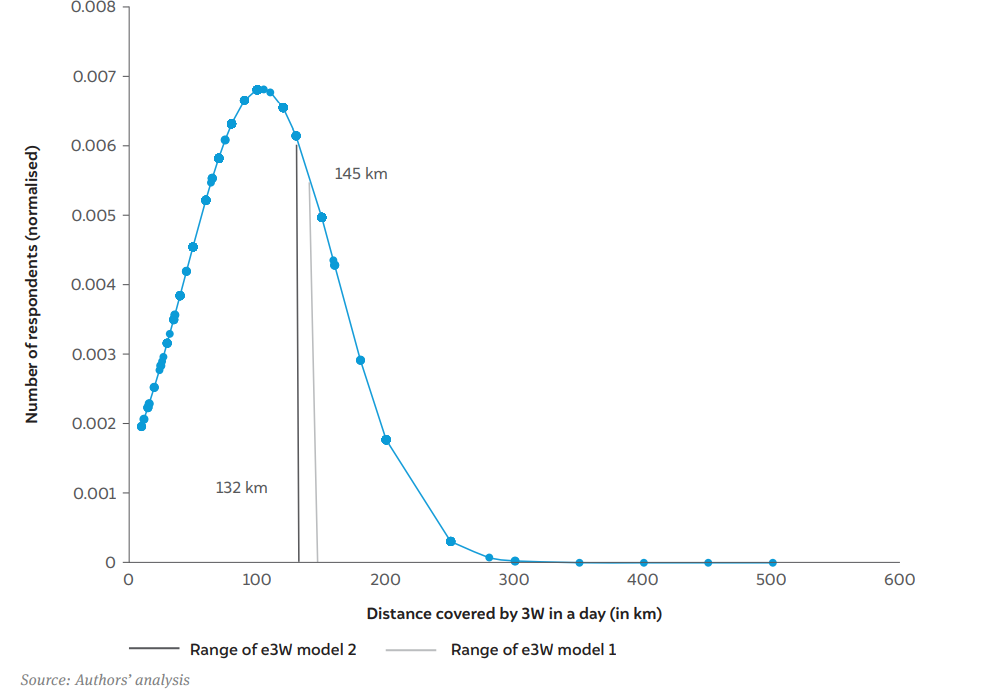
At the time of the survey, the e3W model with the lowest battery range was 132 km (Figure 8). Approximately 73 per cent of the respondents reported travelling distances ‘yesterday’ that were shorter than 132 km. Despite this, 61 per cent of drivers believed that switching to e3Ws would result in limited range, reducing the number of trips they could make.
Figure 8 73% of drivers’ daily distances can be covered by a single full charge of an e3W
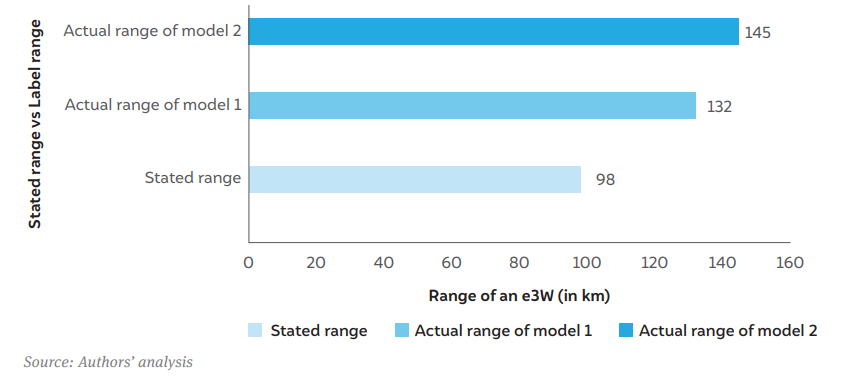
Underlying bias 1: Drivers underestimate e3W battery range
Our survey showed that almost one-third of d3W drivers do not know the range of a fullycharged e3W. Another 40 per cent of respondents think that a fully-charged e3W has a range of less than 100 km. D3W drivers, on average, underestimate e3W range by up to 32 per cent compared to what is stated on e3W OEM labels (Figure 9).
Figure 9 On average, d3W drivers underestimate the e3W battery range by up to 32%
Underlying bias 2: Drivers who have driven e3W estimate battery range closer to the label range
We find that drivers who have never driven an e3W tend to underestimate an e3W’s range far more than drivers who have prior experience. Figure 10 shows that d3W drivers who have driven an e3W at least once in the past perceive the e3W range 16 per cent more accurately than those who have not. However, even those with prior experience continue to underestimate the actual range of e3Ws available in Amritsar. The lack of awareness about the other features of e3Ws is discussed in Section 3.6.
Figure 10 Those who have driven an e3W estimate the range to be 16% higher than those who have not
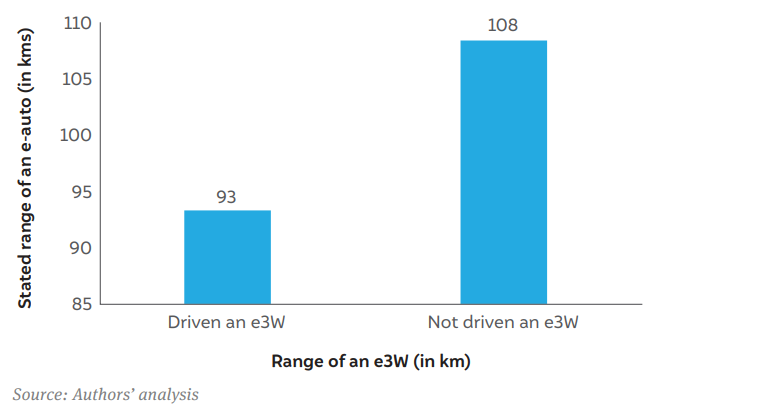
To further validate this finding, two groups of respondents–those who had driven an e3W (N = 207) and those who had not (N = 326)–were evaluated using a two-sample t-test. The results revealed a statistically significant difference in the stated range of an e3W across the two groups (p < 0.05).
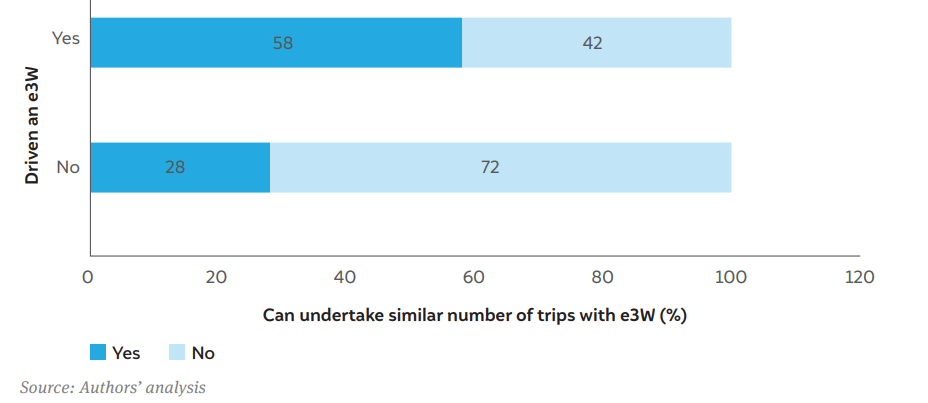
Almost 60 per cent of those who have test-driven an e3W think that it can meet their operational requirements (Figure 11). Only a third of those who had not driven one before expressed the same belief. A chi-square test was performed to validate this result, and a statistically significant relationship was obtained with a p-value less than 0.001.
Figure 11 Approximately 60% of those who have driven an e3W state that it can meet their requirements
II. Long-distance trips
Stated barrier: Drivers cannot make occasional inter-city trips with an e3W
In the FGDs, drivers cited the limited range of e3Ws as a barrier to switching, as it would restrict their ability to undertake inter-city trips. They expressed concerns that e3Ws cannot handle outstation trips, which typically yield higher revenue than local city trips. Drivers cited e3Ws’ inability to fulfil roundtrips to Jalandhar (~80 km from Amritsar) as a significant reason for not choosing e3Ws over d3Ws.
Observed evidence: Inter-city trips are a small portion of overall driving requirements
A substantial 56 per cent of the drivers we surveyed reported that they had not ventured beyond Amritsar in the past week. When it comes to d3W drivers, our analysis suggests that on any given day, the chances of securing an outstation trip is approximately 12 per cent. Interestingly, our survey data highlighted an intriguing trend among drivers accustomed to making frequent outstation trips: they were uncertain about maintaining the same level of trip frequency when transitioning to an e3W.
To delve deeper into this phenomenon, we categorised our respondents into two distinct groups: the first group comprised individuals who expressed confidence about maintaining their trip frequency with e3Ws (N = 203), while the second group consisted of those who expressed apprehension about this transition (N = 312). The results of a two-sample t-test revealed a statistically significant distinction between these two groups. This finding strongly suggests that individuals who frequently embark on outstation trips are notably more concerned about the prospect of maintaining their trip frequency with e3Ws.
Stated barrier: Drivers cannot go to the Attari–Wagah border twice a day on an e3W
The Attari–Wagah border is about 30 km each way from Amritsar’s city centre. It is a popular tourist destination in Amritsar. In FGDs, drivers mentioned that they would not be able to go to the Attari–Wagah border twice a day if they switched to an e3W. They feared that they would not be able to make multiple trips between Amritsar and the Attari–Wagah border on a single charge or a fully-charged battery.
Observed evidence: Multiple trips to the Attari–Wagah border on the same day are unlikely
Our semi-structured field interviews revealed a crucial point: drivers rarely make two trips to the Attari–Wagah border in a single day. This is because the main attraction–the armed forces’ procession at the international border–occurs for just an hour every evening. Thus, 3W trips primarily involve transporting tourists from the city centre to the border, waiting for the procession to end, and then returning with them. It is exceedingly unlikely that a driver would need to make two trips to the Attari–Wagah border on the same day.
Underlying bias: Drivers overestimate the small chance of e3Ws running out of charge
Drivers tend to overestimate the chances of undertaking inter-city trips or multiple long trips on the same day, such as to the Attari–Wagah border. This leads them to overestimate the chances of e3Ws running out of charge.
Nearly two-thirds of the respondents stated that the lack of charging infrastructure was a major concern that influenced their decision to switch to e3Ws. Currently, there are no public e3W charging stations established in Amritsar. However, ASCL has installed e3W charging stations at 18 locations in the district (Tribune 2023).
I. Lack of public charging infrastructure
Stated barrier: Drivers need public charging stations to be as widely available as petrol pumps
Both d3W and e3W drivers stated that they needed charging stations. During our FGD with d3W drivers, several of them stated that they would be more inclined to switch to e3Ws if public charging stations (PCS) were widely installed.
During the interviews, e3W drivers also stated that charging station coverage needed to be similar to that of petrol pumps. Some e3W drivers, who stated that they have charged their vehicles at local stores, pointed out that these stores do not always allow e3Ws to charge, as shop owners are concerned about high electricity costs.
It is worthwhile to note that both e3W drivers (from FGDs) and d3W drivers (from the survey and FGDs) indicated the need for PCS. In the survey, 413 drivers stated that, on average, they needed charging stations every 10 km. The responses varied significantly–from 0.5 km to 70 km, with a standard deviation of 10 km–highlighting the lack of understanding of the actual requirements for PCS.
Observed evidence: Drivers overestimate charging station requirements
E3W drivers indicated in the FGD that they charge their vehicles at home at night and do not need to charge again during the day. Figure 8 shows that 73 per cent of drivers can meet their daily range requirements on a single full charge. If we remove the drivers who live in rented accommodation from this, 63 per cent of drivers can meet their daily requirements with just home charging. However, PCS is necessary to meet the operational requirements of 37 per cent of drivers.
Underlying bias: Anchoring effect
When evaluating their charging infrastructure needs, drivers in Amritsar use existing diesel or petrol station coverage as an anchor, instead of evaluating an e3W’s actual requirements (Tversky and Kahneman 1974).
II. Lack of reliable and safe access to private home chargers
Stated barrier: Drivers do not have appropriate earthing at homes
In FGDs, drivers highlighted the inability to install earthing in their rented residential units due to financial concerns or the reluctance of house owners. E3W drivers pointed out that in the absence of earthing, they would not be able to avail of the battery warranty.
Observed evidence: Only 16 per cent of drivers live in rented accommodation
Only 16 per cent of respondents lived in rented accommodation. Nevertheless, PCS is necessary to meet the operational requirements of two groups: those who live in rented houses and those who drive more than an e3W’s range on a full single charge (~130 km). Excluding these two groups, it is estimated that the energy demand of the mileage requirement 82 per cent of Amritsar’s 3W fleet can be met by home charging.
During the FGDs, d3W drivers emphasised that a vehicle’s physical appearance and features were important in their purchasing decision. In their comparison of e3Ws and their diesel counterparts, they highlighted several concerns related to e3Ws’ physical attributes, looks, and performance.
I. Safety
Stated barrier: Drivers believe e3Ws are small and not sturdy
More than half of the surveyed drivers indicated that safety was a major concern. In FGDs, d3W drivers pointed out that the e3W has a fibre body, making them more susceptible to damage in case of a collision. An e3W driver also recounted an instance where a car hit a parked e3W and broke the e3W’s bumper.
Observed evidence: 3Ws appear smaller in size but comply with the same standards
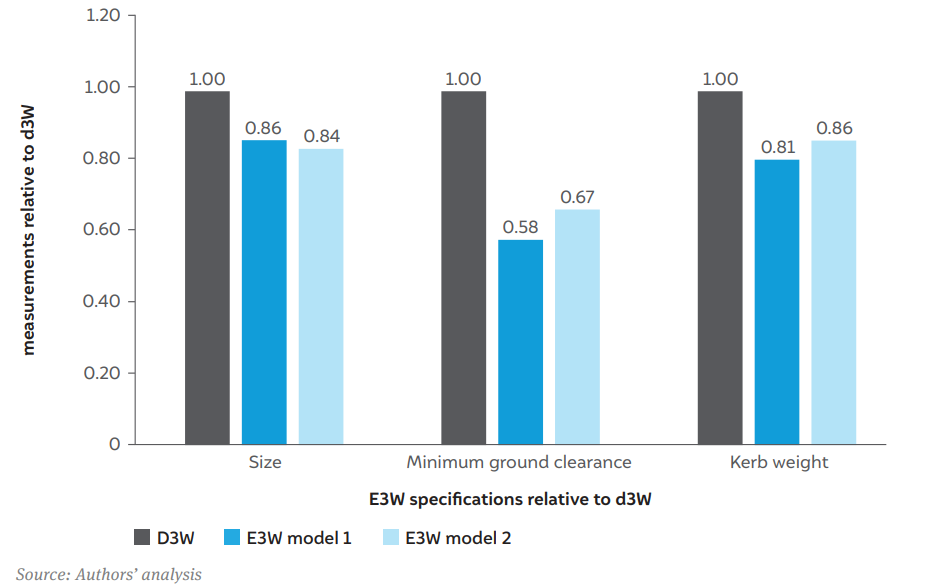
Comparing the vehicle specifications of e3Ws with d3Ws in Amritsar, we find that e3Ws are indeed smaller in terms of size, minimum ground clearance, and kerb weight (Figure 12) (Piaggio 2023; Mahindra n.d.). Size is assumed to be a product of ‘width’, ‘length’, and ‘height’ as provided in vehicle specifications. However, an e3W must meet the same safety standards as any vehicle under the L5M classification4 (ARAI 2019). To the best of our knowledge, there is no evidence of accidents involving e3Ws bearing a higher damage risk.
Figure 12 E3W models are at least ~14 per cent lower in size, ground clearance, and kerb weight as compared to d3Ws
Even though e3Ws comply with the same standards as d3Ws and have a similar carrying capacity, drivers are often negatively influenced by their appearance. We list three underlying biases attributable to this phenomenon.
Underlying bias 1: Priming by e-rickshaws
There are almost 3,000 e-rickshaws registered till today in Amritsar (MoRTH 2023). E-rickshaws are low-speed electric passenger vehicles, mostly operating on lead-acid batteries (Kumar et al. 2022). There are many concerns regarding their performance, safety, durability, and effectiveness as a sustainable livelihood opportunity (Singh, Mishra, and Tripathi 2021). A CEEW study in Lucknow showed that e-rickshaw drivers have lower incomes in comparison to 3W and tempo drivers (Mall et al. 2023).
Only 13 per cent of drivers stated that e-rickshaws have had no impact on their perception of e3Ws. About 19 per cent of drivers reported that safety was a major concern with e3Ws. Of these, 55 per cent stated that their understanding of e3Ws was highly influenced by e-rickshaws.
FGDs show that both e3W and d3W drivers in Amritsar are not in favour of e-rickshaws. Both groups considered e-rickshaws as distinct from 3Ws. However, e3W drivers had greater clarity about performance differences between e3Ws and e-rickshaws than d3W drivers.
Underlying bias 2: Ego
About 27 per cent of d3W drivers stated that they would not be proud to show their e3W to other members in their stand. Primed by the presence of e-rickshaws, drivers perceive switching from a d3W to an e3W as a downgrade in power. Size differences (see Figure 13) and variations in material further compound this bias.
Underlying bias 3: Anchoring effect
Anchoring effect is relevant when drivers evaluate their decision to purchase an e3W. We observed that drivers use their knowledge of a d3W’s size and material as an anchor to evaluate an e3W’s performance and safety.
Stated barrier: D3W drivers believe e3Ws cannot carry as many passengers as a d3W
In addition to the structural material of e3Ws, d3W drivers also voiced concerns regarding the cargo and passenger capacity of e3Ws. In FGDs, drivers emphasised that e3Ws were unable to carry the same number of passengers as a d3W in a single trip. Drivers reiterated concerns about the size of e3Ws and the resultant need to carry fewer passengers–particularly school students. Drivers feared that the lower carrying capacity of e3W would lead to revenue loss.
Observed evidence: Only 16 per cent of drivers undertake school trips
Our survey shows that only 16 per cent of d3W drivers in Amritsar undertake school trips. Further, all L5M vehicles are permitted to carry the same number of passengers (3 + 1), regardless of the operating technology. This includes both e3W and d3W vehicles.
Underlying bias: Discrete mental accounting
D3W drivers tend to evaluate expenses and earnings in terms of discrete bundles such as ‘revenue’ and ‘diesel costs’. The FGDs showed that even within ‘revenue’, there were different mental accounts, such as ‘school trips’ and ‘tourist trips’. One participant highlighted that if he switched to an e3W, he would lose the revenue from hypothetical school trips. Further, while he was aware that his diesel expenses would come down, he was unable to determine if switching to an e3W would be profitable for him–even though non-school trips would more likely be his main source of revenue. As ‘revenue from school trips’ and ‘diesel costs’ are nonfungible mental accounts, d3W drivers are not able to evaluate the net benefit from switching to e3Ws.
I. Incentive bias
Initially, the subsidy amount for e3Ws under the RAAHI scheme was set at INR 75,000 per vehicle (excluding the scrapping incentive). However, due to a lacklustre response and feedback from driver unions, the local government decided to increase the subsidy to INR 1.25 lakh (excluding the scrapping incentive) in January 2023.
Our survey reveals a crucial insight: nearly two-thirds of d3W drivers expressed that they would not switch to e3Ws without these incentives. If the government discontinues the subsidy scheme, either due to the completion of the project timeline or the depletion of funds allocated for subsidising e3Ws, there is a risk that the transition to e3Ws may come to an abrupt halt.
However, there is a mitigating factor at play here. Amongst those drivers who believe that their local leaders or Pradhans would strongly support their transition to e3Ws, the impact of the incentive bias is considerably softened (see section 3.5 B).
II. Messenger
The government as the sole messenger may not be effective
Evidence from FGDs shows that d3W drivers mistrust the government’s messaging regarding e3W benefits. Participants mentioned that d3Ws are often considered a nuisance, and that is what the government is communicating. In Amritsar, news reports show that d3Ws are often highlighted as a source of congestion and pollution in the city (Indian Express 2022). However, it is worth noting that there is no concrete evidence to substantiate these claims. These negative narratives and heavy-handed calls to regulate d3Ws may undermine the government’s effectiveness as a messenger trying to convey the benefits of e3Ws.
Qualitative evidence from our FGDs hint that the government may not be effective as a sole messenger for communicating the benefits of e3Ws.
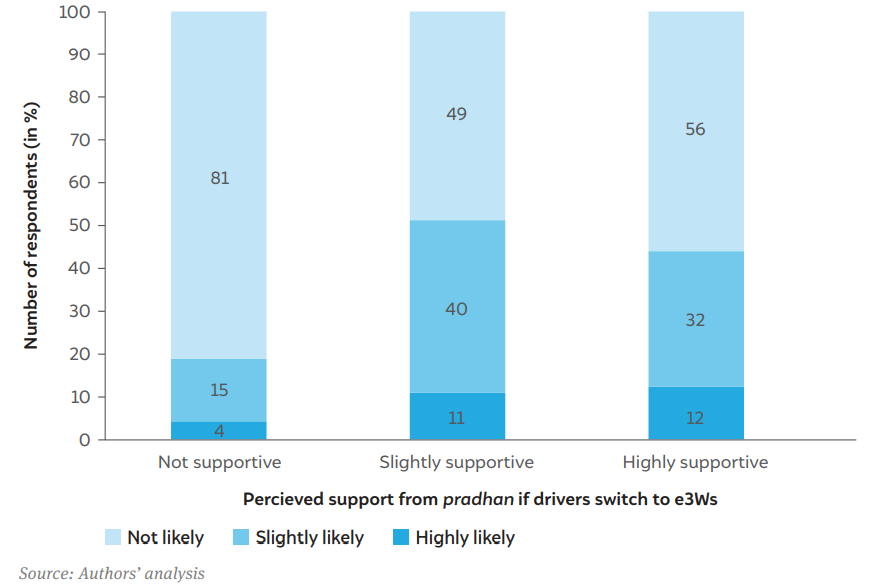
Pradhans have a strong influence on e3W purchase decisions by d3W drivers
In Amritsar, there are 27 3W stands, each having 30 to 120 vehicles. Each stand has one pradhan. Pradhans are informal leaders of 3W stands. Almost half of the d3W drivers surveyed stated that they would be highly likely to transition to e3Ws if their pradhan had an e3W. Only 7 pradhans out of 27 have switched to e3Ws. In FGDs, several participants said that they consider the pradhan very important, and they consult him before any crucial decisions, such as purchasing a new vehicle.
About 21 per cent of the d3W drivers who stated that their pradhan would be highly supportive of their decision to switch to an e3W also reported that they were highly likely to buy one even in the absence of a subsidy. In contrast, only 6 per cent of d3W drivers who believed their pradhan would not be supportive of their decision reported that they would switch to an e3W without a subsidy.
Figure 13 D3W drivers who believe that their pradhan will be highly supportive of their decision are more likely to buy an e3W in the absence of a subsidy
Existing e3W drivers themselves can be effective messengers
E3W drivers shared that they were frequently approached by d3W drivers seeking insights into their experience with e3Ws. Our findings indicate that peer-to-peer communication can significantly cultivate a sense of pride in owning an e3W. According to our survey findings, nearly half of d3W drivers received information about e3Ws from their peers and an impressive 80 per cent of them stated that they would express a sense of pride in showcasing their e3Ws. In contrast, only one-fourth of those who gather information through mere observation of an e3W share the same feeling. We validated this result with a chi-square test, which confirmed a strong and statistically significant relationship (p < 0.001) between pride associated with e3W ownership and source of information about e3Ws.
On 19 May 2023, the ASCL organised a 3W mela (fair) to increase awareness and uptake of e3Ws. At the mela, the ASCL set up a peer-to-peer interaction booth, where d3W drivers could interact with e3W drivers on the benefits of switching. This booth had one of the highest footfalls in the mela. This indicates the level of comfort and trust d3W drivers have in their peers when discussing e3W issues and purchase decisions.
III. Social norms
Peers switching to e3Ws strongly influences individual preference for e3Ws
Our survey shows that 42 per cent of d3W drivers felt that their peers were switching to e3Ws. About 17 per cent stated that they would switch if their peers also switched to e3Ws. We found a statistically significant and high correlation (0.7833) between drivers’ stated impact of their peers switching to e3Ws on their behaviour and their likelihood of buying an e3W within a year.
Older d3W drivers are more influenced by their peers switching to e3Ws than younger drivers
D3W drivers can be classified into three groups: those highly likely (17 per cent), slightly likely (40 per cent), and not likely (43 per cent) to switch if their peers purchase an e3W. To test whether the age of the respondent influences this choice, we performed an ANOVA. The results indicate that there is a strong statistically significant difference (p < 0.001) in the respondents’ ages across the three groups. Conducting the Welch test and Brown–Forsythe test confirmed the existence of a significant difference between the groups, validating the findings of ANOVA.
D3W drivers feel that they will face resistance from their peers if they switch to e3Ws
About 45 per cent of d3W drivers strongly felt that they would face resistance from their peers if they switched to e3Ws. The emotional resistance to switching to e3Ws is further discussed in Section 3.5 F.
IV. Salience
In this section, we present the focal points d3W drivers consider when deciding to switch to an e3W and examine how this focus evolves once they gain firsthand experience of driving an e3W.
D3W drivers focus more on the negative outcomes of switching to e3Ws
The FGDs showed that d3W drivers think more about potential losses than benefits when thinking about switching to e3Ws. This includes loss of revenue from being able to do fewer km and/or carrying fewer passengers with an e3W, future battery costs, etc.
E3W drivers focus more on the positive outcomes of using e3Ws
Similar to d3W drivers, we found that e3W drivers were concerned about battery life, but they emphasised the positive outcomes of adopting e3Ws more. In FGDs and qualitative interviews, e3W drivers emphasised positive attributes such as low costs and ease of use due to no noise and vibrations.
When considering the switch, d3W drivers tend to focus on perceived negative outcomes such as revenue loss and battery replacement costs. However, once they have switched, these outcomes are not as salient anymore, and they focus more on the positive outcomes of their decision.
V. Status quo bias
"Jab tak chal raha hai, chalne do" (let it run for as long as it can run) was a common statement that emerged in our interactions with d3W drivers. This belief is indicative of the sunk-cost fallacy and status quo bias. The status quo bias is reinforced by loss aversion, perceived transition costs (Godefroid, Plattfaut, and Niehaves 2022), as well as social norms (Zhang et al. 2016), which are discussed in section 3.1.
VI. Affect
As highlighted in Section 3.5 B, d3W drivers feel that they are considered a nuisance by the government. On multiple instances, d3W drivers have protested the adoption of e3Ws (Tribune 2023; Bagga 2023). Even though e3Ws stand to improve their livelihoods, there are driver communities and individuals who strongly oppose the transition. This may be attributed to an emotional response or affect, hence, coercing d3W drivers to switch may not be productive.
VII. Commitment
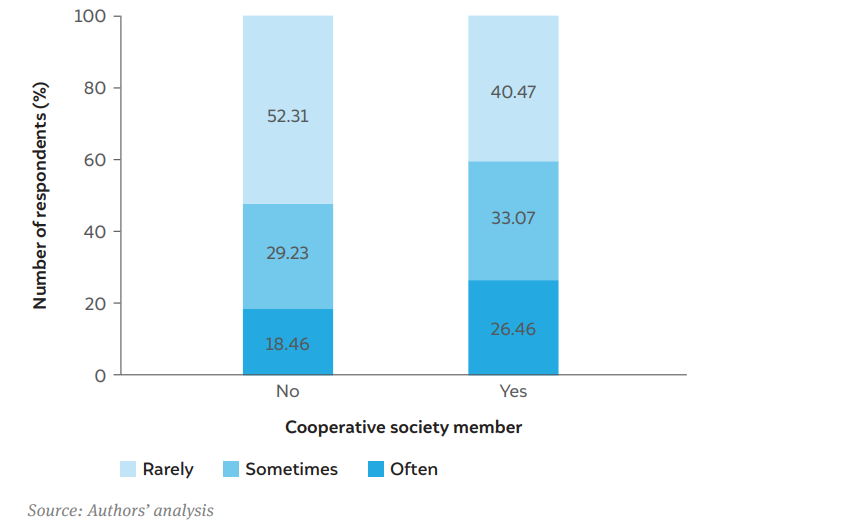
As part of the RAAHI scheme, the local government formed a cooperative society of Amritsar’s 3W drivers. Being a member of this cooperative is the first step to availing of the RAAHI scheme benefits. Despite over 500 d3W drivers joining the cooperative, as of February 2023, only 30 had procured an e3W. However, our survey showed that members were more likely to be interested in availing of the RAAHI scheme in the future owing to the effects of the commitment bias. Members' decision to join the cooperative for e3W drivers is a point of commitment. This first action may make them feel pressured to act in alignment with this initial commitment (Pilat and Krastev 2021). About 56 per cent of drivers in the survey stated that they were members of the cooperative society, and about 26 per cent of cooperative members stated that they were thinking of availing of the subsidy scheme. This was in contrast to non-members, of whom only 18 per cent were considering the scheme. Hence, cooperative members might be more likely to avail of the scheme than non-members (Figure 17).
Figure 14 Members of the e3W drivers’ cooperative society are more likely to consider availing of the scheme than non-members
Later, in July 2023, the ASCL conducted a registration drive, distributing stickers to d3W drivers, which allowed them freedom from traffic enforcement in exchange for a commitment to switch to e3Ws by September 2023 (Rana 2023). This was ostensibly aimed at d3Ws plying illegally in Amritsar. Beyond this exchange, their commitment to switch to e3Ws was not documented. Over 3,000 drivers registered and got RAAHI stickers. By August 2023, just about 50 d3W drivers had submitted their e3W application.
This strategy may be considered a combination of coercion and the commitment bias. Apart from evidence that cooperative member drivers are more likely to consider availing of the scheme, we do not have clear evidence on how commitment bias plays a role in drivers’ decision making, or the efficacy of commitment bias–related methods in nudging d3W drivers in Amritsar to switch.
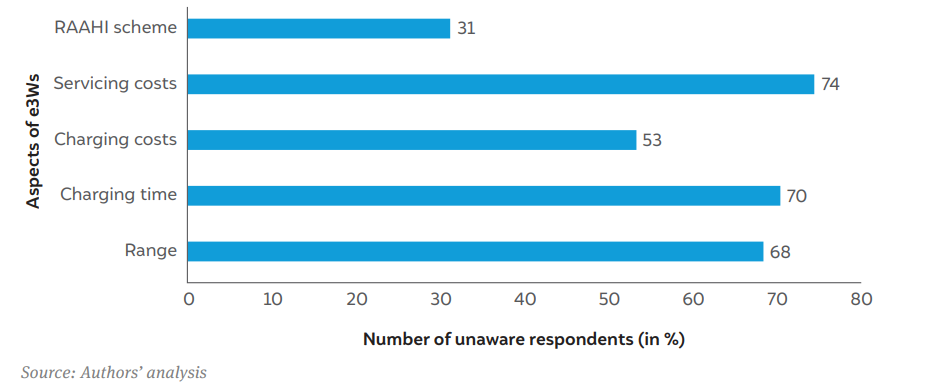
We found that there is a general lack of awareness about e3W features, performance, and the subsidy scheme. We summarise our findings in Figure 15.
Figure 15 Majority of d3W drivers are unaware of the RAAHI scheme and the costs, features, and performance of e3Ws
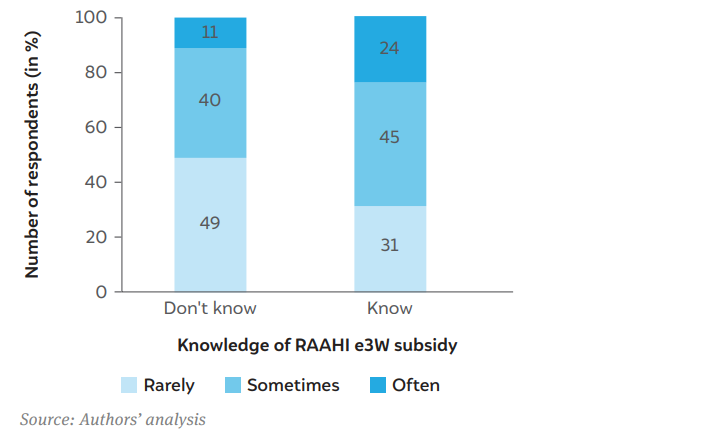
About 24 per cent of d3W drivers who are aware about the subsidy often think of availing of the scheme in contrast to just 11 per cent of those who do not know about the subsidy (Figure 16).
Figure 16 D3W drivers who are aware of the subsidy scheme are more likely to consider availing it
We used an ordinal regression model to measure the impact of economic consequences on a d3W driver’s decision to purchase an e3W. ‘Likelihood to purchase an e3W next year’ was taken as the dependent variable and was measured on a three-point ordinal scale: ‘Not likely’, ‘Slightly likely’, and ‘Highly likely’. The findings helped us understand the role of different factors in an individual’s purchase decision.
To build the regression model on the willingness to switch to an e3W, we considered ‘economic benefit’, ‘charging as a barrier’, and ‘user-driven experience’ as the independent variables. Table 2 presents the results of the ordinal regression model.
Table 2 Estimated parameters influencing e3W preferences
Source: Authors’ analysis
In comparison with other variables, economic factors such as daily earnings improvements and perceived benefits were found to be statistically significant and have more influence on the respondents’ willingness to purchase an e3W.
As expected, there is a negative statistically significant relationship between a respondent’s battery life concerns and their purchase intention. This indicates that 3W drivers tend to have a loss aversion bias due to concerns about battery replacement expenses, which can impede e3W adoption. This is discussed in Section 3.1 C.
Interestingly, a positive statistically significant relationship emerged between respondents’ perception of charging difficulties and their purchase intention. This means that drivers are willing to purchase an e3W despite charging difficulties.
We also observe a positive statistically significant association between owning a d3W and purchase intention. This means that respondents who own their d3W are more likely to purchase an e3W than the drivers who rent their vehicles. This could be attributed to rental drivers being ineligible for subsidies under the RAAHI scheme. This is discussed in Section 3.1 A.
Interestingly, respondents undertaking goods trips were more likely to purchase an e3W. This contradicts our finding that drivers consider e3Ws’ limited carrying capacity as a barrier (see Section 3.4 B). The daily distance covered by 3W drivers doing goods trips is approximately 12 per cent longer than that of other drivers. Their vehicles are, on average, nine years old, which may explain why they are more likely to purchase an e3W.
Fuel expenses were found to have a negative statistically significant relationship with purchase intention. A possible reason for this could be that respondents with higher fuel expenses also cover more kilometres and, therefore, may have higher range anxiety (see Section 3.2). Hence, they are less likely to switch to an e3W.
Lastly, respondents who had driven an e3W before showed a strong and positive statistically significant relationship with purchase intention. This indicates the importance of driving user experience. This also validates the findings presented in Section 3.2 A, i.e., those who have driven an e3W have a better understanding of its operational abilities.
Overall, the results of the ordinal regression model show that understanding economic benefits, the e3W driving experience, and mitigating battery life concerns can significantly improve d3W drivers’ preference for e3Ws.
In this section, we section presents key insights from our study on barriers and enablers influencing the adoption of e3Ws in Amritsar. We elaborate on the key challenges identified and highlight instances where certain enablers such as social influence and hands-on experience can positively shape drivers' perceptions of e3Ws. Finally, we also assess the generalisability of these findings through a comparison of driver characteristics in Amritsar with those in Kochi, Kerala to identify similarities in operational and ownership patterns.
Limited public charging infrastructure is a major barrier impeding the switch to e3Ws in Amritsar. D3W drivers may be overestimating the need for charging infrastructure, but that does not discount the lack of charging infrastructure as a real barrier. We show that public charging infrastructure is essential for drivers who live in rented houses or drive more than ~130 km daily. The ASCL needs to establish PCS to accelerate e3W uptake. Ensuring that these charging stations are visible and accessible will have positive implications for reducing range anxiety.
E3W battery life is a concern for both diesel and electric 3W drivers. D3W drivers tend to conflate battery warranty with actual battery life. Further, as there are no e3Ws on Amritsar roads that are older than three years, there is no clear evidence to show drivers that the battery life of an e3W is more than three years. OEMs must address this barrier by mitigating the uncertainty surrounding battery life.
Unlike charging infrastructure, there is already a policy to address the costs of transitioning to e3W: financial incentives under the RAAHI scheme. However, behavioural biases such as discrete mental accounting and the sunk-cost fallacy are reducing their effectiveness. Hence, it is imperative to focus on mitigating factors underlying these biases.
We did not find any clear evidence of increased accident risk or any deviation in the permitted passenger load in an e3W compared to a d3W. These stated barriers are clearly driven by biases such as the anchoring effect, ego bias, and priming by e-rickshaws. The pride associated with car ownership around the world is well explored in the literature (Moody 2019). In the context of 3Ws, d3W drivers exhibit a consistent and positive self-image using vehicle accessories such as seats, music systems, and paintings/stickers. An e3W’s smaller size, kerb weight, and difference in material may have a negative influence on d3W drivers’ purchase intentions.
We observed a case where a dealer in Amritsar attempted to increase the size of e3Ws to enhance sales. An external “metal armour” was added to the vehicle to make it appear “bigger”. The impact of these modifications may have negatively impacted e3W efficiency. However, the dealer stated that these modifications significantly increased e3W sales.
The policy approach for nudging e3W adoption in Amritsar should aim to mitigate some behavioural biases and leverage others. For example, discrete mental accounting prevents d3W drivers from comparing diesel savings with e3W EMI. This must be mitigated. On the other hand, using pradhans and e3W drivers as messengers can positively influence e3W adoption.
D3W drivers typically underestimate e3W range and performance, and overestimate situations where e3Ws may fail, such as the frequency at which they may have to take outstation trips. We find that d3W drivers who have driven an e3W have a better sense of its range and ability to meet their needs. Further, there is literature demonstrating the positive effects of EV driving experience on drivers’ preference to switch to them (Brückmann 2022; Bühler et al. 2014). Hence, direct user experience can improve d3W drivers’ understanding of e3Ws. This user experience can take the form of test drives for longer periods.
We used purposive and convenience sampling to get a representative sample of d3W drivers in Amritsar. While we have established the internal validity of our findings, their external validity is not universal. Some insights, such as the influence of pradhans on e3W purchase decisions, may not be valid for all cities. However, this does not mean that the findings are invalid for other Indian cities facing similar issues. In Table 3, we have compared the case of d3W drivers in Amritsar with those in Kochi, Kerala. Many factors, such as average distance travelled, daily revenue earned, diesel expenses, age distribution of d3Ws, diesel vehicle models, and ownership patterns, are similar.
Table 3 The case of d3W drivers in Amritsar is similar to Kochi
| Category | Amritsar | Kochi |
|---|---|---|
| Daily utilisation | 103 km | 100 km |
| Daily revenue earned | INR 853 | INR 950 |
| Daily diesel expenses | INR 295* | INR 229* |
| Average vehicle age | 8.9 years | 4 years |
| Ownership | 84% of drivers are owners | 84% of drivers are owners |
Source: Authors' compilation
*Note: Normalised with diesel price in Delhi as of 31 March 2022 (PPAC 2022).
This report emphasises the need to look beyond techno-economics to accelerate e3W adoption. While favourable techno-economics is a necessary condition, there are behavioural biases that may render conventional policy instruments ineffective. We also make a case to engage stakeholders and community members in policy formulation and implementation processes more actively, through CBPR.
Using the BCW framework, we have classified our recommendations as communication/ marketing, service provision, environmental restructuring, incentivisation, and regulation (Michie, van Stralen, and West 2011).
We have also identified specific actors for each recommendation, such as dealers, OEMs, the ASCL, and electricity distribution companies in Amritsar (Table 5). Along with the primary recommendations, we have listed our insights on the solutions that CEEW tried out in Amritsar.
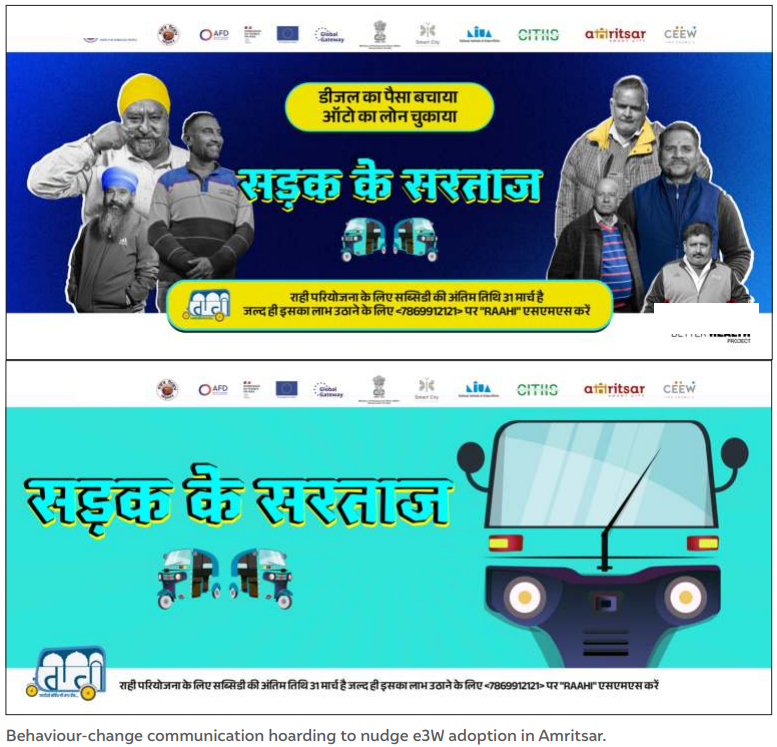
Table 4 Recommended actions to nudge e3W adoption in Amritsar
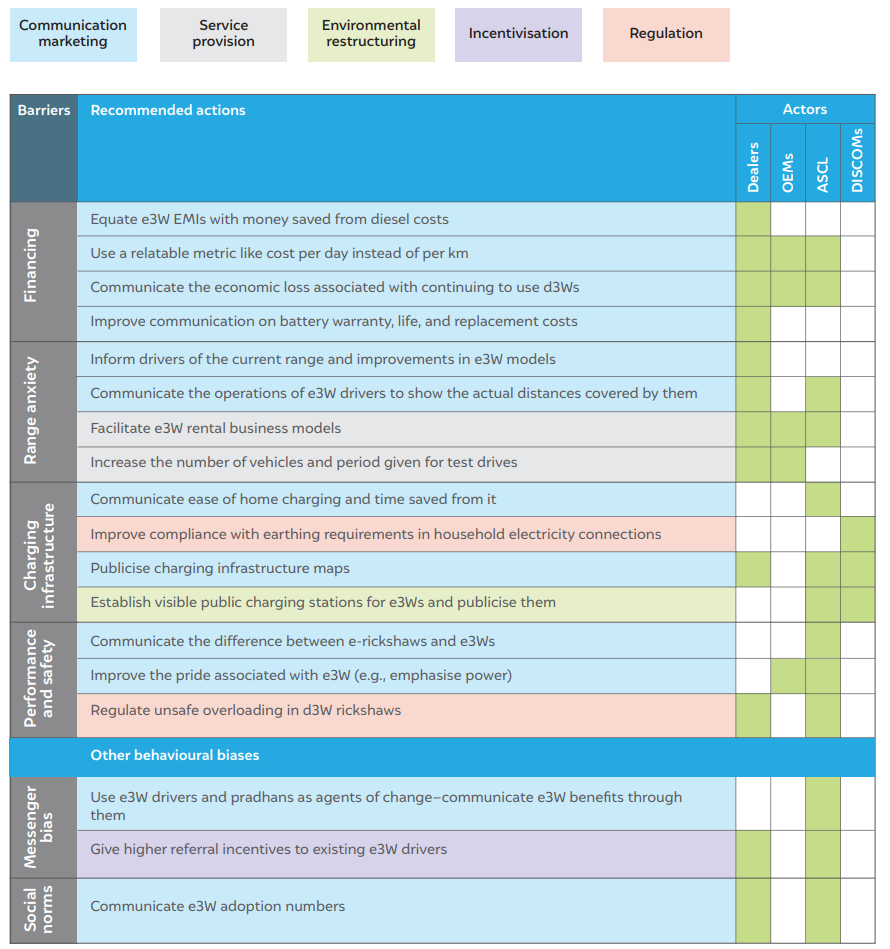
Source: Authors’ analysis
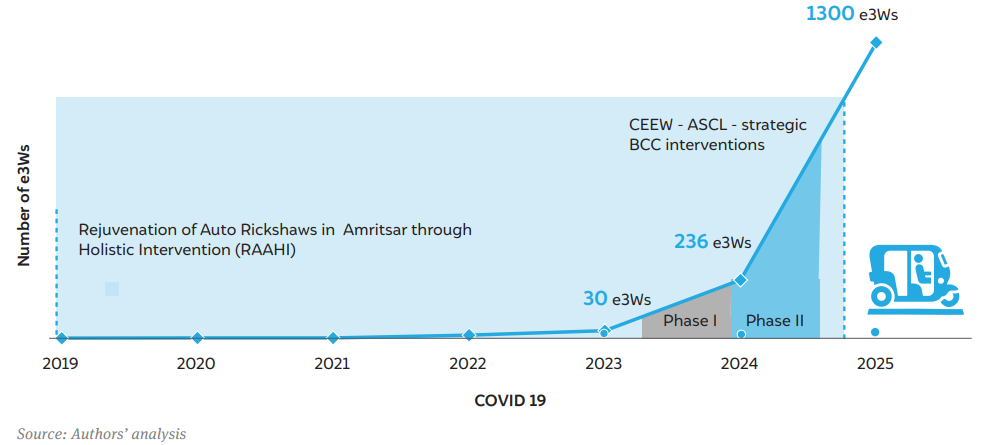
In this report, we studied the case of d3W drivers in Amritsar who–despite being offered subsidies, incentives, and economic opportunities–are reluctant to switch to e3Ws. We show that d3W drivers can earn more from the very first day of switching to an e3W, even after accounting for the e3W loan. We study contextual behavioural factors using the MINDSPACE framework and present the stated barriers, observed evidence, and underlying biases impeding the switch to an e3W in Amritsar. Using the BCW framework, we suggest five categories of actions for four types of stakeholders (Table 4). We also showcase the trials, pilots developed by our team in the context. We find that within 6 months of an informal network informational campaign and direct user experience pilot, more than 1300 3W drivers have switched to e3Ws from d3Ws (based on ASCL data, August 2025). The efforts helped Amritsar reach its critical threshold of e3Ws adoption rate, and progress is likely to continue in future without substantial subsidies.
Figure 17 CEEW - ASCL behaviour change communications interventions in two phases likely led to higher e3W adoption rates in Amritsar
Evidence from behavioural science literature is scarce for both India and e3W adoption. Most of the evidence on nudging EV adoption in the literature focuses on four-wheelers in developed countries. To the best of our knowledge, apart from this study, there is no other research that looks at behavioural factors affecting e3W preferences. While the pilot provides initial insights into the potential of direct user experience to address certain behavioural barriers, the short duration of our trial may not have captured long-term behavioral patterns or challenges. This requires detailed investigation and extended trials periods in future studies to understand vehicle durability, evolving user expectations, and sustained adoption dynamics (Raghavan, Vaid, and Sen "unpublished manuscript"). Such scientific evaluations are crucial to understand the impact of behaviour change interventions, as this can help identify new, cost-effective, and scalable solutions for EV adoption so that subsidies can be diverted to vehicle segments yet to achieve favourable techno-economics.
The framework, methods, and solutions are transferable to other vehicle segments and their electrification in other Global South cities. Beyond transport, the learnings could help develop behaviour nudge strategies for technology adoption, innovation adoption in clean cooking, solar, and emission-abating technologies in the construction and demolition sectors. This report covers the target, explore, and solutions phases of the BIT's TESTS framework. Based on its findings, CEEW conducted the fourth phase by developing and trialling the practical solutions in Amritsar. However, their effectiveness is yet to be measured. Amritsar's trial impacts can serve as a benchmark for planning scalable interventions to accelerate e3W adoption in other Indian cities.
Behavioural biases are systemic inclinations in human decision making that operate outside of the tenets of logic, plausibility, and reasoning based on probability (Hans et al. 2022). These impede rational decision making and require unique approaches or interventions known as nudges to guide choices while respecting individuals' freedom.
E-rickshaws are low-speed electric passenger vehicles, mostly operating on lead acid batteries (Kumar et al. 2022). There are many concerns regarding their performance, safety, durability, and effectiveness as a sustainable livelihood opportunity (Singh, Mishra, and Tripathi 2021). FGDs show that both e3W and d3W drivers in Amritsar are not in favour of e-rickshaws. However, only 13 per cent of drivers stated that e-rickshaws have had no impact on their perception. About 19 per cent of drivers reported that safety was a major concern with e3Ws. Of these, 55 per cent stated that their understanding of e3Ws was highly influenced by e-rickshaws.
Pradhans or local informal leaders and peers have a strong influence on e3W purchase decisions by d3W drivers. Almost half of the d3W drivers surveyed stated that they would be highly likely to transition to e3Ws if their pradhan had an e3W. Our survey also shows that 42 per cent of d3W drivers felt that their peers were switching to e3Ws. About 17 per cent stated that they would switch if their peers also switched to e3Ws. Therefore, informal networks play a crucial role in informing e3W perceptions of drivers and can be harnessed to to communicate benefits of e3Ws and improve pride in e3W ownership.
Scaling Battery Swapping for India’s EV Ambitions
How States can Build Capacity for Urban Mobility Officials:
Can Indian Highways Support Zero-Emission Trucking?
India On The Move:Stories of people driving the bus sector