Council on Energy, Environment and Water Integrated | International | Independent
Suggested Citation: Shetty, Karthik, Smita Chakravarty, Deepak Yadav, Suresh Kotla, Shweta Srinivasan, and Pranav Dadhich. 2026. Advancing India’s Green Steel Transition: Leveraging Industrial Clusters to Decarbonise Small and Medium Enterprises. New Delhi: Council on Energy, Environment and Water; Institute for Sustainable Communities; India Climate Collaborative.
Coal-based direct reduced iron (C-DRI) accounts for almost 30 per cent of crude steel production and remains the most emissions-intensive steelmaking route, emitting 2.7–3.1 tCO₂ per tonne of crude steel (tcs). The sector is dominated by small, standalone units with limited resources, typically clustered in resource-rich regions such as Chhattisgarh, Odisha, and Karnataka. Despite variations in production mix, input use, and energy sources, C-DRI units within each cluster exhibit similar operational characteristics, creating opportunities for shared infrastructure, aggregated demand, and common decarbonisation solutions.
To leverage this opportunity, the report develops a cluster-level evaluation framework that compares steel clusters based on annualised decarbonisation costs and readiness for transition. The framework plots each cluster on a cost–readiness matrix, with annualised decarbonisation cost (USD/tCO₂) on one axis and a readiness score, built from 27 sub-levers spanning decarbonisation measures and ecosystem enablers, on the other. Clusters are grouped into four categories, with those characterised by low decarbonisation costs and high readiness best positioned.
To operationalise the framework, the study surveyed C-DRI units in Sundargarh, Jharsuguda, and Bellary, covering about 30 per cent of installed capacity in these clusters, and combined the findings with earlier surveys in Raipur and Raigarh. Together, the five clusters account for over half of India's C-DRI production. Using these data, the report develops cluster-level emissions inventories, evaluates pathways to net-zero through marginal abatement cost (MAC) curves, and estimates the investments required for transition across six decarbonisation levers: pellet use, increased scrap utilisation, waste heat recovery (WHR), firm and dispatchable renewable electricity (FDRE), imported coal, and carbon capture, utilisation and storage (CCUS), with residual emissions being delegated for offsets.
When all decarbonisation levers are considered, all clusters exhibit high decarbonisation costs and, except Bellary, high readiness levels. Building on these findings, the report presents a phased roadmap that begins with strengthening awareness and data disclosure and enabling policies; advances to deploying low-carbon technologies; and ultimately scales solutions through demonstration projects and targeted cluster-level interventions.
India is the world’s second-largest steel producer, accounting for 7.4 per cent of global output in 2023 (Verma et al. 2024). The steel industry contributes approximately 2 per cent to India’s GDP (IBEF 2025) and supports nearly 2.8 million jobs. Yet, India’s steelmaking remains among the most emissions-intensive globally, emitting 2.54 tonnes of carbon dioxide per tonne of crude steel (tCO₂/tcs) compared to the global average of 1.91 tCO₂/tcs. Among the key factors driving this gap is the predominance of coal-based direct reduced iron (C-DRI)—a steel-making route where India is the world’s largest producer. C-DRI contributes nearly 30 per cent of the country’s crude-steel output and emits between 2.7 and 3.1 tCO₂/tcs (Verma et al. 2024). Crude steel capacity in India increased at a rate of 10 per cent between 2003–04 and 2023–24, reaching 179.5 million tonnes (Mt) (JPC 2023–24). The National Steel Policy (MoS 2017) projects capacity to rise to 300 Mt by 2030–31. Expansion pathways differ; integrated steel plants are adding capacity mainly through the blast furnace route, while the sponge iron sector is expanding via coal-based rotary kilns. According to the Sponge Iron Manufacturers Association (SIMA), an additional 27 Mt of C-DRI capacity is planned to be added by 2030, on top of the current 48.2 Mtpa, potentially locking in high-carbon capacity for decades without targeted intervention.
While integrated steel plants generally possess the financial and technical capacity to pursue decarbonisation, the C-DRI sector is dominated by small, standalone units with limited resources. These units are typically clustered in resource-rich regions such as Chhattisgarh, Odisha, etc. Decarbonising C-DRI can reduce costs for smaller firms, increase competitiveness, and unlock new economic activity. With the steel sector accounting for nearly 12 per cent of India’s total emissions (Verma et al. 2024), achieving the national targets of 45 per cent emissions-intensity reduction by 2030 and net-zero by 2070 will require the targeted transformation of C-DRI clusters.
Despite variations in production mix, input use, and energy sources, C-DRI units within each cluster exhibit similar operational characteristics, enabling the deployment of shared infrastructure and common decarbonisation solutions. To harness this opportunity, we developed an evaluation framework supported by a survey of prominent DRI clusters to assess and compare clusters in terms of cost and readiness for a low-carbon transition. The framework evaluates emissions profiles, infrastructure gaps, and mitigation options. Insights from the framework inform cluster-specific strategies and crosscutting recommendations with phased timelines, offering a roadmap to accelerate low-carbon transition in one of India’s most emissionsintensive industrial segments and align it with national climate and development goals.
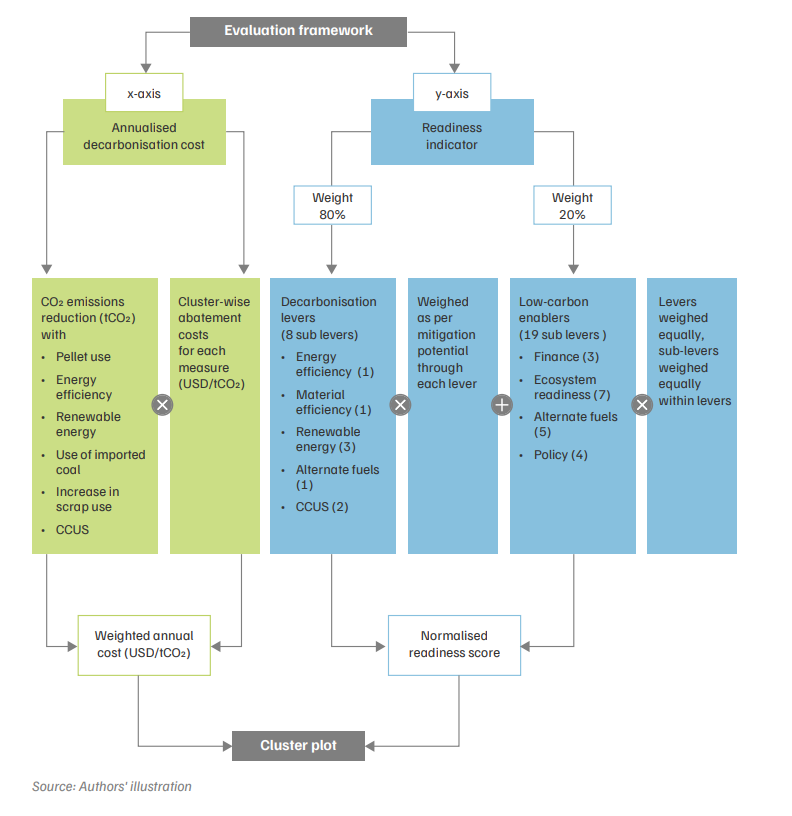
The evaluation framework assesses India’s C-DRI clusters along two key dimensions— annualised decarbonisation cost and readiness (Figure ES1). It serves as a decision-support tool to compare decarbonisation potential, cost-effectiveness, and implementation feasibility across clusters. Clusters are plotted on a cost–readiness matrix, with the x-axis representing annualised decarbonisation cost (USD/tCO₂ mitigated) and the y-axis representing readiness. The cost dimension captures the expenditure per tonne of CO₂ reduced, while readiness reflects each cluster’s preparedness to decarbonise through levers such as energy efficiency (EE), renewable energy (RE), and ecosystem readiness, which together act as key enablers.
Figure ES1. The evaluation framework considers the decarbonisation potential and readiness of a cluster
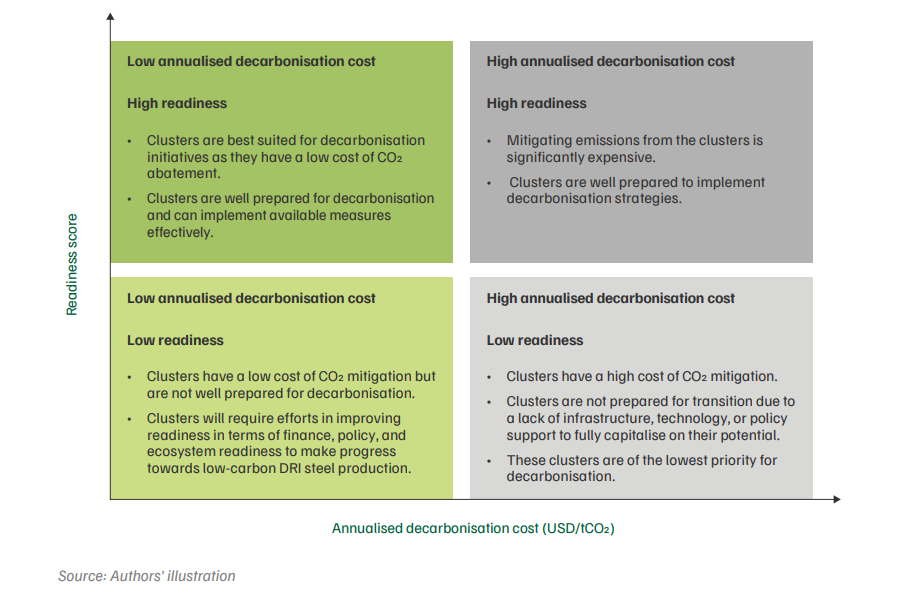
Based on these dimensions, clusters are grouped into four categories (Figure ES2). From an implementation perspective, clusters with low annualised decarbonisation costs and high readiness (dark green) are better suited for immediate decarbonisation and new capacity addition, whereas clusters that have high decarbonisation costs and low readiness (red) are not prepared for transition and will need significant efforts and policy support to decarbonise.
Figure ES2. Categories of clusters explained based on annualised decarbonisation cost and readiness levels
To operationalise the framework, we surveyed DRI units across three major clusters— Sundargarh and Jharsuguda (Odisha) and Bellary (Karnataka)—covering about 29 per cent of installed capacity and 20 per cent of the number of units in these clusters. Insights from earlier work in Raipur and Raigarh (Chhattisgarh) (Nitturu et al. 2024) were incorporated to complete the analysis across five clusters, which together account for over half of India’s C-DRI production. The surveys captured plant-level data on technology use, fuel mix, and operational barriers. The key findings from the survey are discussed in Chapter 3 of the report.
Based on the survey data, we developed an emissions inventory for the five clusters (detailed in Chapter 4). Our results indicate that C-DRI units primarily drive emissions within steel clusters (ranging between 78–86 per cent). Larger clusters, such as Raipur (7.75 Mt) and Raigarh (10.66 Mt), record higher overall emissions owing to their greater DRI capacity of 3.4 and 3.46 Mt, respectively, as well as higher-capacity induction furnace (IF) (4.01 Mt) and electric arc furnace (EAF) (6.28 Mt) plants. Clusters with significant domestic fuel use, such as Sundargarh with 88 per cent, exhibit disproportionately higher emissions. In the next step, we use the emissions inventory and the penetration levels of various decarbonisation levers across clusters to evaluate pathways for achieving net-zero emissions. We followed the approach outlined in our earlier research (Elango et al. 2023), assuming that these measures can be implemented immediately under current conditions. The financial requirements associated with each decarbonisation lever are represented through a marginal abatement cost (MAC) curve (Figure ES3).
Figure ES3. Marginal abatement cost curves (MACs) for all the decarbonisation levers in the five clusters
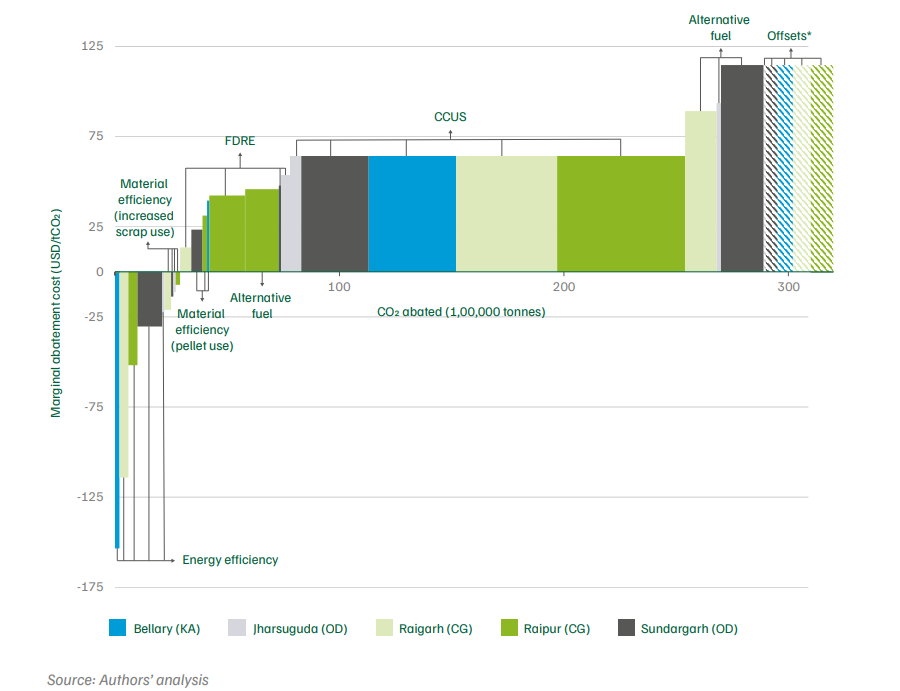
Generally, mitigation costs vary across clusters depending on the price of incumbent fuels, energy sources, and decarbonisation measures. Across all clusters, WHR consistently delivers cost savings (–153 to –22 USD/tCO2 ) by displacing more expensive power sources. Scrap use also has a negative abatement cost (–4 to –7 USD/tCO2 ) but contributes only marginally (0.76 Mt across 5 clusters) to overall emission reduction. In contrast, pelletisation, firm and dispatchable renewable energy (FDRE), alternative fuels, and CCUS have positive MAC values. Although pelletisation incurs lower abatement costs, its impact on emission reduction remains marginal. While FDRE can significantly mitigate emissions (2.52 Mt across 5 clusters), the cost of mitigation varies across clusters, depending on local cost of electricity and open access (OA) charges. The use of imported coal (an alternative fuel) is particularly expensive and is relevant mainly to clusters in Odisha that rely heavily on domestic coal. Among the available decarbonisation levers, CCUS dominates both in terms of cost and the share of emissions abated across each cluster.
Figure ES4. Cluster-wise relative readiness scores for all eight readiness levers
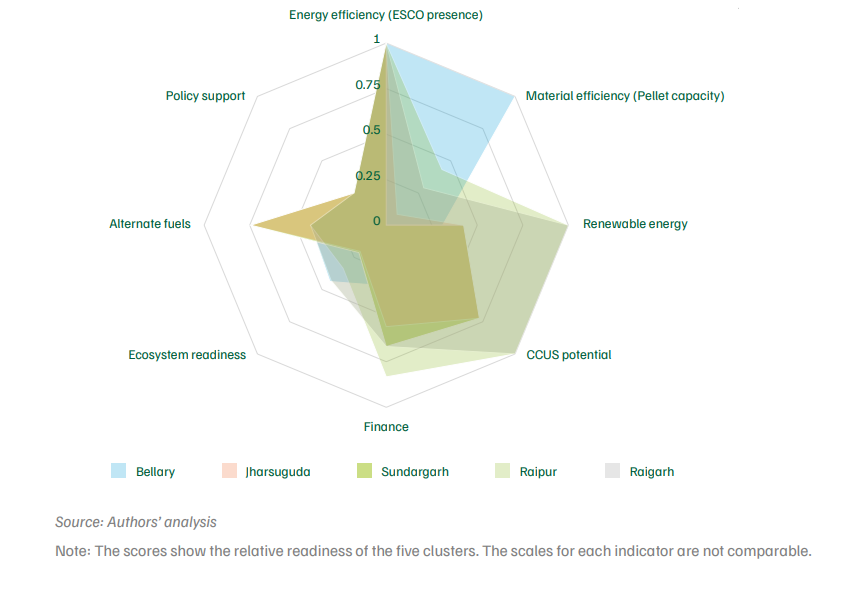
The readiness score (Figure ES4) aggregates scores across eight sub-levers—EE, ME, RE, CCUS potential, finance, policy support, alternative fuels, and ecosystem readiness—to produce a composite readiness index for every cluster. The detailed computation methodology and weighting structure are presented in Chapter 5 of the report. Overall, EE readiness is high across clusters, given the widespread presence of ESCOs and basic efficiency measures, though project-level engagement remains limited. ME readiness is strongest in Bellary and Raipur, which have sufficient pellet capacity, while Raigarh and the Odisha clusters lag behind. RE readiness is highest in Chhattisgarh and Karnataka, supported by operational green-OA rules and low tariffs, whereas Odisha’s draft rules constrain progress.
For CCUS, favourable storage geology in Chhattisgarh and Odisha improves readiness. Financing conditions are better in Chhattisgarh and Odisha due to the presence of SIDBI branches, and a larger share of non-standalone units. Ecosystem readiness remains weak across clusters, reflecting limited awareness and low PAT coverage. Alternative fuels readiness is relatively stronger in Odisha, which has a state hydrogen policy, while Chhattisgarh faces high delivered NG prices. Policy support remains uniform nationwide, with central initiatives such as taxonomy in place but no state-level GPP frameworks yet operational.
Integrating cost and readiness as annualised decarbonisation cost and readiness score (methodology described in Chapter 5) yields cluster plots. Figure ES5 presents three cluster plots that illustrate annualised decarbonisation cost (x-axis) and readiness (y-axis) across three scenarios: (i) with all decarbonisation measures, (ii) excluding CCUS, and (iii) excluding both CCUS and alternative fuels. The volume of emissions mitigated is represented by the size of the bubble.
When all decarbonisation levers are applied, all clusters exhibit high costs and—except for Bellary—high readiness. Bellary records a lower annualised decarbonisation cost because its existing WHR capacity fully meets its power demand, and it already uses 100 per cent imported coal. Consequently, there is limited scope for additional RE or alternative fuel interventions, which would increase the cost of decarbonisation. As CCUS dominates across all clusters, both in terms of its mitigation share and its cost. This heavily skews the potential and readiness scores of all clusters. For example, in Bellary, 78 per cent of total mitigation depends on CCUS. However, because Bellary lacks CCS potential in the form of saline aquifers or basalt rocks, its readiness scores are significantly lower. By contrast, all other clusters possess CCS potential in the form of saline aquifers.
Figure ES5. All clusters have higher decarbonisation costs due to carbon capture utilisation and storage (CCUS)-related costs
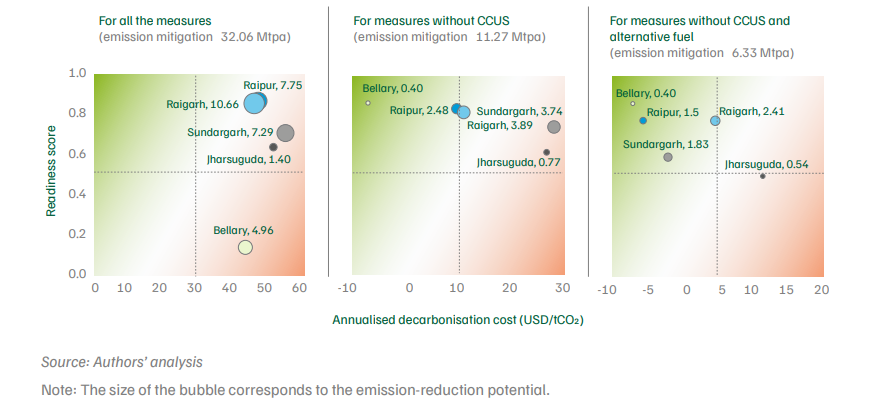
The second cluster plot excludes CCUS to better isolate lower-cost, near-term decarbonisation opportunities. Without CCUS, the annualised decarbonisation costs of all clusters decrease substantially, with the threshold for a high-decarbonisation cluster dropping from USD 30 per tonne CO2 per year to USD 10. The emissions mitigated also decline significantly, indicated by the reduced bubble size.
Since using imported coal as a decarbonisation measure significantly increases costs, we developed another cluster plot that excludes alternative fuels in addition to CCUS. The clusters’ annualised cost scores are now primarily shaped by the remaining four levers: WHR, scrap utilisation, FDRE, and pelletisation. In terms of readiness, the 80 per cent weight assigned to decarbonisation levers is allocated to EE, ME, and RE in proportion to the emissions mitigated by each measure. Emission reductions further decline in clusters that need alternative fuels (coal substitution with imported coal) to decarbonise.
Regardless of changes in the annualised decarbonisation cost and readiness levels arising from the inclusion or exclusion of specific decarbonisation levers, the evaluation framework remains scalable. It allows for new clusters and improved data to be incorporated over time. With additional surveys and stakeholder inputs, the framework can evolve into a robust national planning framework for decarbonising India’s secondary steel sector.
Cross-cutting recommendations
Given our findings on the limited near-term feasibility and costs of CCUS and expensive alternative fuels through imported fuel use, this section concentrates on interventions that can be implemented immediately and suggests piloting CCUS.
Ecosystem enablers (short-term)
EE (short-term)
ME (medium-term)
RE (short to medium-term)
Demonstration and pilots (short to medium-term)
Clusters such as Bellary and Sundargarh, with high WHR potential, should focus on maximising WHR utilisation and enabling local sale of surplus power to nearby induction furnaces. Clusters with limited access to pellets (Odisha and Raigarh) require policy and infrastructure support to expand pelletisation capacity and lower transport costs through slurry pipelines. Chhattisgarh should reduce the value-added tax on natural gas, which currently raises delivered prices by nearly 30 per cent compared to Karnataka. States with lower OA charges, such as Chhattisgarh, should leverage these advantages to expand RE supply across clusters. Karnataka should notify green hydrogen policies and reduce OA charges to enable early adoption and offtake aggregation in industrial clusters. Strengthening institutional mechanisms, including the revival of defunct associations such as OSIMA in Odisha, will be crucial for coordinating decarbonisation efforts in the state.
The study develops a cluster-based evaluation framework that ranks five Indian DRI clusters on two dimensions: annualised decarbonisation cost and readiness. Using plant-level survey data on technology use, fuel mix, and operational barriers, it builds an emissions inventory for each cluster, evaluates pathways to net zero, then passes the data through the framework to plot every cluster on a readiness-versus-cost matrix, and translates the findings into phased, cluster-specific and cross-cutting policy recommendations.
India is the world’s second-largest steel producer, and with crude steel output of about 144 million tonnes (Mt) in 2023–24, India’s crude steel capacity is targeted to reach 300 Mt by 2030–31 as per the National Steel Policy 2017. Steel accounts for around 12 per cent of the country’s total emissions, and Indian steelmaking is among the most emissions-intensive globally, at 2.54 tonnes of CO2 per tonne of crude steel (tCO2/tcs) against a global average of 1.91. A substantial part of that gap comes from coal-based direct reduced iron (C-DRI), where India is the world’s largest producer: C-DRI makes up nearly 30 per cent of India’s crude-steel output and emits between 2.7 and 3.1 tCO2/tcs. With another 27 Mt of C-DRI capacity planned by 2030, decarbonising this route is essential to meet India’s nationally determined contribution.
India’s sponge iron production is heavily concentrated in coal- and iron-rich states. As of 2021–22 the country had about 37 Mt of capacity across 283 plants, and just five states (Odisha, Jharkhand, Chhattisgarh, West Bengal, and Karnataka) accounted for 86 per cent of that capacity and 85 per cent of the plants. Of the 52 districts in India with DRI units, only 10 have a capacity exceeding 1 Mtpa, and those 10 together account for 72 per cent of the country's total DRI capacity. That concentration is what makes a cluster-based approach practical, since a handful of regions covers most of the sector’s emissions.
The C-DRI sector is made up largely of small, standalone units with limited financial and technical resources, concentrated in resource-rich regions such as Chhattisgarh and Odisha. From our surveys, we find that within any given cluster, these units tend to share similar operations, inputs, and energy use, with a range of plant configurations. That similarity means shared infrastructure and common solutions can be deployed across a whole cluster rather than plant by plant. Geographic clustering also allows demand to be aggregated and resources to be pooled, bringing down the cost of decarbonisation for firms that could not afford it alone.
The study combined secondary data analysis, stakeholder consultations, and plant-level surveys. Major DRI clusters across India were first mapped and assessed using indicators such as production capacity, infrastructure, resource availability, and decarbonisation readiness. Based on this analysis and consultations with SIMA, detailed surveys were conducted in Bellary (Karnataka), Sundargarh, and Jharsuguda (Odisha). The surveys covered approximately 30 per cent of DRI capacity across these clusters and were supplemented with earlier CEEW surveys in Raipur and Raigarh (Chhattisgarh) facilitated by industry associations and energy service companies.
The study assesses several levers: energy efficiency through waste-heat recovery, material efficiency through pelletisation and an increase in scrap use, renewable energy, a switch to higher-grade imported coal, and carbon capture (CCUS) with offsets for residual emissions. Waste-heat recovery and higher scrap use are the most attractive, since both reduce costs while mitigating emissions. Deeper reductions, however, depend heavily on CCUS
The framework is a decision-support tool that plots each cluster on a cost–readiness matrix. The horizontal axis is the annualised cost of decarbonisation, in USD/tCO2 mitigated. The vertical axis is a readiness score built from two groups of indicators: the decarbonisation levers (energy efficiency, material efficiency, renewable energy, alternative fuels, and CCUS), which carry 80 per cent of the weight, and low-carbon enablers (finance, ecosystem readiness, alternative fuels, and policy), which carry the remaining 20 per cent. Clusters then fall into four categories, with low-cost, high-readiness clusters best placed to accelerate their transition to low-carbon steel production
It lays out a phased roadmap. The first step is to put ecosystem enablers in place: raising policy literacy among SMEs through platforms such as Udyam and industry associations, standardised and publicly available emissions disclosure by DRI units, and cluster-level accelerators with designated sustainability champions. Lever-based policies follow, including pooled procurement of waste-heat recovery systems, adding standalone pellet plants under the carbon market, easier renewable-energy procurement (such as behind-the-meter, peer-to-peer, and group-captive models), improved access to affordable natural gas and green hydrogen, and expanded access to green finance through institutions such as SIDBI. The roadmap also recommends demonstration projects and pilot programmes, particularly for CCUS, before scaling wider deployment. Finally, cluster-specific recommendations address local constraints, including improving access to natural gas, green hydrogen, and finance; enabling local sale of surplus waste-heat-recovery power; expanding pelletisation capacity; and supporting standalone DRI units through targeted institutional and policy interventions
Unlocking the Potential for a Gas-Based Economy in India
How Secure is India’s Energy Future?
CO₂ Pipeline Network for Carbon Capture and Storage in India
Bharat Cleantech Manufacturing Platform: Green Hydrogen Indigenisation Pathways
How Will India’s Vehicle Ownership Grow?