Report
An Analysis of the Trends of GHG Emissions in India 2007-2012
GHG Platform India
November 2016 | Industrial Sustainability
Suggested citation: GHG Platform India. 2016. An Analysis of the Trends of GHG Emissions in India 2007-2012. New Delhi: GHG Platform India.
Overview
This study analyses the trends of Greenhouse Gas (GHG) emissions estimation sector-wise for the period between 2007 and 2012. The GHGs covered in this study include Carbon dioxide (CO2), Methane (CH4) and Nitrous Dioxide (N2O). It estimates and assesses GHG emissions and removals from the key sectors such as energy, industry, agriculture, waste, forestry, and land use. In addition, the study elaborates on the policy interventions important to mitigate the impacts of GHGs.
Key Findings
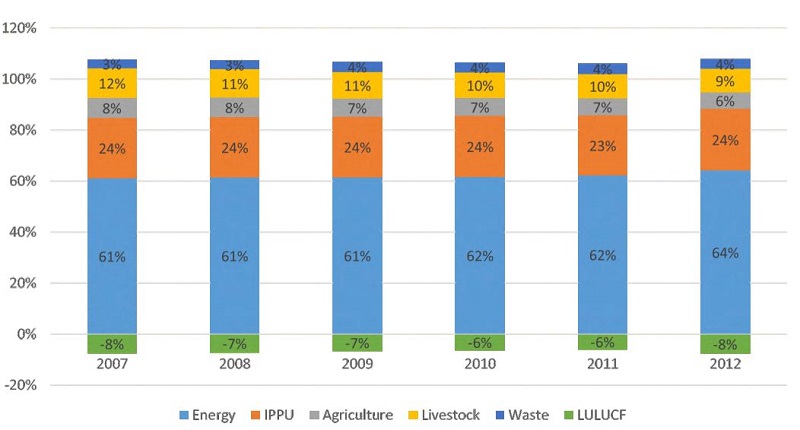
- The sector-wise breakdown of emissions was as follows: 64 per cent for energy, 24 per cent for industry, 8 per cent for agriculture, forestry and other land use (AFOLU) and 4 per cent for waste.
- Emissions increased from 1802.24 MtCO2e in 2007 to 2297.32 MtCO2e in 2012.
Trend for Economy-wide Emissions 2007-2012
Sector-wise GHG emission
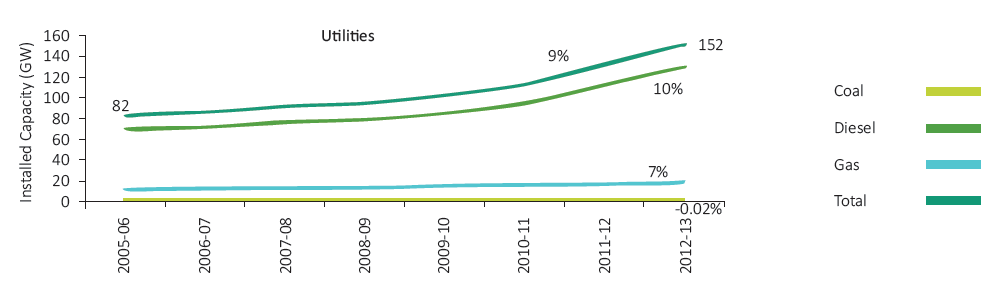
Energy sector
- Electricity generation is the single largest emitter in India’s emission portfolio, contributing 42 per cent in 2007 and 44 per cent in 2010.
- The annual emission growth rates from utility and captive power plants were 6.35 per cent and 10.37 per cent respectively.
- Of the total transport energy consumption, road transport consumed 88 per cent followed by railways at 3 per cent, aviation at 7 per cent and navigation at 1 per cent in 2012.
- The energy usage in the agricultural sector is mainly due to the diesel consumption in irrigation pumps, tractors, and other implements.
- The overall emission from the residential sector increased by less than 1 per cent annually during 2007-2012.
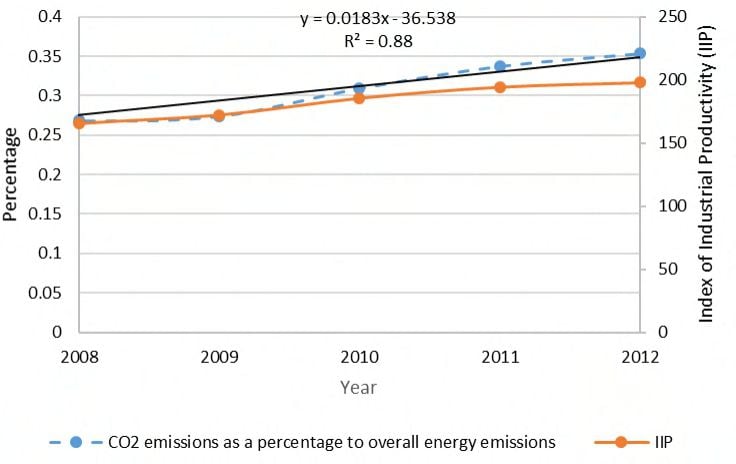
Industrial sector
- Emission from coal contributed over 80 per cent of the overall emissions from fuel consumption.
- India’s overall industrial emissions increased at a compound annual growth rate (CAGR) of 4 per cent from 2007-2012, with iron & steel and non-metallic minerals (both heavy coal-dependent) contributing about one-third each.
- Decreasing emissions intensity is already the norm in the industrial sector. Energy savings worth 8.67 MTOE, translating to a reduction of 31 million tonnes of CO2 emissions was achieved during 2012-2015.
- Overall 80 per cent of total fuel use emissions can be attributed to industrial sectors with iron and steel and non-metallic sectors being the source of emissions.
Percentage of CO2 Emissions of Overall Industrial Energy Consumption
Agriculture, forestry and other land use (AFOLU) sector
- The AFLOU sector’s share of emissions dropped from 12 per cent in 2007 to 8 per cent in 2012.
- Withing the sector, livestock contributed 12 to 9 per cent to emissions from 2007 to 2012, followed by 6 to 8 per cent from the farming sector and 8 per cent from land use, land-use change and forestry.
Contribution of AFOLU Sector Emissions to India’s Emissions
- Emissions from the farm sector are primarily methane and nitrous oxide.
- India’s forests have been acting as valuable carbon sinks and absorbed around 8 per cent of its emissions between 2007 and 2012.
- Emissions from rice cultivation can be controlled through alternative water waste management of rice farms through the adoption of techniques such as direct-seeding of rice (DSR) and the system of rice intensification (SRI).
Waste Sector
- The waste sector saw a minor increase in the share of total emissions from 3.3 per cent in 2007 to 4 per cent in 2012.
- Municipal solid waste (62 per cent), domestic wastewater (22 per cent) and industrial wastewater (12 per cent) are the key sources of GHG emission in the sector.
- Wastewater from domestic, commercial and industrial sources generates CH4 emissions while treated.
- During 2012, wastewater was directly discharged without treatment to open low lands, ponds and nearby rivers by nearly 67 per cent households in rural areas and 18.5 per cent of the households in urban areas.
Key Recommendations
- Ensure significant factors for reducing emissions from the energy sector such as renewable energy addition, smart grid deployment, improvement in technologies, fuel efficiency and alternative fuel use.
- Improve the quality of existing forests, along with adding to the existing forest cover.
- Install sector-based mitigation efforts such as boosting the productivity of indigenous cattle while the AFOLU sector needs to pursue reducing flock sizes.
- Improved waste segregation, infrastructure development, suitable operation of technologies, shifting to anaerobic processes for wastewater treatment are all essential for reducing emissions in the waste sector.
- Make efforts to further promote the establishment and technology upgradation in various key sectors. This may cater to small scale industries and facilitate sharing the financial burden of expensive wastewater treatment.
In 2012, the energy sector was the largest contributor to GHG emissions in India amounting to 60 per cent of the total GHG emissions.