

Suggested Citation: Kamboj, Puneet, Ankur Malyan, Harsimran Kaur, Himani Jain and Vaibhav Chaturvedi. 2022. India Transport Energy Outlook. New Delhi: Council on Energy, Environment and Water
This study examines what India’s transport energy use and associated carbon emissions will look like in a business-as-usual (BAU) scenario over the next 30 years. It indicates that India’s transport sector will witness deep structural changes, driven by market forces, in the next couple of decades. Further, it highlights challenges that will arise in decarbonising transport and underlines the role of policymaking in avoiding the pitfalls of unsustainable mobility behaviours driven by higher disposable incomes.
The transport sector is a significant contributor to the global energy demand and associated emissions. Countries worldwide have been devising strategies to mitigate emissions from this sector. In India, although the transport sector accounts for less than a fifth of India’s final energy use and almost 11 per cent of India’s energy sector related carbon dioxide emissions, its emissions are growing at a faster rate compared to other sectors. As India’s economic growth accelerates, emissions from this sector are expected to grow at an even faster pace.
India’s transportation services are crucial to its future growth, given its close linkage to infrastructure development and manufacturing. Hence, to continue its developmental trajectory while balancing its climate goals, India needs policies that emphasise a sustainable and low-carbon transport sector.
This transport sector outlook reveals the following insights:
Specifically, as per our assessment, policymakers need to be aware of the following challenges and prepare well in advance to address them effectively:
India is one of the world’s fastest-growing economies and is home to around 1.4 billion people. With an average economic growth rate of 7 per cent in the last 20 years (Chakraborty 2021), the need to transport goods and people to meet the compounding demands of its vast population is also growing exponentially (NITI Aayog, RMI and RMI India 2021). The transport sector accounts for about 50 per cent of the oil demand in India (IEA 2021). Transport accounts for a significant share of the total energy in demand in India, with only three other countries dedicating a larger share of their energy to transport – the US, China, and Russia (IEA 2016). While the growth of transport energy demand in the US, China, and Russia is declining, India’s transport demand is set to increase, given that it is currently a growing economy with a low per capita energy consumption for transport (IEA 2021). The demand for transport will continue to grow in parallel with accelerating economic growth, making the transport sector in India critical from an energy use and decarbonisation perspective. Technology choices and policy decisions made today will decide the energy use and carbon emissions from this sector in the decades to come. The objective of India Transport Energy Outlook is to understand what India’s transport energy use and associated carbon emissions will look like in a business-as-usual (BAU) scenario over the next 30 years
In recent years, India’s motorised passenger travel demand has mostly been fulfilled by road, rail and a small share by air travel1 . Passenger travel by water, which is the least-used mode (almost negligible) is limited to a few coastal states (Nag 2021). Indians primarily use two-wheelers and four-wheelers as personal vehicles to meet their mobility requirements.
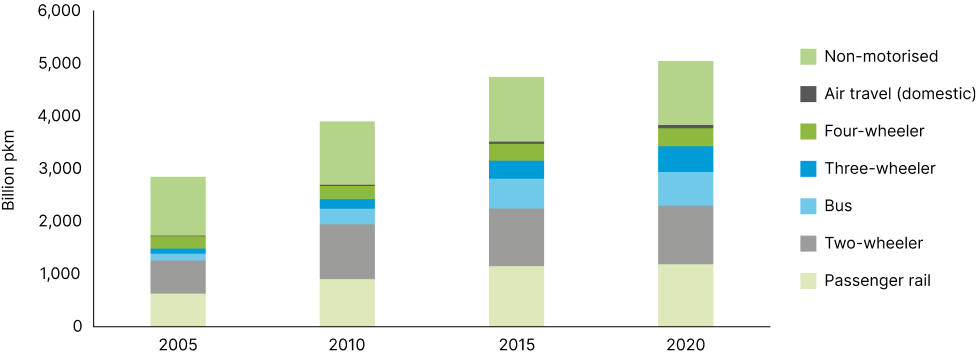
With rising income levels, the vehicle fleet in India has seen significant growth, driven by the rapid increase in the number of two-wheelers (Anup and Yang 2020). India’s total motorised passenger activity increased from roughly 1,700 billion passenger-kilometres2 (pkm) in 2005 to 3,833 billion pkm in 2020. Apart from motorised travel, a significant portion of mobility needs in India is met by non-motorised modes of transport (walking and cycling). The demand for non-motorised modes is far below its potential due to the lack of support infrastructure (Kaur and Ghosh 2021), although it is noticeably higher than in other developed countries (ITF 2021).
Figure 1 A significant portion of passenger mobility needs in India is met by non-motorised modes of transport
Source: Authors’ analysis based on GCAM-CEEW.
Note: The passenger activity for various modes is estimated based on CEEW’s assumptions for load factors, annual vehicle kilometres, and survival curve assumptions for vehicle stock on the road (Soman et al. 2020). LDV_4W, LDV_2W and LDV_3W refer to motorised four-wheelers, two-wheelers, and three-wheelers.
Indian Railways (IR) is the most used mode of passenger transport by Indians, especially for longdistance travel. Its vast network stretching 67,956 km connects the length and breadth of the country (Railway Board 2020). This extensive railway system carries the most number of passengers among railway systems globally (UIC 2020). In the last decade, the railways accounted for around 30 per cent of the motorised passenger travel demand (Figure 1). For a sizeable Indian population, the railways remain the most affordable mode of transportation as passenger fares are cross-subsidised by overcharging freight traffic (Kamboj and Tongia 2018). However, the share of railways in overall motorised modes fell from 36 per cent in 2005 to 31 per cent in 2020, largely due to the increasing share of personal modes of travel.
Two-wheelers are the preferred mode of personal transport for the majority of the population. India is one of the biggest and fastest-growing markets for two-wheelers (Doval 2017; Anup and Yang 2020). For many households in India, a two-wheeler is the primary mode of personal mobility. One of the dominant factors for the rise of two-wheelers in the Indian vehicle stock is their high fuel economy (Bansal et al. 2021). Many Indian cities are highly congested, making two-wheelers the preferred mode of travel to avoid getting stuck in traffic (Jha 2020). Two-wheelers are more popular in tier-1 and tier-2 cities compared to metropolitan cities, particularly due to the lack of adequate public transport (Soman et al. 2019). The booming e-commerce industry in India has also contributed to the increase due to the use of twowheelers to make last-mile deliveries.
Intermediate public transport (IPT), which mainly comprises three-wheelers and e-rickshaws, is an essential mode of urban travel. IPT plays a significant role in providing transport services in smaller towns and as feeder modes in larger cities that lack adequate public transport infrastructure (Gadepalli 2016). In India, three-wheelers are mainly used as a shared mobility service and support the insufficient public transport infrastructure in Indian cities (IEA 2021). Buses are also widely used by large sections of the population, mainly for intercity travel, and limited intracity services in a few cities. In 2020, three-wheelers and buses (public and private) contributed to 13 per cent and 17 per cent of motorised passenger activity, respectively
Four-wheelers contributed to roughly 9 per cent of the total passenger traffic in 2020. The low share of fourwheelers in the overall passenger movement is due to low ownership rates compared to developed countries (ITF 2021). However, with rising income levels, the share of four-wheelers is rising exponentially in the Indian vehicle stock (MoRTH 2017). The growing market for app-based on-demand mobility services has also contributed to the rising number of four-wheelers in India (ITF 2021). Domestic aviation accounts for the lowest share in passenger service demand, but it has been growing consistently over the years.
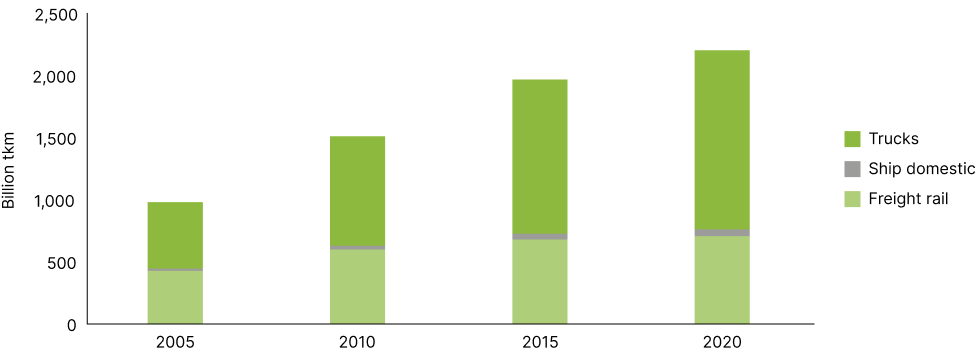
With the rapid growth of the Indian economy, freight activity has increased significantly. The growth in freight demand primarily comes from the road sector. Freight movement in India has doubled to 2,250 billion tonnekilometres3 (tkm) in 2020, compared to 2005 levels. According to the India Transport Report by the National Transport Development Committee, the increase in freight demand has been accompanied by the suboptimal development of the rail–road share (National Transport Development Policy Committee 2014).
Trucks dominate the freight modal share, accounting for 65 per cent of freight movement in 2020. Over the past two decades, India has invested significantly in strengthening road infrastructure by expanding and constructing new national and state highways (IEA 2021). This improved road infrastructure has helped increase the average distance across which commodities are transported by trucks. The Indian trucking fleet, which hauls freight over long distances, is mainly comprised of medium-sized trucks with a gross vehicle weight between 3.5 tonnes–12 tonnes (ITF 2021) resulting in relatively lower tonnes carried for a unit of energy consumed
Figure 2 Trucks dominate India’s freight movement and are growing consistently
Source: Authors’ analysis based on GCAM-CEEW.
IR has consistently lost its share in freight movement to roads due to an inability to add capacity and respond to market needs (National Transport Development Policy Committee 2014). IR carries a significant amount of freight, but its modal share has been declining over the years. Among the many reasons that have led to its declining share, two stand out— the high cost of carrying freight and congestion on the railway network (Kamboj and Tongia 2018). IR overcharges freight services to cross-subsidise passenger services, which makes it the most expensive railway system in the world to carry payload when compared to equivalent railway networks of other countries (Kamboj and Tongia 2018). Also, IR operates both passenger and freight traffic on highly congested and over-utilised shared tracks, where passenger traffic is always prioritised. This prioritisation policy has resulted in very long turn-around times for railway rake with no guarantee on delivery times. IR’s commodity basket is limited to a few bulk commodities, e.g., out of the total revenue-earning freight carried by it, around 45 per cent is attributed to coal (Kamboj and Tongia 2018). This high dependence on limited commodities for its revenue and inability to expand its commodity basket has resulted in a loss of business opportunities (National Transport Development Policy Committee 2014). Domestic shipping, which includes coastal shipping and inland waterways, remains highly underdeveloped and accounts for a negligible share in overall freight movement.
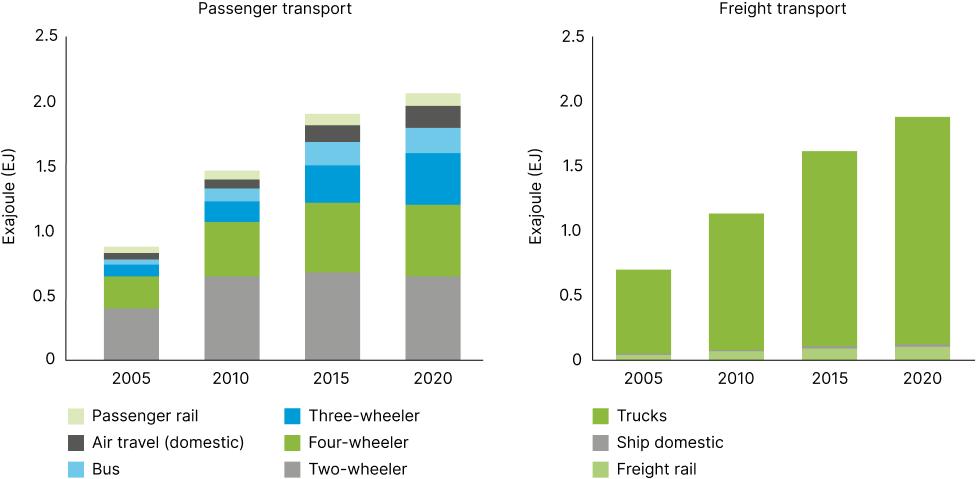
The transport sector has been a significant consumer of energy in India, especially oil. In 2020, the transport sector consumed around 4 EJ of energy, which was 19 per cent of the final energy consumed by India.4 While overall the transport sector accounts for a relatively small share in India’s final energy consumption, it accounted for just about 50 per cent (IEA 2020) of India’s oil consumption.
Figure 3 Energy consumed by various modes of passenger and freight transport from 2005 to 2020
Source: Authors’ analysis based on GCAM-CEEW.
In 2020, two-wheelers consumed 31 per cent of the total passenger energy, more than any other mode. Buses and three-wheelers combined consumed 29 per cent of the total passenger transport energy. Four-wheelers accounted for 27 per cent of the total passenger energy despite having a lower share in the total passenger transport activity due to the low fuel efficiency of four-wheelers compared to other modes per passenger. Domestic aviation was also an energyintensive mode, where a 2 per cent share in passenger activity contributed to an 8 per cent share in total energy consumption.
The railways is the most energy-efficient mode for both passenger and freight transport. IR contributes to around 30 per cent of passenger and freight activities individually but consumes only 5 per cent of the total energy consumed by each transport service. The relatively higher share of the electrified rail network in India makes IR more energy-efficient than the rail systems in other countries. Recently, IR announced that it will electrify 100 per cent of its network by 2023, which will make it the most energy-efficient railway network in the world (Ministry of Railways 2020).
Trucks account for the largest share of energy consumption in freight transport. Between 2005 and 2020, the energy consumed by trucks grew faster than their respective share in freight activity. The gap in growth rates is mainly due to the low fuel efficiency of Indian trucking fleets. India’s slow progress in implementing stringent fuel efficiency standards, especially for heavy-duty vehicles, has also contributed to this gap (Garg and Sharpe 2017). The Indian trucking fleet is characterised by individually owned, mediumsized diesel trucks with lower fuel efficiencies compared to those in other developed countries. Another characteristic that defines the Indian vehicle fleet, especially trucks, is the high share of used vehicles. India has a booming secondary market for used vehicles. Often, trucks that have already been used for several years and are depreciated are sold in the used vehicles’ market at a significantly lower price. These vehicles are then again used for many years, mainly for short intracity trips, despite their abysmal fuel efficiency and emissions, before they are finally retired.
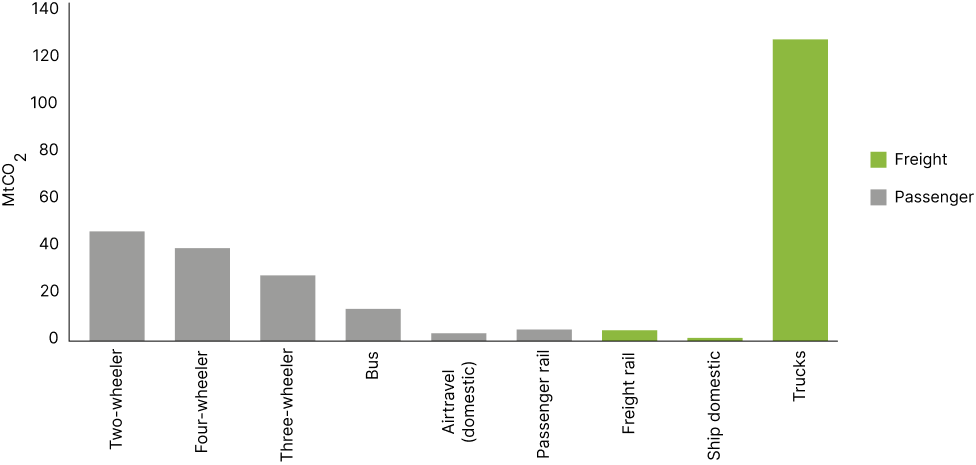
The emissions produced by the transport sector reflect the energy used by various modes of both passenger and freight transport. In 2020, direct emissions (tailpipe emissions) by the transport sector (excluding international aviation and international shipping) stood at 272 million tonnes of CO2 (MtCO2 ). The road sector, including passenger and freight, dominate transport emissions, accounting for a share of more than 92 per cent. It also significantly contributes to India’s air pollution problem. Emissions produced by road transport are growing faster than in any other sector and are expected to be a significant challenge to decarbonising India’s energy sector.
Figure 4 Carbon emissions produced by the transport sector in 2020
Source: Authors’ analysis based on GCAM-CEEW.
Our outlook provides insights into what India’s transport sector might look like in the next few decades. In this section, we will highlight the key characteristics of the future growth of India’s transport sector. Our analysis assumes that market forces will continue to impact the evolution of both passenger and freight transport in the absence of a dedicated policy push to promote any particular mode or technology. We also assume that the cost of oil and gas-based internal combustion engines (ICE) across all modes will follow historical trends. A crucial assumption of the BAU scenario is that the cost of electric vehicles across all modes of transport will continue to decline. We have assumed that by 2030, electric four-wheelers will reach cost parity with the ICE in terms of capital cost. For other modes, the rate of decline will differ since the share of battery costs differs for each mode.
The detailed assumptions for the transport sector are discussed in Annexure 1 of the document. The following are the key insights from our assessment.
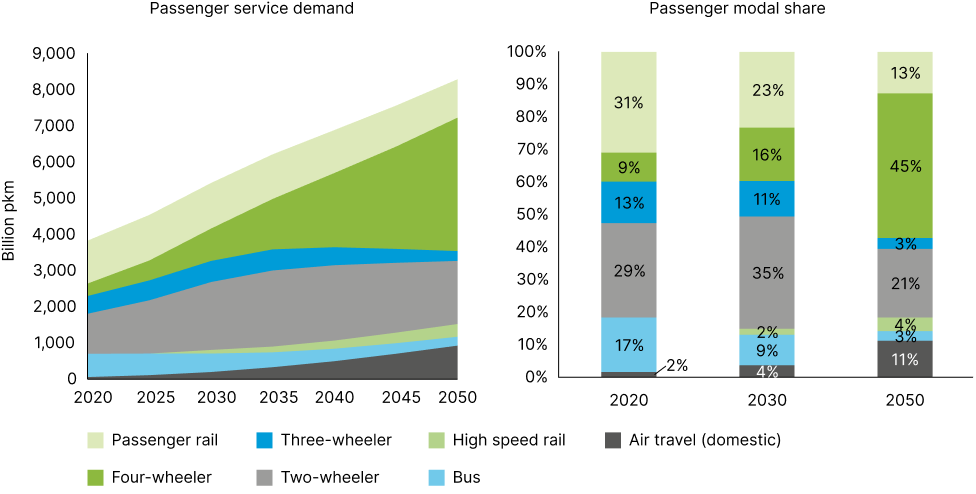
A growing economy and rapid urbanisation have increased the mobility needs of a relatively young and ambitious population (Kapoor and Sinha 2020). Our outlook for passenger travel highlights that the demand for motorised transport will double in the next three decades from nearly 4,000 billion pkms in 2020 to more than 8,000 billion pkms (Figure 5). However, there will be a substantial change in the modal share of motorised passenger transport.
Figure 5 Four-wheelers will drive the demand for passenger transport in the future
Source: Authors’ analysis based on GCAM-CEEW.
Historically, the railways and two-wheelers have dominated India’s passenger demand (Figure 1), but this may not be the case in the future. We estimate that with rising income levels, four-wheelers will drive passenger service demand in the next three decades. The modal share of four-wheelers in motorised passenger service will increase from 9 per cent in 2020 to a staggering 45 per cent in 2050, mainly driven by the desire to own a personal four-wheeler with increasing income levels as well as the growth of on-demand mobility services (such as Ola and Uber). This enormous gain, from 2 per cent in 2020 to 11 per cent in 2050, in the modal share of four-wheelers comes at the cost of the reduced shares of other modes like two-wheelers and public transport. There will be a substantial reduction in the percentage share of public transport modes such as the railways, buses, and threewheelers. The increasing number of four-wheelers and reduced share of mass transportation will significantly impact the future of India’s transport sector from an energy use and emissions point of view as well as drive up congestion and infrastructure requirements.
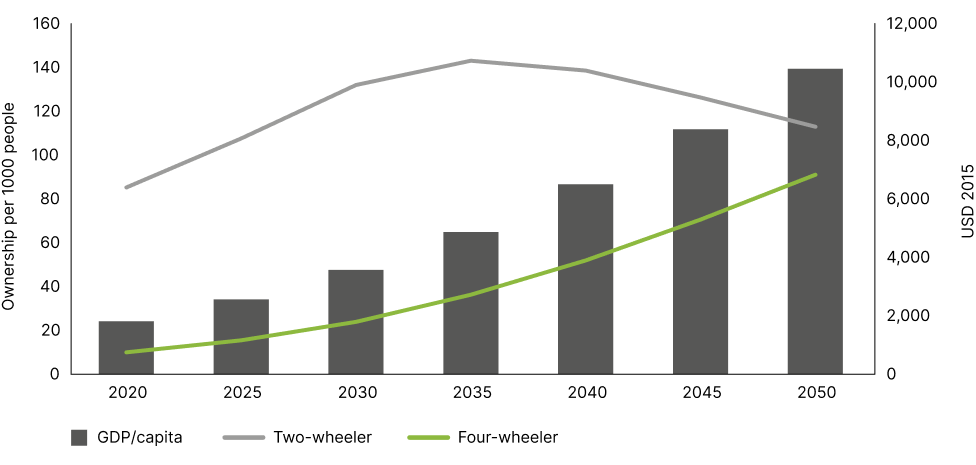
Two-wheelers will remain a significant mode of travel. While its modal share will peak initially, the segment will eventually see a decline. We predict that the two-wheeler service demand will peak around 2040 and then decline. Other countries, like China, have observed the peaking of two-wheeler ownership rates5 at similar GDP per capita levels that India will achieve in 2035 (ITF 2015). Figure 6 shows the estimated ownership rates of two-wheelers and four-wheelers in India. According to these estimates, the ownership rate of two-wheelers will peak around per capita income levels of 2015 USD 5000 while the ownership rate for four-wheelers will see a continuously increasing trend.
Figure 6 The ownership rate for two-wheelers will peak around GDP per capita of 2015 USD 5000 while the ownership rate for four-wheelers will substantially increase
Source: Authors’ calculations.
Note: The ownership rates for the future are estimated using the model output of future service demand, which incorporates the survival curves for both technologies. We have assumed that the load factors and annual vehicle kilometre (VKM) for two-wheelers and four-wheelers will remain constant in the future, but this may not necessarily be the case. We have considered a load factor of 1.5 and an annual VKM of 6,300 kilometres for two-wheelers, a load factor of 2.14 and an annual VKM of 11,560 kilometres for four-wheelers (Soman et al. 2020).
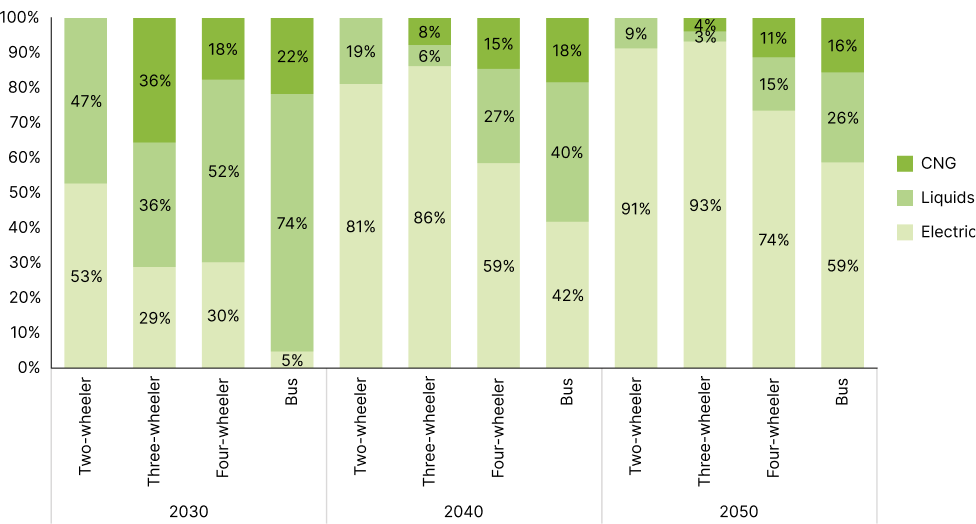
Our assessment emphasises the importance of creating the charging infrastructure and support ecosystem required for electric vehicles across the country rapidly to take full advantage of the declining cost. As per our estimates, with dedicated efforts in the right direction, by starting in the first decade till 2030 and increasing the pace for the next 20 years, we can achieve a high share of electric vehicles across all vehicle categories. Our outlook highlights that around one-third of the four-wheelers and half of the two-wheelers sold in 2030 could be electric, and that this share could increase up to 75 per cent and 90 per cent, respectively, by 2050. We foresee a relatively slower uptake of electric buses in the first decade due to high upfront capital costs and charging infrastructure requirements. Increasing the uptake of electric buses will require a focused policy effort to increase the share of buses in public transport, which could address the challenge of high upfront costs. Measures such as demand aggregation, or other interventions that seek to reduce the upfront cost borne by states and municipalities, will be critical for the electrification of this segment.
Figure 7 Electric vehicles will significantly gain share in new vehicles, especially in the two and three-wheeler segment
Source: Authors’ estimates
Note: The uptake of electric vehicles across different modes is contingent on our assumptions that their price decline will continue in the future and that the rate of decrease will vary by mode as the share of battery cost varies across modes. We also assume that all the non-economic barriers, such as the availability of electric vehicles, charging stations, and other required infrastructure, will disappear by 2050.
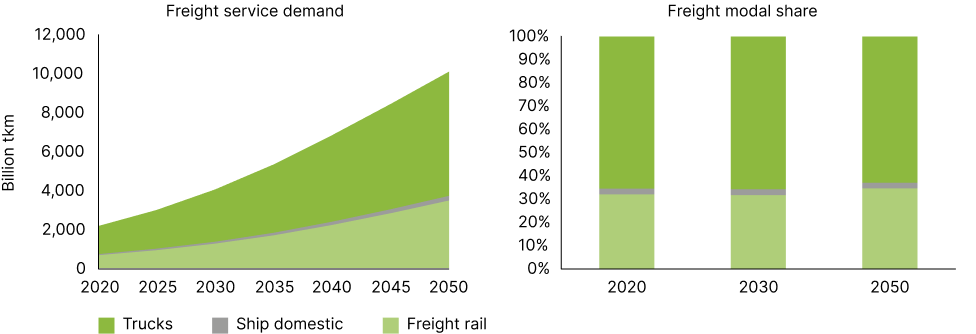
Economic development fuels the growth of freight transport and associated logistical services. India’s future economic growth will involve significant infrastructure development, which will require the expansion of its freight transport activities. Our outlook for freight transport shows that freight service demand will grow five times from nearly 2,000 billion tkm in 2020 to more than 10,000 billion tkm by 2050. However, unlike passenger transport, we do not estimate any significant change in the modal share of freight transport in the future. Although we see that the total freight carried by the railways will continue to increase in absolute terms, we do not see any significant change in the modal share. Trucks will continue to dominate the freight business. We see only a slight uptake in domestic shipping in a BAU scenario.
Figure 8 Freight demand to grow by over five times in the next three decades
Source: Authors’ analysis based on GCAM-CEEW.
Historically, oil dominates the Indian transport sector’s energy use; our outlook shows that this will not be the case in the future. With growing energy demand, the sector’s energy mix will also diversify. The transport energy demand is expected to grow by more than three times from nearly 4 EJ in 2020 to more than 13 EJ in 2050, and the share of oil in the total transport energy consumed will reduce from 95 per cent in 2020 to 66 per cent in 2050. The shift in the fuel mix will come from the increase in the share of natural gas (from 3 per cent to 25 per cent) and electricity (from 2 per cent to 9 per cent). Most of the oil consumption will be by domestic aviation in the passenger segment and trucks in the freight segment.
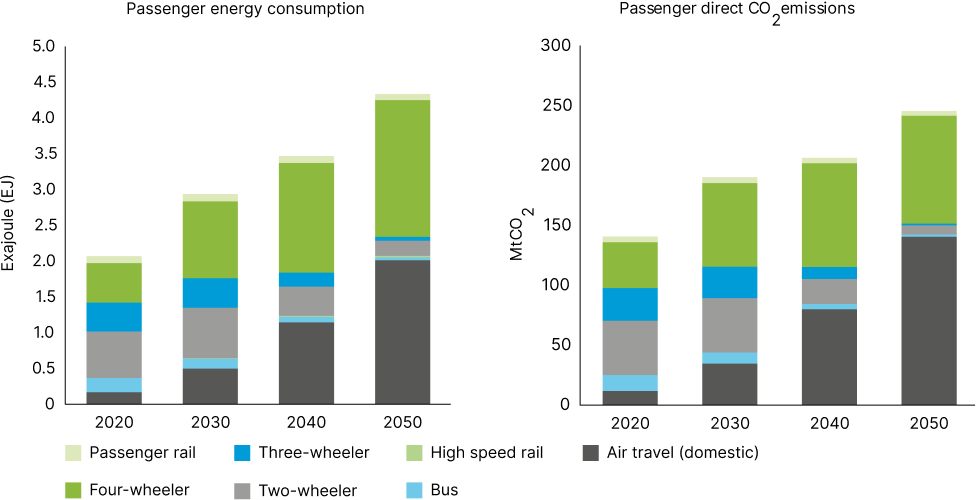
Domestic aviation, a marginal source of emissions in 2020, will become highly critical for the decarbonisation of the Indian transport sector. By 2050, the share of domestic aviation in energy use and emission will grow significantly to almost half of the energy use and an even higher percentage of passenger transport emissions. This is not just because of the high emission intensity of air travel but also due to the zero direct emissions and low energy intensity of the electrified road transport sector, which is expected to expand rapidly in the decades to come. The air travel sector in India has been growing consistently over the years, and this is likely to accelerate with rising income levels. Our outlook highlights that domestic air travel will significantly impact the sector’s energy use and decarbonisation efforts due to the relatively poor fuel efficiencies of air travel compared to other modes of transport.
Figure 9 Fast electrification of passenger transport means that the share of airlines in energy use and emissions will significantly increase by 2050
Source: Authors’ analysis based on GCAM-CEEW.
There is significant potential for limiting and reducing the energy used and emissions produced by the transport sector by electrifying the passenger fleet. Investing in support infrastructure could contribute to reducing a substantial amount of energy use and emissions. As per this study, because of rapid electrification and the peaking of two-wheeler service demand, the share of CO2 emissions by two-wheelers in passenger transport will decline from 32 per cent in 2020 to just 3 per cent by 2050. The rapid uptake of electric vehicles in the four-wheeler segment will nullify the negative impact of their exponential growth and modal shift away from energy-efficient modes. However, the increasing number of on-road four-wheelers will have significant implications for congestion and infrastructure requirements.
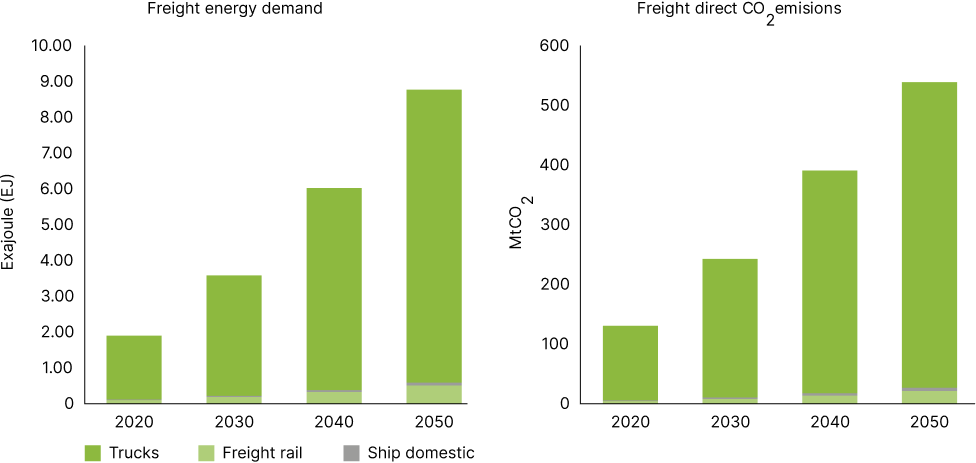
Trucks will continue to dominate energy consumption and CO2 emissions in the freight sector (Figure 10). Emissions from trucks will grow slower than their respective energy consumption due to the increasing share of natural gas and a slight increase in the uptake of electric trucks in the last decade (Figure 11).
Figure 10 Transport energy consumption will be heavily dominated by trucks
Source: Authors’ analysis based on GCAM-CEEW.
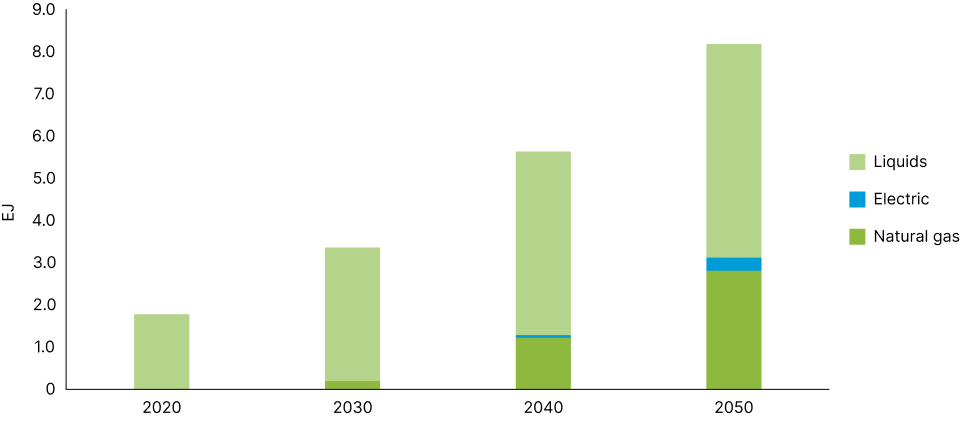
Even with low gas prices, we do not expect any immediate increase in the share of natural gas in trucks’ fuel mix due to infrastructure bottlenecks. It will take a decade to build the required pipelines and infrastructure to see any meaningful gain in the share of natural gas.6 However, in the last two decades, natural gas will gain a significant percentage of the trucking fuel mix. By 2050, natural gas is expected to account for 35 per of trucks’ fuel mix. We estimate the slow uptake of electric trucks from 2030. The unavailability of equivalent electric trucks, in terms of the required range and upfront cost, remains the key bottleneck.
Figure 11 Liquid fuels and natural gas will become the two primary fuels for the trucks
Source: Authors’ analysis based on GCAM-CEEW.
India’s passenger and freight transport demand is growing at a fast pace with increasing per capita incomes. Along with growth, the sector is witnessing many path-defining changes that will have a significant impact on its evolution. Policymakers need to ensure that this transition, while increasing social welfare, does not impact society and the environment negatively. The sustainability implications of the impending structural changes, hence, have to be understood in a systematic way. Our transport outlook seeks to understand the impact of market forces on the evolution of India’s transport sector and subsequently its energy use and emissions. We highlight the structural shifts that this sector will witness in the next three decades to inform policymakers as well as industry stakeholders. Policy has to intervene in specific niches to support and accelerate this transition while avoiding the pitfalls of unsustainable mobility behaviours driven by higher disposable incomes. We analyse conditions in the BAU scenario and do not explore the impact of a net-zero scenario. However, our results do reveal that pointed efforts, particularly in the freight and aviation sectors, are required to ensure that the transport sector is on course to realise a net-zero future and contributes to the objectives of jobs, growth, and sustainability of the Indian economy.
Tamil Nadu’s Greenhouse Gas Inventory and Pathways for Net-Zero Transition
The Emissions Divide: Inequity Across Countries and Income Classes
Implications of an Emissions Trading Scheme for India’s Net-zero Strategy
Demystifying Carbon Emission Trading System through Simulation Workshops in India