Council on Energy, Environment and Water Integrated | International | Independent
Vaibhav Chaturvedi
March 2015 | Climate Resilience
Suggested Citation: Vaibhav Chaturvedi. 2015. The Costs of Climate Change Impacts for India. New Delhi: Council on Energy, Environment and Water.
This working paper tries to estimate the cost of global climate change impacts for India. It focuses on estimating the first-order costs for loss in agriculture productivity and impact on higher power generation requirement with increasing temperatures, within a long term global integrated assessment modeling framework. It also attempts to put a value on the health impacts from temperature rise. This analysis provides a solid basis for informed discussions around this issue in India, and for more detailed and insightful studies on the costs of climate impacts for India. Further, it summarised the cost inaction calculated across the sectors focussed in this study.
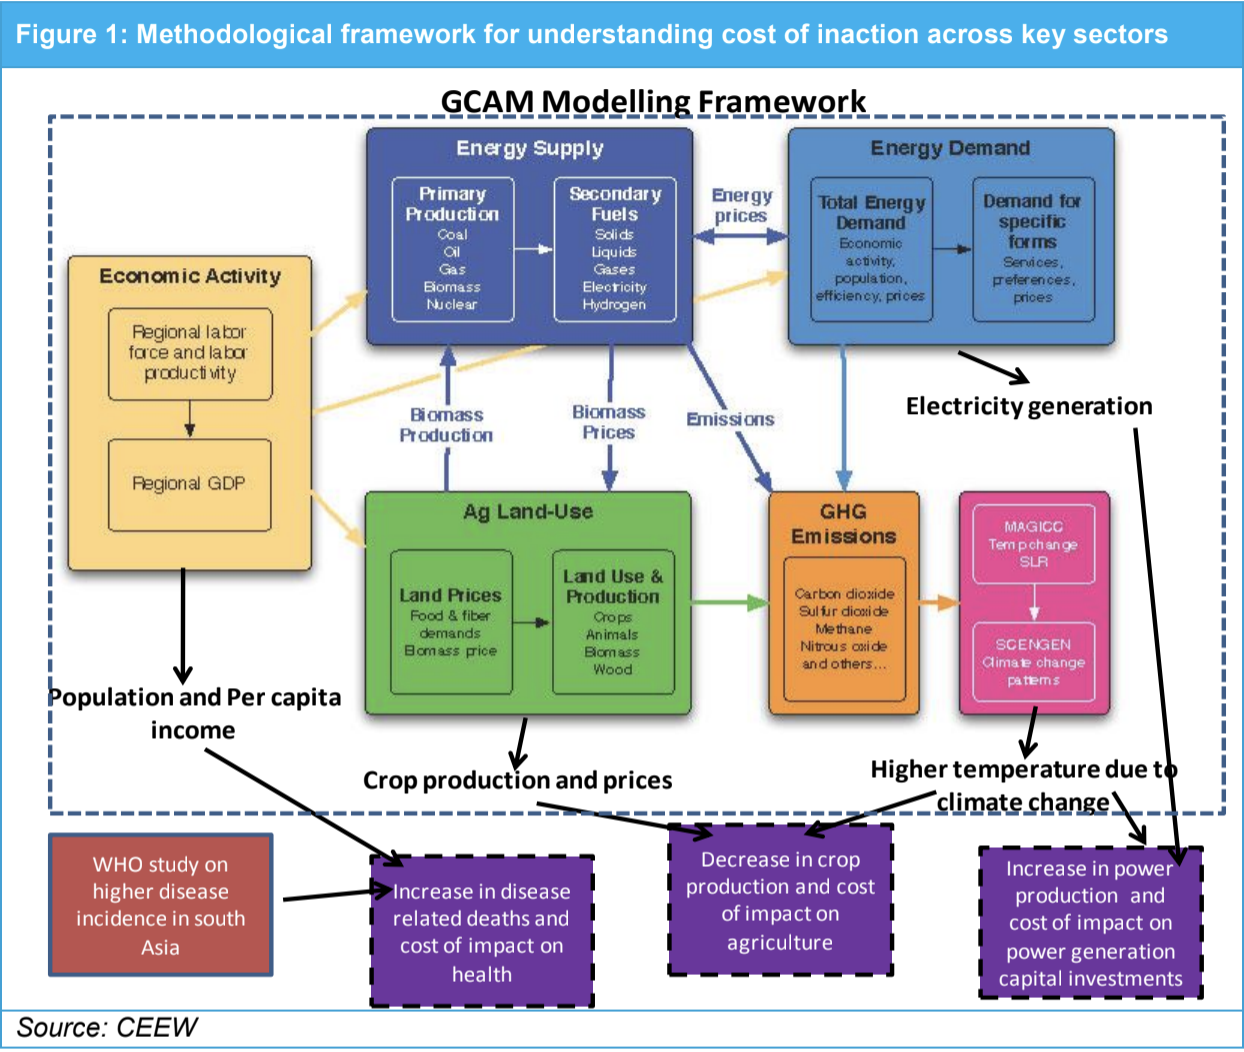
Source: CEEW
For understanding the cost of climate impacts on agriculture and additional power plant generation, output from Global Change Assessment Model (GCAM) is used. GCAM is a global integrated assessment model with a separate agriculture and land use system (Clarke et al., 2008; Calvin et al., 2009; Wise et al., 2009; Shukla and Chaturvedi, 2012; Chaturvedi et al., 2013a; Chaturvedi et al, 2014a). Information on total production of rice, wheat and maize in 2050 is derived based on business as usual (BAU) model run. Literature is reviewed to understand rate of decline in crop productivity due to increase in temperature in 2050 and 2100. On the basis of this information, total crop losses have been identified and valued based on prices in respective years. Details on GCAM's agriculture and land use module can be found in Wise et al. (2009) and Chaturvedi et al. (2013b).
GCAM also models cooling and heating demand based on cooling/heating degree days and a host of other factors. This modelling analysis will give information on whether increased energy demand for cooling will imply a significant cost for India or not for additional power generation infrastructure. Details of GCAM's building sector module can be found in Chaturvedi et al. (2014b).
Finally health impacts are determined by linking increasing temperatures to increased incidence of diseases and what it means in terms of additional health costs based on literature. WHO has already done a detailed quantified assessment for the world and various regions (WHO, 2014). This analysis borrows results for south Asia from the WHO research and derives India specific health impact numbers based on the south Asian results.
Studies have shown that agriculture production is sensitive to temperature, increasing carbon dioxide concentration as well as change in precipitation. Impacts of all these forces together imply that agriculture production will respond non-linearly to future climate change. The impact however is complex to understand and as per the IPCC categorization, there is only medium confidence on the magnitude or direction of impacts. However, there is high level of agreement across studies that the impact in all probability is going to be negative for most crop categories.
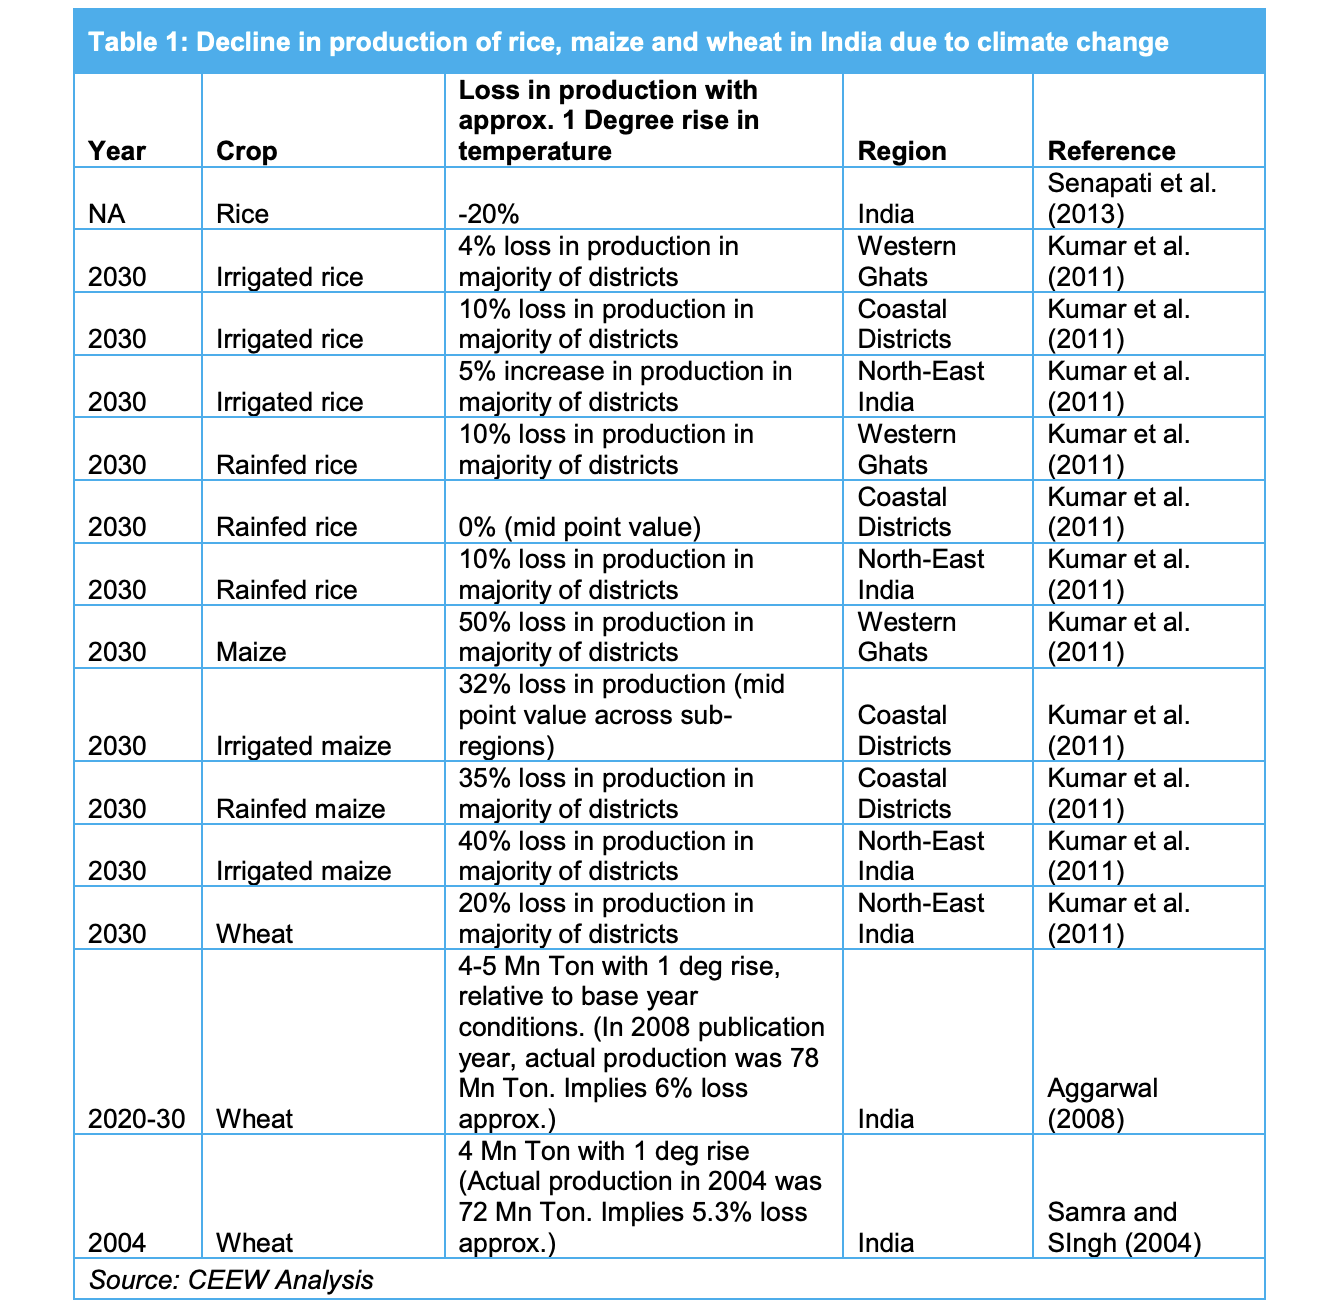
For India, three crop categories are important from the perspective of food security- rice, maize and wheat. Table 1 shows results from few studies that have researched crop production losses for these key crops in India. Based on the numbers in the table, following is the range of yield decreases. We estimate cost for the higher end and lower end of this range, as well as for the mid-point -
Loss in rice production (impact sensitivity) per 1 degree Celsius increase = 4% - 20%
Loss in maize production (impact sensitivity) per 1 degree Celsius increase = 32% - 50%
Loss in wheat production (impact sensitivity) per 1 degree Celsius increase = 5% - 20%
It should be noted that these estimates include not just impacts due to higher temperatures, but also impacts of higher carbon dioxide concentrations in the atmosphere.
Col Ag, Y = {Pdt BAU, Y* (1 - [ 1 - Ims ]Temp
where
CoI is the Cost of Inaction in Million US$
Pdt is Production in Million Tonnes
Temp. is the temperature increase relative to BAU in Degree Celsius
ImS is Impact sensitivity of crop production to increase in temperature in % / Degree Celsius
P is Price in US$/Ton
Ag is the subscript denoting 'Agriculture', Y is the subscript denoting year under analysis and BAU is the subscript denoting 'Business as Usual' which implies a fixed climate.
Crop production, temperature and crop prices are outputs of GCAM. Impact Sensitivity is a crop specific constant derived from literature as highlighted above. It should be noted here that under the BAU also, crop productivity is assumed to increase across the century for all the crops in India. Temperature increase has been taken relative to 2005, which is the model base year. The function in curly brackets represents physical loss of production, which when multiplied by the price gives us the cost of loss in agricultural output. Table 2 shows us the loss in physical production as well as in terms of economic losses.
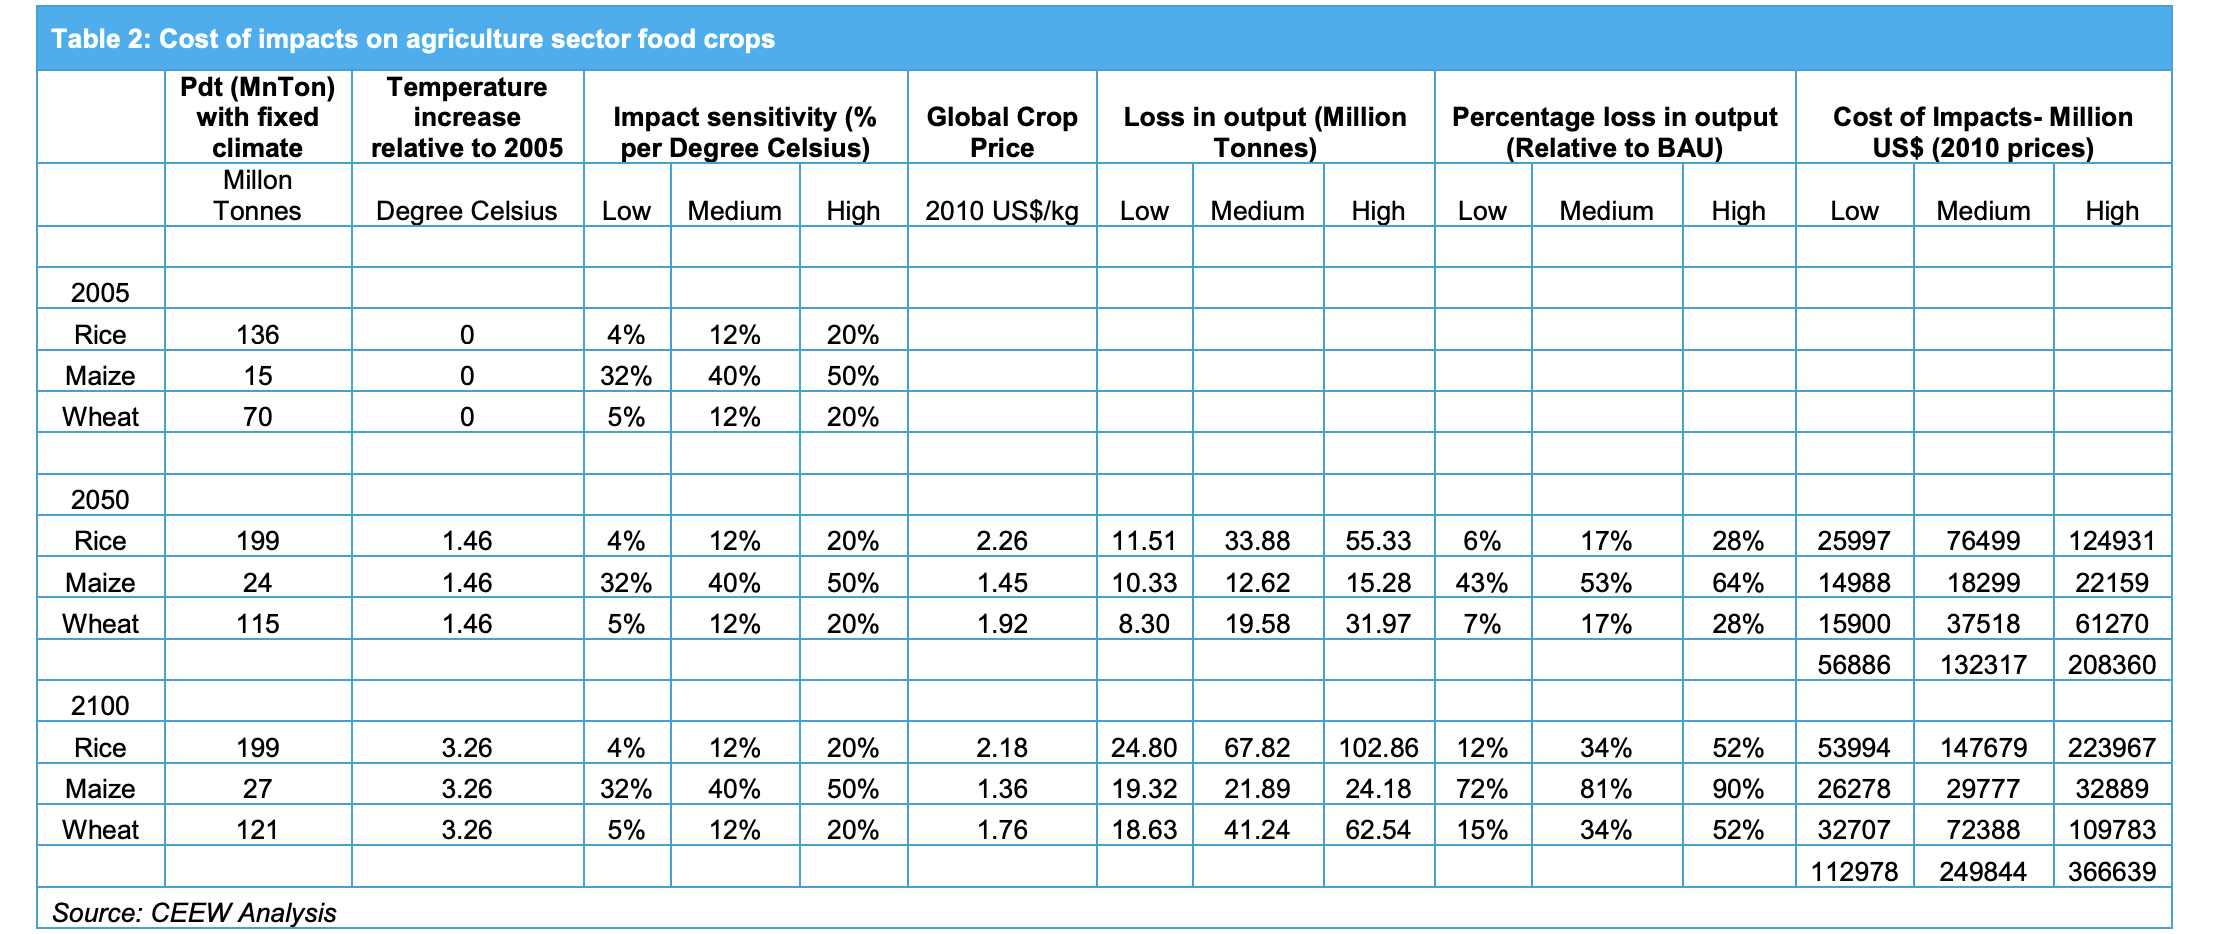
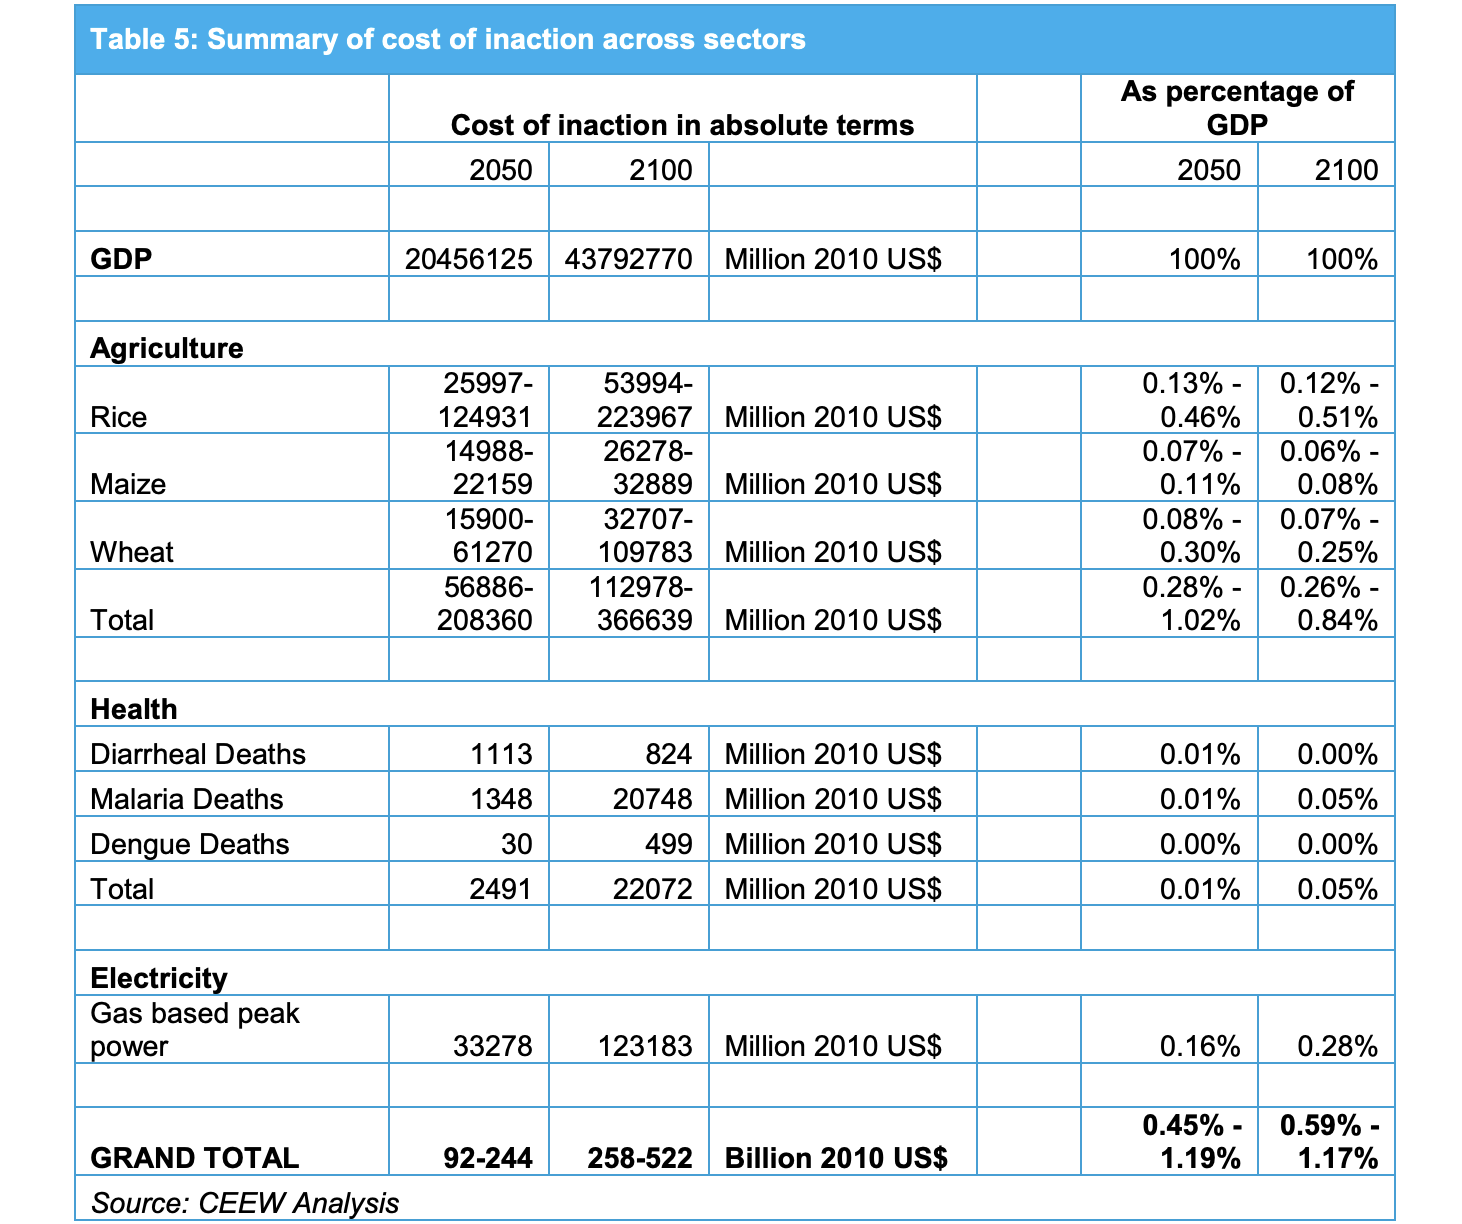
Literature shows that maize is going to impacted most due to temperature increase, followed by rice and wheat. A 3.250C increase in average temperatures by century end relative to 2005 can lead to more than 72%-90% decline in output of maize, 12%-52% decline in rice output and 15%-52% decline in wheat output. The total economic loss is 57-208 Bn US$ in 2050 and 113-367 Bn US$ in 2100. In terms of GDP share, this economic losses from these three crops amount for 0.28% -1.02% in 2050 and 0.26% - 0.84% in 2100.
Diarrheal related child mortality
A recent report by World Health Organization (WHO, 2014) highlights that increasing temperature will increase the rate of spread of Diarrhea related death. The study uses following function to estimate climate attributable Diarrheal deaths.

where n is the climate attributable Diarrheal deaths N is the Diarrheal deaths without any climate change, for reference Δ T is the change in temperature with climate change relative to fixed climate β denotes the sensitivity of Diarrheal death to temperature increase, and is calculated as β = log (1+α), where α is linear increase in Diarrheal death per degree of temperature rise Subscripts c denote s grid cell, y denotes time slice, j represents three different scenarios of temperature anomaly, and i denotes low, medium or high level of diarrheal related deaths.
Malaria related mortality
Malaria is a diseases that has shown drastic decline with time as incomes across countries have risen. However, in low income countries of the world this is still the case. Interestingly in India Malaria related cases were reported to be around 2 Mn in 1990s, though WHO estimated this figure to be 15 Mn (Kumar et al., 2007). WHO (2014) has also estimated that with increasing incomes and no climate impacts, Malaria will be eliminated from all the regions of the world except from Africa by 2050. WHO (2014) uses a regression equation to estimate the impact of increasing temperatures, changing precipitation and increasing income on the risk of population exposed to Malaria.

where T_min is the mean temperature of the coldest month PR_max is the mean precipitation of the wettest month GDP is the GDP per capita i is the subscript for spatial grid location.
Dengue related mortality
Dengue fever is transmitted as a vector diseases. Climate effects Dengue at a high rate in tropical regions as the transmission capacity increases. It is a diseases that has shown drastic decline with time as incomes across countries have risen. As in the case of Malaria, there are many factors that impact the spread of Dengue and hence the impact of climate change is uncertain at best.
WHO (2014) uses a regression equation to estimate the impact of increasing temperatures, changing precipitation and increasing income on the risk of population exposed to Dengue.

where Temperature is the annual mean temperature Precipitation is the annual mean precipitation F is a Spline function GDP is the GDP per capita i is the subscript for spatial grid location.
Cost of climate change induced deaths
WHO (2014) estimates are based on sophisticated modelling at the grid level across various regions of the world. However, results are presented only for south Asia. This study assumes that for 2050, India will face same share of climate induced deaths as is the case for south Asia for all the diseases under analysis. For 2100, we use assumption based on the 2030 and 2050 share of deaths as modelled for south Asia.
For getting from number of deaths to cost of deaths, we have to put a value on life of a person, which is a debatable task. Though we believe that one value cannot be put to any life, we make some assumptions for the purpose of our calculations. The study assumes that any life lost leads to a loss in GDP, equal to income forgone for 50 years of work life. For putting a value of life in 2050, we add per capita income for India from 2005 and 2055, which signifies total income for a person across his or her work life. In other words this is the income forgone when a life is lost. For value of one life in 2100, we use a same approach and per capita income is added from 2050 to 2100. Table 3describes our assumption, calculations, and final result.
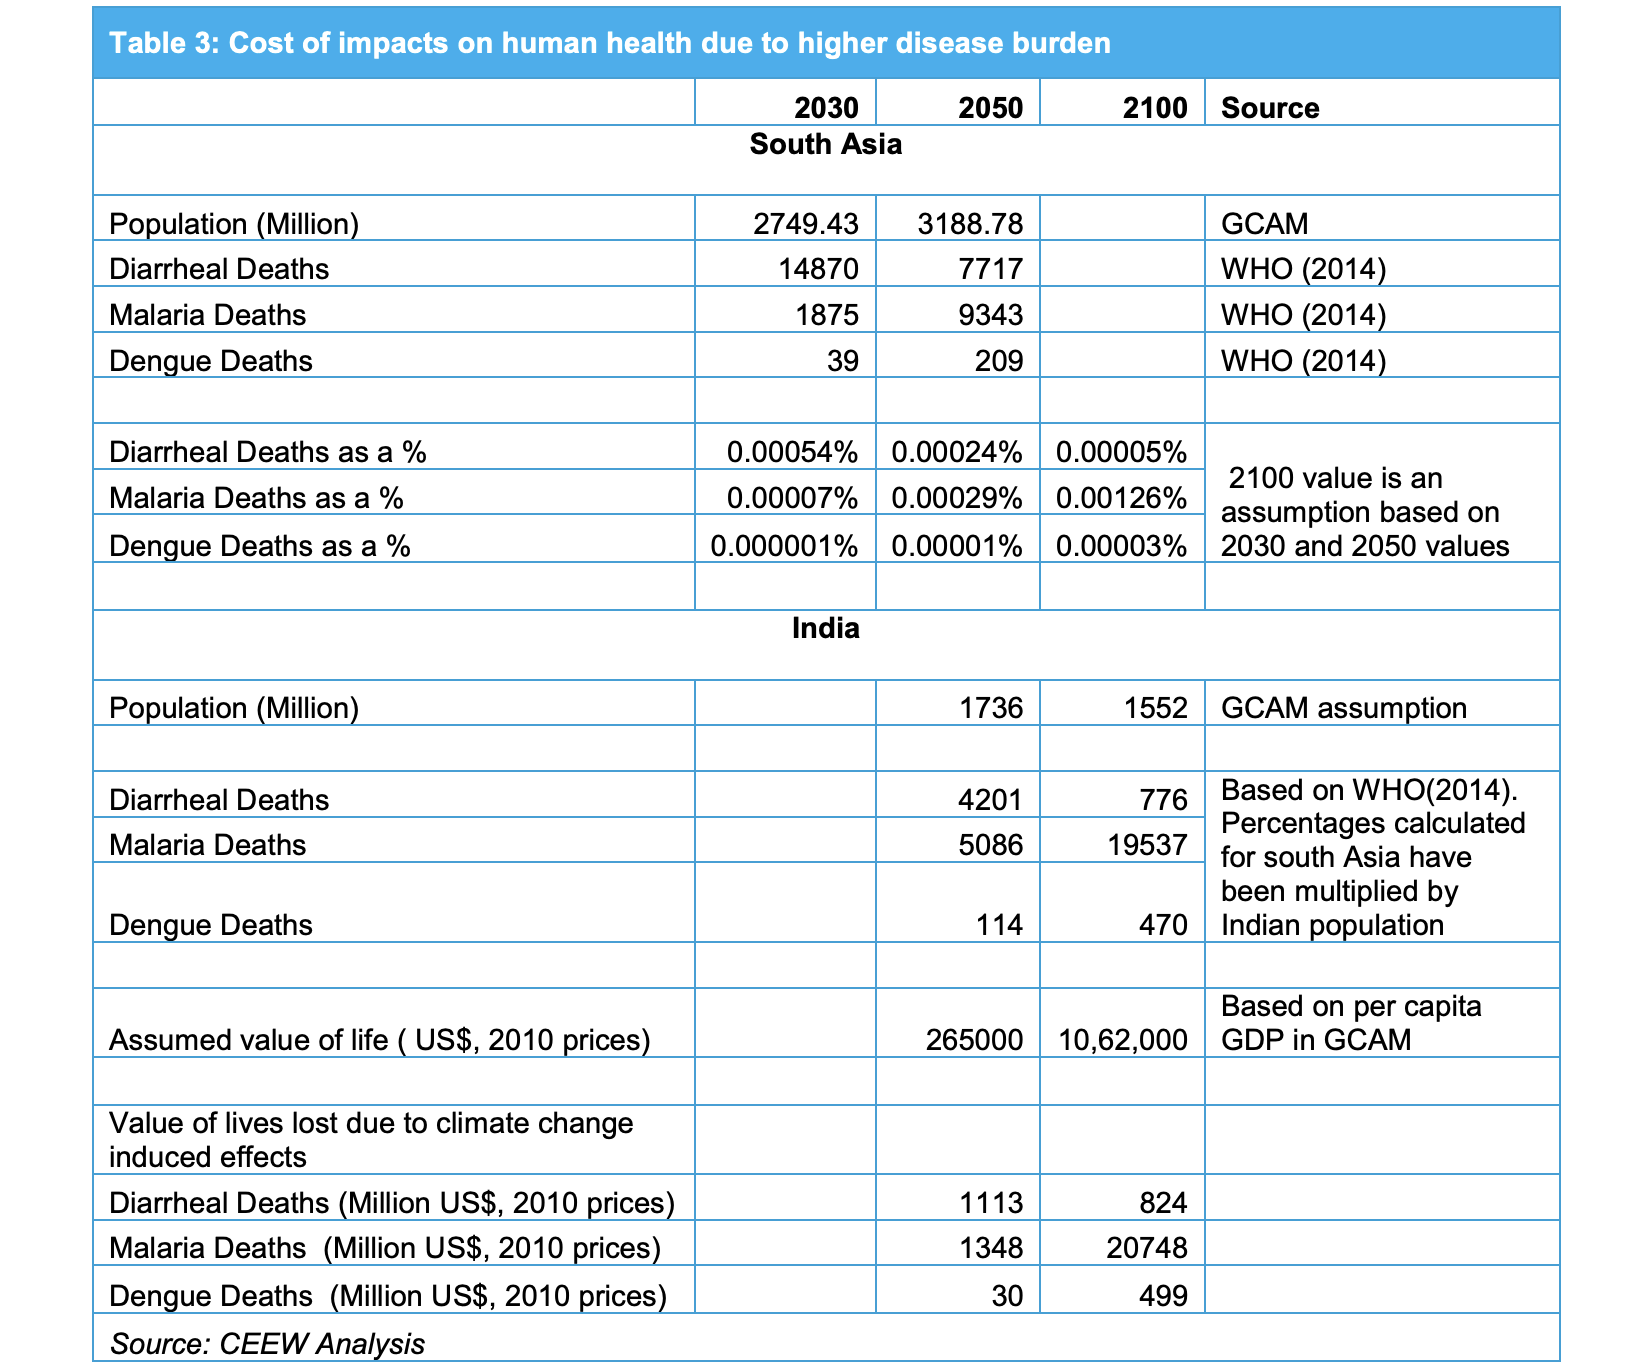
As is evident, the results include the positive impact of rising incomes in India across century. Diarrheal risk should be eliminated by 2050 if there is no climate change impacts. However, climate change does lead to increase in deaths compared to the no climate change scenario. Most importantly, deaths related to Malaria are bound to increase significantly and the resulting loss of economic output is 20.7 Bn US$ in 2100 for Malaria alone.
Climate change induced temperature increase is bound to increase space cooling demand in both residential and commercial sector. GCAM uses a detailed approach including technical and economic factors for modelling space cooling demand (Chaturvedi et al., 2014b). Following functional form is used for modelling cooling service demand -

where dc is the demand for cooling service per unit floorspace in EJ-output/m2 CDD is cooling degree days in hroC which change over time,
η is thermal conductance or building U-value in GJ/m2 hr-1oC -1 ,
r is building floor-to-surface area ratio representing the size of building shell exposed to outdoor temperature,
IG is the amount of building internal gains in GJ/m2 and λC is internal-gain scalar accounting for the potential mismatch of the time when space conditioning is required and the time when the internal gains are produced.
i is per capita income
Pc is the price of cooling service, which is endogenously determined
μc represents the parameter determining speed with which service demand increases in response to change in income and prices towards the satiation level.
The term 'CDD' is what changes between a fixed climate and a changing climate. Fixed climate represents CDD for 2005, while changing climate corresponds to the higher temperature increase, close to 40 C observed by the century end. GCAM does not model peak and base load demand separately and treats all the technologies equally, which can be regarded as a limitation of the model. Hence, in the model, this increased demand for electricity production is distributed between different technologies like coal, gas, nuclear, solar, etc on the basis of relative cost dynamics. However, it is assumed here that all this increase will be for meeting peak energy demand and hence a gas based power plant is most suitable for meeting peak power demand. On the basis of GCAM output as well as capital cost assumptions based on Annual Energy Outlook (AEO, 2013), we calculate the increase in power plant related investment requirements (Table 4).
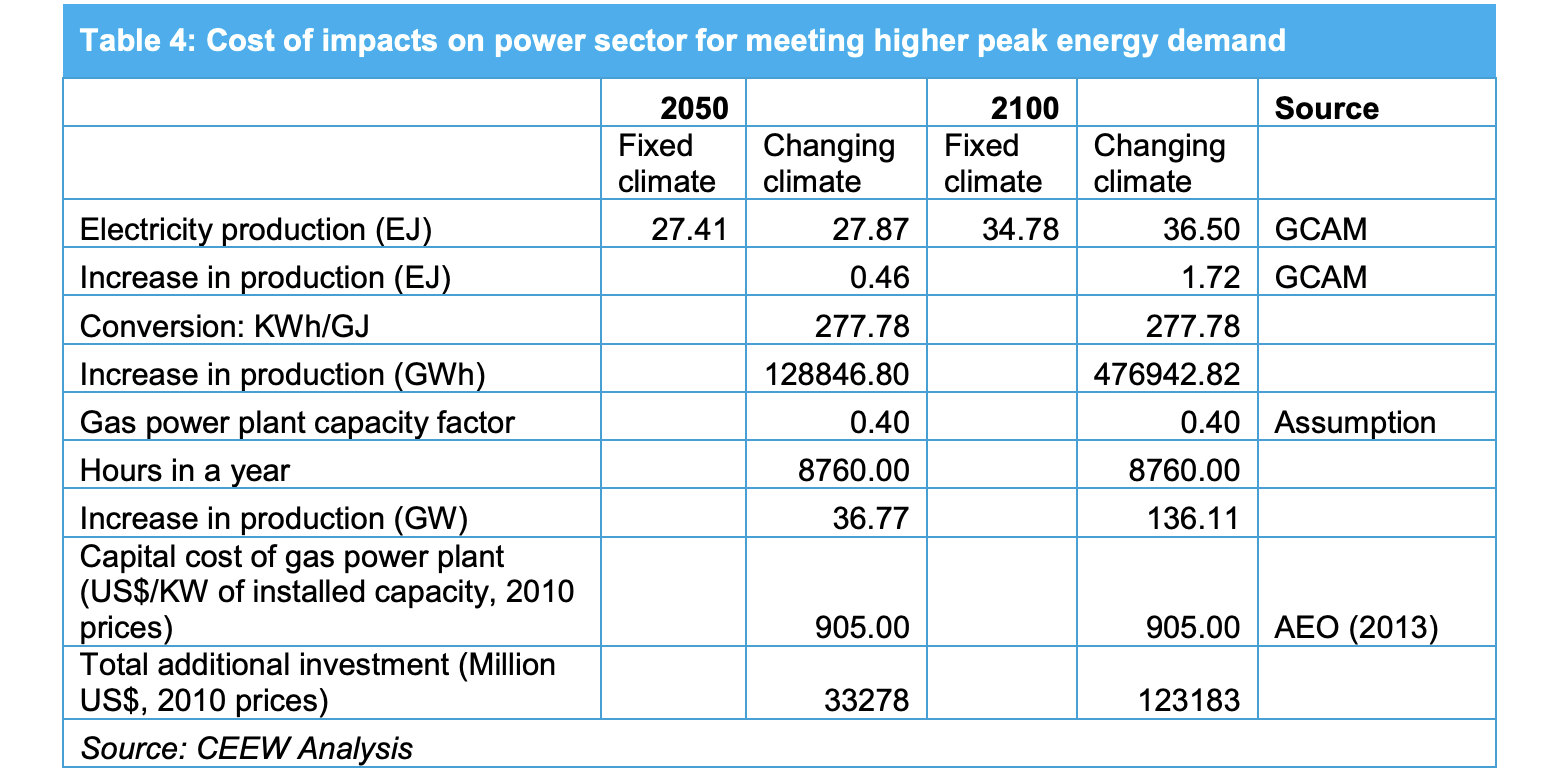
Temperature induced higher peak load and cooling energy demand will lead to additional installed capacity of 36 GW in 2050 and 136 GW in 100. Total generation capacity needs to increase by 9-10 folds by 2100 for power consumption equal to average developed country levels, or above 2000 GW of installed capacity in the distant future across all technologies like nuclear, solar, coal, etc. If the additional power demand is met by a technology with higher average capacity factor like say coal, then the additional installed capacity will be much lower. However, it makes most sense to install gas based power production for meeting additional peak load demands as this technology gives low cost flexibility to meet hourly power generation requirements.
The Stern Review (Stern, 2006) highlights that the total cost of climate change under BAU is estimated to be at least 5% of the value of global per capita consumption over the next two centuries. Indeed India is one of the most vulnerable countries to climate change impacts. Climate change impacts are many and varied, and the present analysis only offers limited initial insights.
The study aims at only first order approximations, and the motivation behind this analysis is to start a wider discussion for a more robust assessment of climate impacts and their valuation across sectors in India, all within the same analytical framework. Hence in the agriculture sector, the study has looked only at output losses of three major food crops- rice, maize and wheat. However climate change will impact all categories of crops ranging from oilseeds to fruits and vegetables. Health impacts of climate change include mortality at old age due to heat waves, higher incidence of malnutrition, etc. while we have focused on deaths related to three important diseases- Diarrhea, Malaria, and Dengue.
Impacts on energy infrastructure will be many, the analysis has focused on increased requirement of power generation for meeting peak hour demand of electricity. Apart from the three sectors that have been included in the study, climate change impacts hydrological flows, biodiversity, etc. and increased intensity and frequency of extreme events are also critical. Table 5 summarizes the cost of inaction calculated across sectors focused in this study.

Roadmap of the methodology to assess the climate co-benefits of the SUP ban in Tamil Nadu

Unlocking finance for NbS in Indian Cities
Locally-led Climate Action in the Global South
Towards Climate-resilient Indian Industries:
Roadmap of the methodology to assess the climate co-benefits of the SUP ban in Maharashtra