Council on Energy, Environment and Water Integrated | International | Independent
Suggested citation: Prabhu, Shravan and Vishwas Chitale. 2024. Decoding India’s Changing Monsoon Patterns: A Tehsil-level Assessment. New Delhi: Council on Energy, Environment and Water.
This study undertakes a pan-India sub-district level (tehsil-level) assessment of changing monsoon patterns during the southwest monsoon (June to September) and northeast monsoon (October to December). It delves into trends spanning the past four decades (1982–2022), with a specific emphasis on quantifying changes in rainfall patterns in the past decade. We do this climatological analysis by employing established statistical criteria and indices endorsed by the World Meteorological Organization (WMO) and the India Meteorological Department (IMD).
Recognising the micro-climatic variabilities of Indian monsoons, this study recommends development of local-level climate action plans. It aims to support local-level decision makers and administrators by providing granular information of monsoon statistics in annexure format that can be used for mapping of monsoon performance at tehsil levels.
The monsoons are crucial for the Indian economy and are often regarded as the backbone of the agricultural sector, which employs over half of India’s population. They also play a pivotal role in the management of water resources and the generation of hydro-based clean energy. However, the variability of the Indian monsoons and the associated wet and dry conditions have direct impacts on socio-economic aspects of the country, including the gross domestic product (GDP) (Gadgil and Gadgil 2006; Wang, Gadgil, and Kumar 2006; Gulati, Saini, and Jain 2013).
In 2022 alone, Asia witnessed over 81 natural hazards, with 83 per cent of them being hydro-meteorological. India, in particular, incurred significant losses, primarily due to floods caused by the monsoons (WMO 2023). While the Indian monsoons, by nature, show high variability through space and time, current climate change trends indicate that we are likely to breach global warming records earlier than expected (WMO 2023). Thus, we need to answer the crucial question of how these changes are likely to affect the variability of India’s most critical climatic phenomenon – the monsoons.
Existing literature predicts intensifying monsoon seasons with increased rainfall in core monsoon regions in both the medium term (up to 2050) and long term (up to 2100) under different representative concentration pathways (RCPs). Yet, capturing short-term granular spatial variabilities has been a challenge, especially beyond the district level. Existing assessments often focus on prolonged long-term trends at coarse resolutions and have not been able to account for intricate nuances within seasons, spanning across months and days, or even variations within a single district.
To fill this gap in enhanced analyses of short-term variabilities and to untangle the intricacies of the Indian monsoons, we conducted India’s first sub-district -level monsoon variability assessment. Sub-districts in India are known as tehsils, talukas, mandals, circles and sub-divisions. However, we refer to them as tehsils in our study to align with the prevalent usage of the nomenclature across the majority of the country for these administrative units. We answer how rainfall patterns are changing across India during the southwest and northeast monsoon in terms of inter-annual variability (year-to-year variability) and intra-annual variability (changes within months and wet and dry extremes).
For this assessment, we utilised the most recent 12-km high-resolution reanalysis data sourced from the Indian Monsoon Data Assimilation and Analysis project (IMDAA). The 12-km spatial grid covered 4419 tehsils out of 4723 tehsils as per the Survey of India shapefile obtained. Our assessment delves into trends spanning the past four decades (1982–2022), with a specific emphasis on quantifying changes in rainfall patterns in the past decade (2012–2022) during the southwest monsoon (referred to as JJAS, since it occurs from June to September) and the northeast monsoon (referred to as OND, since it occurs from October to December). We undertook a geospatial climatological analysis, employing established statistical criteria and indices endorsed by the World Meteorological Organization (WMO) and the India Meteorological Department (IMD), to accurately assess and quantify these changes.
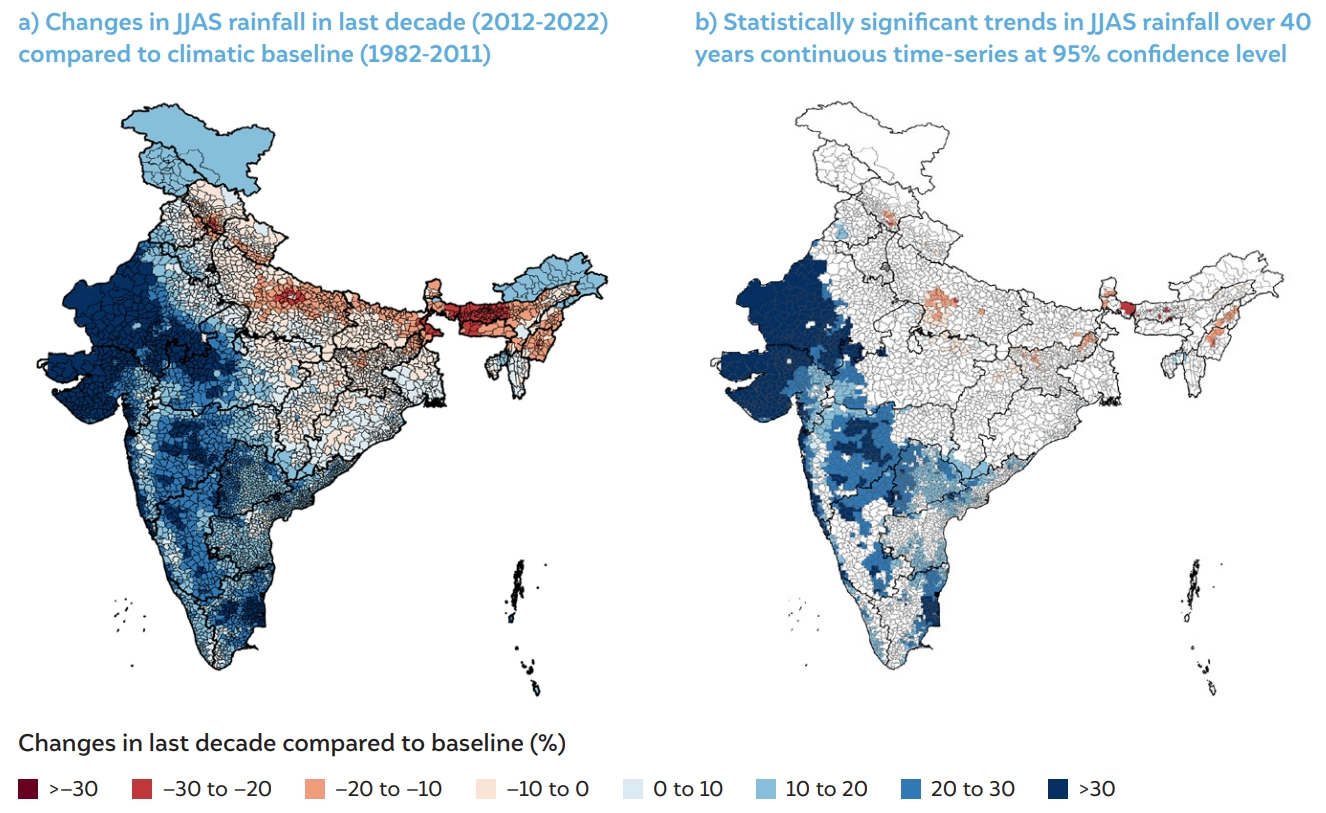
Figure ES1 The JJAS rainfall has increased in majority of the country, but decreased over Indo-Gangetic plains, north-eastern India and Indian Himalayan region in the last decade
Source: Authors’ analysis
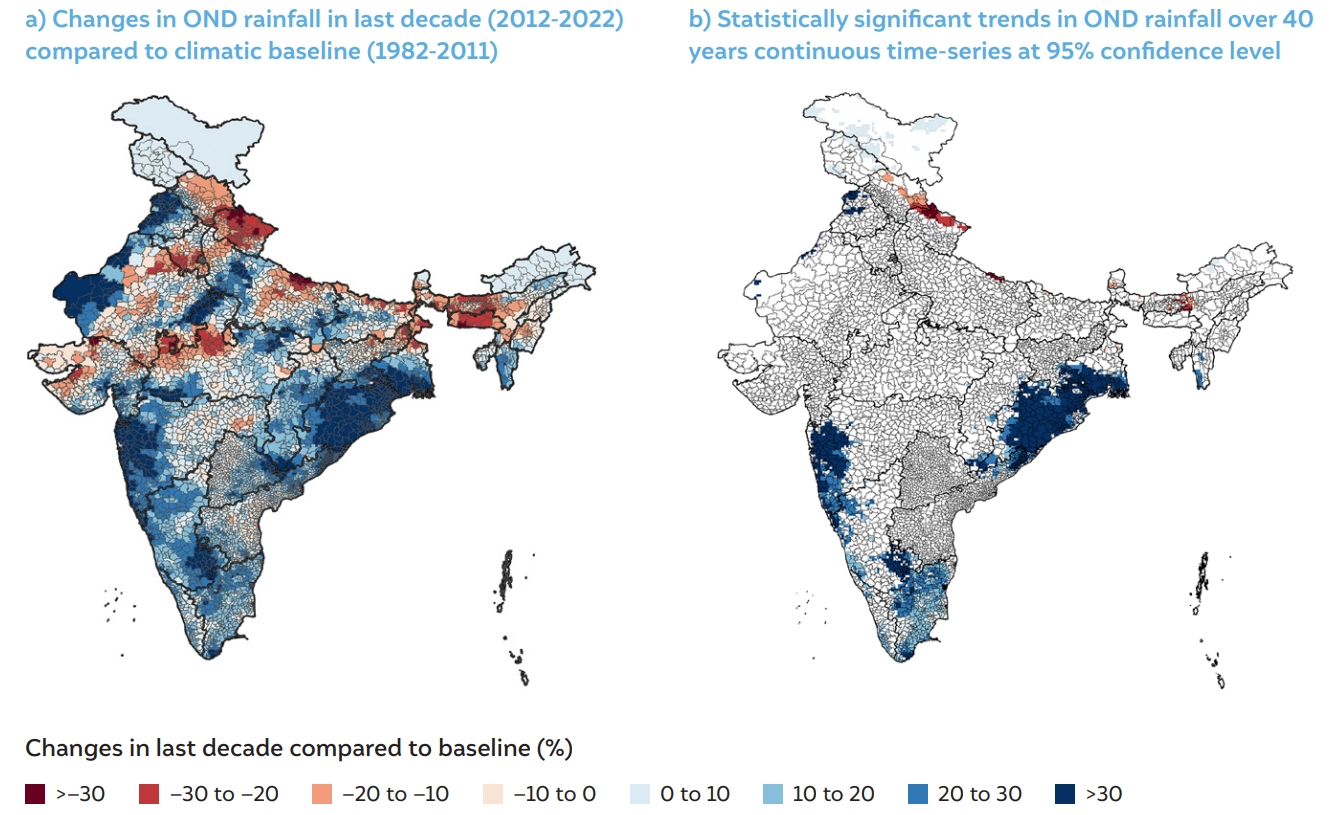
Figure ES2 Both the western and eastern coasts of India have seen an increase in OND rainfall in last decade
Source: Authors’ analysis
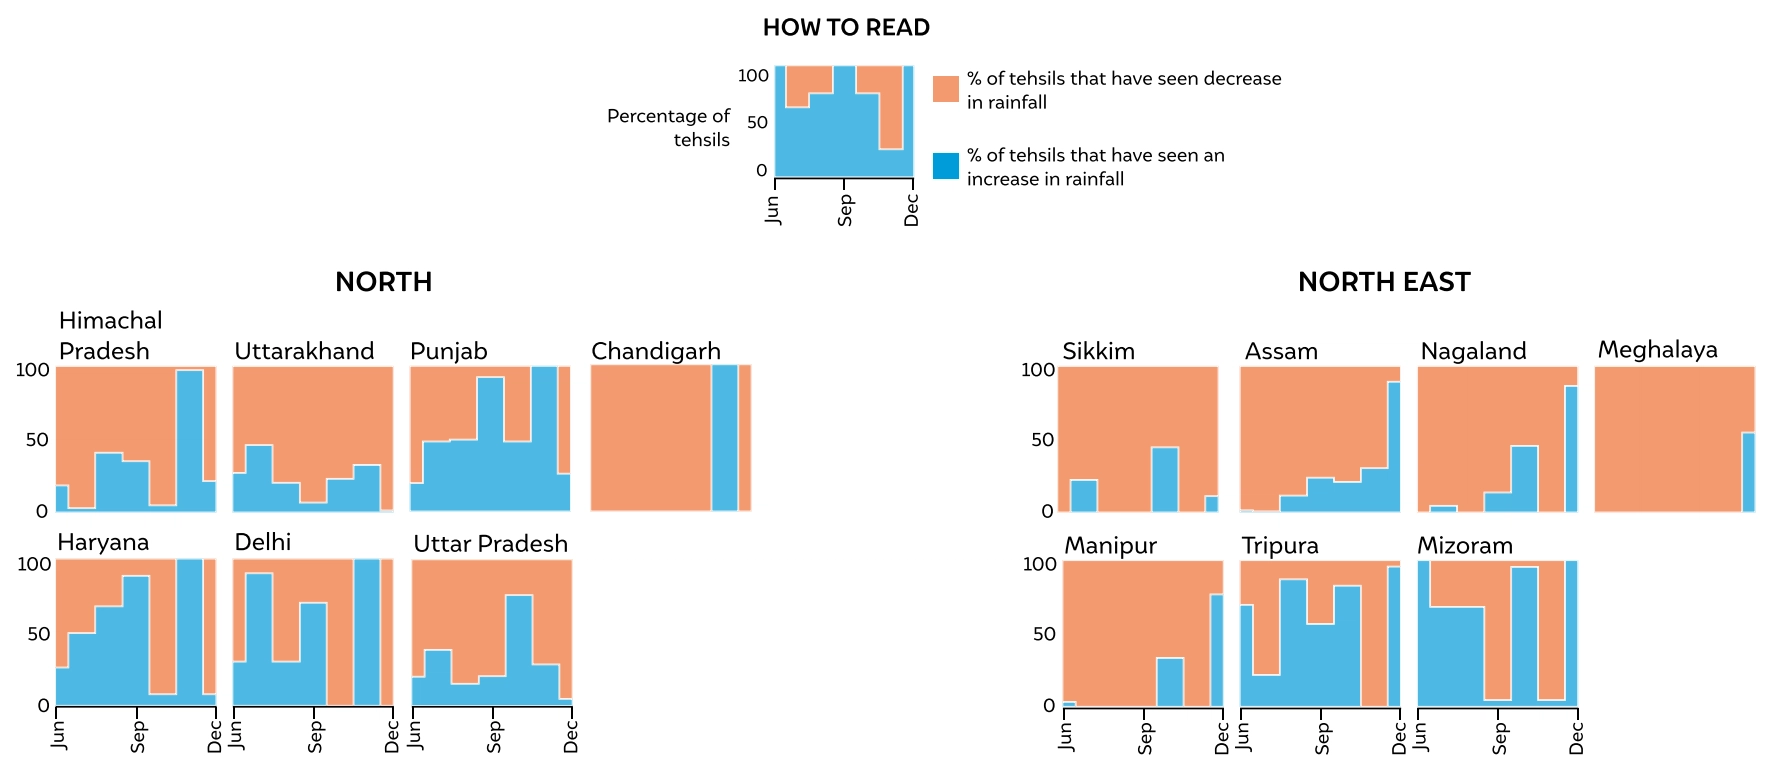
Figure ES3 Majority of India’s tehsils in the north and east zones show high variabilities in monthly rainfall
Source: Authors’ analysis
Note: The states and UTs of Jammu and Kashmir, Ladakh, Arunachal Pradesh and Lakshadweep have not been included here due to lack of availability of tehsil-level name attributes in administrative boundary shapefile.
The southwest (June to September) and northeast (October to December) monsoons are crucial for India’s economy. More than 50 per cent of the net sown area is rainfed, which accounts for approximately 40 per cent of the total production (Government of India 2023). Nearly 55 per cent of India’s population is engaged in agricultural and allied sectors, and well-distributed rainfall during the kharif and rabi seasons is regarded as the backbone of the sector (Government of India 2023). Beyond its impact on agriculture, these monsoons play a pivotal role in water resource management and realising India’s clean energy aspirations, particularly through the production of hydro-generated energy, which is important for it to achieve its ambitious net-zero targets.
However, monsoonal variability triggers contrasting wet and dry conditions, leading to hydro-meteorological disasters. As per an analysis of climatic disasters between 1971 and 2020 by the Council on Energy, Environment and Water (CEEW), around 75 per cent of India’s districts are prone to severe hydro-meteorological disasters such as floods, droughts, and cyclones. Moreover, nearly 40 per cent of these districts show a swapping pattern, alternating between drought and floods, which leads to compounding risk. Such swapping trends can be primarily attributed to evolving rainfall patterns (Mohanty 2020). Consequently, an estimated 80 per cent of the population now resides in regions bearing the brunt of climate-induced vulnerabilities (Mohanty and Wadhawan 2021).
Current climate change trends suggest that global warming records could be breached sooner than anticipated, leading to heightened climate variability and more frequent and intense extreme weather events, which will impact an even larger population (WMO 2023). This has a direct bearing on India’s monsoons, as evidenced in 2023, when unpredictable rainfall patterns triggered severe floods in some cities due to unprecedented heavy downpours, while core monsoon states faced notable rainfall deficits. For instance, Chandigarh received nearly half of its total annual rainfall in just 50 hours, while Maharashtra and Kerala encountered deficits of around 46 per cent and 60 per cent in June, respectively (IMD 2023).
In light of this rapidly evolving climate risk landscape, the development of effective climate adaptation policies at the sub-national level hinges on access to an exhaustive spectrum of climate information, spanning across diverse and granular spatial and temporal scales. In this issue brief, we try to decode changing patterns with respect to one of the most critical climatic variables for India – rainfall. We undertake this assessment at the tehsil level to quantify and understand trends in changes in rainfall during the southwest monsoon (between June and September) and the northeast monsoon (between October and December). We analyse the trends over the past 40 years (1982–2022), with a particular focus on the quantification of changes over the past decade, between 2012 and 2022. Our primary aim with this assessment is to offer fundamental insights into shifting rainfall patterns in recent years. These insights are intended to serve as valuable resources for policymakers and stakeholders across various sectors, including water management, agriculture, disaster preparedness, energy, and urban planning, among others, to help them make climateinformed decisions.

The monsoons inherently exhibit substantial spatial and temporal variability (Guhathakurta et al. 2020). The significant impact of this variability across sectors has made the study of its dynamics crucial in the context of climate change and the underlying atmospheric and oceanic processes. This has led to comprehensive research efforts spanning the climate science and policy domains (Gadgil 2003; Pai et al. 2014; Rajeevan, Bhate, and Jaswal 2008; Roxy et al. 2017; Guhathakurta and Rajeevan 2008; Goswami et al. 2006; Kumar et al. 2006). In the past two decades, researchers have leveraged both observational trend analyses and machinelearning-driven atmosphere–ocean coupled general circulation models to dissect climate fluctuations and assess potential long-term adverse effects. This analytical approach has provided valuable insights into the intricate dynamics of the monsoon system and its implications.
In its report titled “Assessment of Climate Change over the Indian Region”, the MoES delved into the long-term historical and projected changes in both the southwest and northeast monsoons across India (Krishnan et al. 2020). The study examined climatic trends between 1901 and 2015 and the projections under RCP4.5 and RCP8.5 till the end of the twenty-first century. Based on past climatic trends, the study reported that there was no discernible long-term trend in southwest monsoon rainfall across India as a whole. However, it highlighted pronounced spatial variability. Significant declining trends in rainfall were identified over Kerala, the Western Ghats, parts of central India, and select northeastern states. Conversely, regions such as Gujarat, the Konkan coast, Goa, Jammu and Kashmir, and the east coast experienced a significant increase in rainfall. Intriguingly, the study also found that an increase in the rate of heavy rain events offset a decrease in the rate of moderate-intensity rainfall events – that is, in regions such as central India, it was observed that the frequency of heavy rainfall events (rainfall more than 100 mm/day) increased as the frequency of moderate-intensity rainfall events decreased (rainfall between 5 and 100 mm/day). Moreover, the report underscored the fact that climate change influences not only the southwest monsoon, but also the northeast monsoon, as it was observed that the variability in northeast monsoon rainfall had escalated during the period 1959 to 2016.
Analysing climate change projections using the CMIP5 multi-model ensemble, CORDEX-SA, and NASA Earth Exchange Global Daily Downscaled Projections (NEXGDDP) simulations at a high-resolution 50-km grid, the assessment indicated a wetter future for the southwest monsoon in India. It predicts an increase of about 6 per cent under RCP4.5 and 8 per cent under RCP8.5 up to 2050 (near future) over India’s core monsoon region, while by the end of the twenty-first century (far future), the projected increase in rainfall is expected to be approximately 10 per cent and 14 per cent as per RCP4.5 and RCP8.5, respectively. With regard to the northeast monsoon, the simulations indicated a wetter northeast monsoon in the range of 10 per cent to 50 per cent under both RCP4.5 and RCP8.5 scenarios in the near and far future across the country.
Building upon the MoES report, the IMD employed 25- km resolution grid data to assess southwest monsoon rainfall across 29 states and union territories. It concluded that during the period 1989 to 2018, while no changes were found across the majority of the country, noteworthy declines in southwest monsoon rainfall were observed in the states of the Indo-Gangetic plains and the northeastern states (IMD 2020).
In general, a comprehensive analysis of the existing literature underscores the prevailing consensus that the majority of India is poised for intensified monsoon seasons characterised by increased rainfall. However, capturing short-term and spatial variabilities at a granular scale has been a challenge. The prevailing modelled assessments predominantly concentrate on prolonged long-term trends at a coarse resolution, thereby limiting their precision in encapsulating immediate effects and within-season variations. The studies have not been able to account for intricate within-season nuances, spanning across months and days, and even the variations within a district. This gap also extends to India’s current definition of a ‘normal’ monsoon, which is calculated as the nationwide average of total rainfall received throughout all monsoon months and does not incorporate spatial variabilities or wet and dry extremes.
Furthermore, the inherent complexities of the Indian monsoon systems introduce a further layer of uncertainty, particularly when contrasted with more predictable variables such as temperature. Studies highlight a lack of proficiency in accurately simulating the monsoons, which in turn amplifies uncertainties in comprehending future shifts (Chaturvedi et al. 2012; Saha et al. 2014; Sharmila et al. 2015; Krishnan et al. 2016). The wide inter-model spread in simulated precipitation changes over South Asia adds to the ambiguity in assessing regional hydroclimatic response (Kripalani et al. 2007; Annamalai, Hamilton, and Sperber 2007; Turner and Slingo 2009; Sabade, Kulkarni, and Kripalani 2011; Fan et al. 2010; Hasson, Lucarini, and Pascale 2013; Saha et al. 2014).
Therefore, there is an urgent need to further quantify these changes in monsoon rainfall over the recent decade at a finer spatial resolution. Consequently, in this issue brief, we embark on a comprehensive evaluation of these changes, which have been overlooked in prior assessments. This includes an examination of alterations in monthly patterns, a region-specific threshold-based assessment concerning wet extremes, and a meticulous tehsil-level analysis. Our goal is to present this information comprehensively and cohesively. To this end, we selected the following objectives for our study.
We undertook a tehsil-level rainfall variability assessment using IMDAA’s latest fine-resolution reanalysis data available at a 12-km spatial grid. This marks, to the best of our knowledge, the first tehsil-level assessment of rainfall variability in India. Our main goal is to provide fundamental insights into monsoon variability and its extremes over the past decade, between 2012 and 2022. By focusing on key monsoon seasons, we aim to assist policymakers and stakeholders from different sectors in making climate-informed decisions. We analysed inter-annual changes (year to year) and intra-annual variations (within months and extreme wet and dry anomalies) using well-established statistical criteria and indices recommended by the WMO and IMD. The main objectives of our study are as follows:
• analysing shifts in India’s rainfall patterns during the southwest and northeast monsoon seasons;
• investigating changes in rainfall patterns across India at the tehsil scale during these monsoon seasons to quantify year-to-year variability and monthly anomalies; and
• Identify dry and extreme rainfall hotspots in the tehsils, including heavy rainfall events and dry days, and highlight tehsils with high percentages of total rainfall occurring within short periods.
For the exploration of climatic patterns and anomalies to be valid, adherence to the guidelines set forth by the World Meteorological Organization (WMO) is paramount. The WMO advocates for a minimum 30-year climate baseline to ensure a comprehensive assessment of anomalies and changes (WMO 2017). However, such studies need high-quality, high-resolution spatial–temporal data, given that the accuracy of the analysis hinges on data quantity and quality, and acquiring such data is challenging (Murray and Ebi 2012). Furthermore, diverse criteria are employed by different meteorological agencies and researchers globally to measure the variabilities and extremes. This underscores the need to comprehensively understand these variations. Therefore, our approach consisted of two core components: (i) compiling time-series data sheets detailing daily rainfall records across India and (ii) implementing an integrated climatological analysis to gauge inter- and intra-monsoon rainfall variability, employing a selection of indices.
Figure 2 Schematic representation of approach and methodology

Source: Authors’ compilation
For our assessment, we used the latest IMDAA reanalysis data from 1982 to 2022, which, at a 12-km grid resolution, is the finest available long-term climate data for the Indian subcontinent. This regional highresolution atmospheric reanalysis is the first of its kind and was created through a collaboration between the National Centre for Medium-Range Weather Forecasting (NCMRWF), Met Office (UK), and IMD. The IMDAA reanalysis covers the period from 1979 to the present and uses a 4D-Var data assimilation method, making it the highest-resolution atmospheric reanalysis for India. It incorporates conventional and satellite observations, including some new ones not used in previously available reanalyses, such as the ECMWF Reanalysis version 5 (ERA5) (NCMRWF 2023).

Source: Authors’ compilation
Considering that the data is derived from reanalysis models, the need for bias correction becomes unavoidable. This correction process is already integrated into the system configuration, aligning it with IMD observation stations. Examinations of the accuracy of IMDAA data underscore its precise representation of key weather phenomena across seasons, showing good alignment with observational and reanalysis datasets such as ERA5. Notably, this reanalysis deftly captures crucial aspects of the Indian summer monsoon, including the distinctive low-level and tropical easterly jets. Moreover, the IMDAA estimates the mean, interannual, and intra-seasonal fluctuations of summer monsoon rainfall adequately. It even captures fine-scale features related to heavy rainfall episodes over complex terrain (Rani et al. 2021; Rani et al. 2020; Ashrit et al. 2020; Mahmood et al. 2018; Singh et al. 2021).
However, the investigations also revealed a slight inclination of the IMDAA towards registering wetter rainfall measurements during both the southwest and northeast monsoons, showing a slight difference from actual observations and ERA5 data in this aspect. It’s important to acknowledge that this constraint in fully validating the complete array and spatial distribution of rainfall within the IMDAA data set stems from the scarcity of high-resolution observations across the country. Despite this limitation, the validation studies have ascertained that the IMDAA data constitutes a reliable and valuable high-resolution reanalysis data set that can be effectively used in India’s weather and climate research.
To address the practical challenges posed by a changing climate variable, it is crucial to understand the behaviour of extreme values and the long-term variability of that climate variable (WMO 2017). Hence, for our tehsil-level climatological analysis, we employed a combination of indices recommended by the WMO, the IMD, and other relevant literature, as outlined in the subsequent paragraphs. These core indices provide a standardised and mutually consistent perspective on observed weather and climate changes at the global, national, and regional levels. They have been developed with the objective of informing adaptation strategies in various sectors based on their specific impacts.
Learnings from the literature suggest that while there is consistency in the indices for mapping the inter-annual variability, with well-defined criteria based on the region-specific normal, there is no consensus about the thresholds used for mapping the daily anomalies, and each study uses a different computational threshold. For example, a few studies use grid-specific thresholds, whereas some use an absolute threshold throughout the grids (Krishnamurthy, Lall, and Kwon 2009; Vidya, Anushiya, and Murthy 2022; IMD 2020; Goswami et al. 2006; Varikoden and Revadekar 2020; Vittal, Karmakar, and Ghosh 2013; Guhathakurta, Sreejith, and Menon 2011).
Table 1 Different studies use different thresholds for mapping intra-seasonal rainfall anomalies.

Source: Authors’ compilation
While employing fixed absolute thresholds (such as categorising heavy rainfall days as those with precipitation above 100 mm) has many advantages, including simplicity and ease of interpretation, opting for percentile-based thresholds provides a more uniformly distributed representation across geographical regions (Krishnamurthy, Lall, and Kwon, 2009). This technique gains heightened relevance in climate change studies with ample long-term data (WMO 2017). Given India’s diverse climate, topography, and geography, we opted for percentiles to gauge extreme rainfall intensities. This approach enabled variation in the intensity threshold within tehsils, allowing us to identify localised hotspots accurately. By adopting this approach, we achieved a more precise depiction of monsoon trends and spatial patterns in India, effectively capturing the wide range of variability observed throughout the country. Furthermore, parsing trends in frequency and intensity separately proved invaluable, as the increase in frequency of events may not uniformly correlate with heightened event intensity (Trenberth 1999).
Our methodology and index selection underwent validation via stakeholder consultation involving climate and social science experts. This consultation also delved into the challenges surrounding evolving rainfall patterns and emphasised the imperative of measuring anomalies comprehensively at a granular level, beyond the administrative units of a district.
Table 2 List of indices evaluated for assessing rainfall variability

Source: Authors’ compilation
Figure 4 Snapshots from the CEEW consultation-cum-validation workshop

As the core objective of our assessment was quantifying recent changes or trends, we computed anomalies based on variations in the recent period (2012–2022) relative to the climatological baseline (1982–2011). The resulting spatiotemporal outputs for each indicator, in a gridded format, were subsequently aggregated to administrative units, such as tehsils, districts, and states, based on the latest shapefiles obtained from the Survey of India. It’s worth noting that tehsils are known as talukas or tehsils in various regions of the country, but for consistency, we refer to them as tehsils throughout our study. The aggregation was done utilising the spatial zonal statistics2 method. Any observed time-series trends, whether increasing or decreasing, were validated statistically using the Mann–Kendall non-parametric test3 and Sen’s slope estimator4 , maintaining a 95 per cent confidence level.

Source: Authors’ compilation
The risks associated with climate change exhibit nonlinear characteristics, wherein the impacts can rapidly escalate despite the shifts in average conditions being gradual (King et al. 2015). Altered rainfall patterns give rise to both chronic and acute risks for ecosystems. Chronic risks emerge through gradual shifts such as reduced mean rainfall, while acute risks stem from sudden, intense events such as extreme rainfall and prolonged dry spells. These risks are interconnected, and their mitigation requires coordinated efforts across sectors and stakeholders (Pachauri et al. 2014). Notably, abrupt changes in precipitation during the Indian monsoon on decadal and centennial scales are evident from high-resolution climate proxy records spanning thousands of years (Berkelhammer et al. 2012; Sanyal and Sinha 2010).
In India, there are traditionally four primary seasons (refer to Box 1). Here, we focus on two pivotal seasons for agricultural and water resource management activities – the summer or southwest monsoon season (referred to as JJAS, since it occurs between June and September) and the post-monsoon or northeast monsoon season (referred to as OND, since it occurs between October and December). By utilising indices that capture both chronic and acute risks linked to rainfall variability, our analysis aimed to provide comprehensive information on shifts in the rainfall patterns at the tehsil level in India.
As depicted in Figure 5, a trend analysis of the all-India JJAS demonstrates an overall intensification when averaged across the country, exhibiting an increasing trend at an approximate rate of 3 mm/year (as indicated by Sen’s slope). Conversely, our investigation at the district and tehsil level uncovered a landscape characterised by substantial spatial variability within this trend.
To dig deeper into this pattern and uncover districts and tehsils that have shown significant year-to-year variations over the past four decades, we followed a two-step approach. First, we categorised each year based on the IMD criteria, dividing them into deficient, normal, or excessive rainfall years at the district and tehsil level. First, we categorised each year based on the IMD criteria, dividing them into deficient, normal, or excessive rainfall years at the tehsil level. At the same time, we also conducted a country-level study to determine the rainfall received by India as a whole and categorised it as normal, below-normal, or abovenormal rainfall.
Figure 5 All-India averaged JJAS rainfall shows a slightly increasing trend at the rate of 3 mm/year (not statistically significant)

Source: Authors’ analysis
It’s important to note that the IMD uses different criteria for rainfall categorisation at the regional level and the national level. For regional categorisation, we used specific thresholds outlined in Table 2. However, at the national level, rainfall is considered ‘normal’ when it falls within 10 per cent of its long-period average (LPA) or ranges from 90 per cent to 110 per cent of the LPA. Rainfall is deemed ‘below normal’ if it’s less than 90 per cent of the LPA and ‘above normal’ if it’s more than 110 per cent of the LPA (IMD 2019).
Our analysis reveals that nearly 30 and 38 per cent of India’s districts witnessed a high number of deficient and excessive rainfall years (more than 10 years of 40), respectively in the past 40 years. Moreover, 23 per cent of these witnessed both a high number of deficient as well as excessive rainfall years such as New Delhi, Bengaluru, Nilgiris, Jaipur, Kachchh, and Indore. Further, at the tehsil level, nearly 24 per cent of the tehsils in India have experienced a high number of both excessive and deficient rainfall years.5 Intriguingly, during this period, from 1982 to 2022, based on current criteria, we identified 29 years classified as ‘normal’ monsoon years, alongside 9 years classified as ‘abovenormal’ and 3 years as ‘below-normal’ at the country level. The tehsils demonstrating such pronounced year-to-year variability are primarily concentrated in the Marathwada region of Maharashtra, along with tehsils of Rajasthan and Gujarat.
While these trends highlight a concerning pattern of erratic monsoon behaviour from one year to another, they emphasise that looking at monsoons at a coarse resolution such as a national scale doesn’t adequately account for the substantial spatial variabilities observed across the country.
We analysed changes in the past decade at the tehsil level, which revealed that there is an overall increasing trend for JJAS rainfall; 55 per cent of tehsils showed an increase, while 11 per cent showed a decrease, compared to the baseline of 1982–2011 by more than 10 per cent, as seen in Figure ES1. The latter is of particular concern as a significant number of these tehsils are concentrated in the Indo-Gangetic plains and Himalayan states, where agricultural activities in the kharif season rely heavily on JJAS rainfall and are also highly vulnerable to hydro-meteorological disasters such as floods and droughts.
Figure 6 24% of tehsils have witnessed both a high number of deficient as well as excessive rainfall years in last four decades.

Source: Authors’ analysis
Notably, the degree of positive change surpassed that of negative change in most regions experiencing changing trends. For instance, the most substantial decrease was observed in the tehsils of Assam and Meghalaya, which have traditionally been high monsoon rainfall areas, with reductions exceeding 30 per cent (greater than 1200 mm/year compared to their LPA) in tehsils such as Pachim Nalbari Circle, Boitamari Circle, and Barnagar Circle of Assam among others. Conversely, the most notable increase was seen in the tehsils of traditionally drier areas, such as Rajasthan, Gujarat, the Konkan region, central Maharashtra, and parts of Tamil Nadu, where the increase in JJAS rainfall exceeded 30 per cent when compared to the baseline of 1981–2011.
Although the analysis of changes in JJAS rainfall as a whole offers a broad overview of variations, a closer examination on a monthly basis shows that there is significant month-to-month variation across several tehsils, as seen in Figure 7. Noteworthy among these changing patterns is the continuous decline in rainfall in tehsils situated within the Indo-Gangetic plain states, alongside substantial month-to-month fluctuations in eastern Maharashtra.

Source: Authors’ compilation

Figure 7 Out of the total number of tehsils that witnessed an overall decrease in JJAS rainfall, 68% of tehsils consistently experienced reduced rainfall in all JJAS months, while 87% showed a decline during the June and July.

Source: Authors’ analysis

Notably, the months of June and July are important for agricultural activities in India, because this is the period of sowing and establishment of crops. Our analysis showed that of the tehsils witnessing an overall decrease in JJAS rainfall, approximately 68 per cent of tehsils experienced reduced rainfall across all four months, while around 87 per cent experienced decreasing rainfall specifically in June and July, which is a critical phase of the monsoon for the timely sowing of Kharif crops. Moreover, in June, when the monsoon sets in over Kerala and advances to the western coast of India, some parts of the state witnessed a decrease in rainfall.
Our analysis revealed that nearly 55 per cent of the tehsils in the country are witnessing an increase in JJAS rainfall. However, it’s crucial to assess its seasonal distribution. In our previous report on extreme hydrometeorological disasters in India, we found a nearly three-fold increase in flood frequency nationwide, impacting nearly 34 more districts since 2005 (Mohanty 2020). Therefore, we investigated whether regions with heightened JJAS rainfall also experience more frequent and intense heavy rainfall events, using a daily variability analysis (i.e., heavy rainfall days, moderate rainfall days, and dry days). Furthermore, we evaluated the contribution of these events to seasonal rainfall.

Source: Authors’ compilation

Figure 8 64% of Indian tehsils saw an increase in the frequency of heavy rainfall days during JJAS

Source: Authors’ analysis
We categorised wet extremes based on tehsil-specific thresholds corresponding to the 90th and 99th percentile of the baseline. For simplification purposes, we refer to them as heavy and very heavy rainfall days. We found that nearly 64 per cent of Indian tehsils experienced an increase in the frequency of heavy rainfall days by 1-15 days per year in the past decade. In addition, a few tehsils in Tamil Nadu, Gujarat and western coast of India also saw an increase in the frequency of very heavy rainfall days during JJAS by 1-5 days per year. While the majority of the country did not see any significant change in very heavy rainfall day frequency, these events, exceeding the 99th percentile threshold, typically occur rarely – about one or two days per monsoon season.
Significant increases in wet extremes have been particularly evident in the tehsils of Maharashtra, Gujarat, Rajasthan, western Madhya Pradesh, and peninsular India. Interestingly, we also noted that tehsils in the top four states with the highest gross state domestic product – namely, Maharashtra, Tamil Nadu, Gujarat, and Karnataka – experienced an increase in the frequency of heavy rainfall days (Forbes India 2023).
Although we observed an increase in the frequency of wet rainfall extremes, our analysis does not reveal significant trends in the intensity of these occurrences. However, a statistically significant finding does emerge – the proportion of total seasonal rainfall attributed to wet extremes is on the rise in India during JJAS. This trend is of particular concern as it is related to the distribution of rainfall within a season. This could be one of the reasons behind the recent occurrences of flash floods, such as in Delhi, Uttarakhand, Himachal Pradesh (in 2023), and Bangalore (in 2022).

Source: Authors’ compilation
Figure 9 India is getting a higher proportion of its JJAS rainfall from short-lived wet extremes.

Source: Authors’ analysis

Source: Authors’ compilation
Regarding changes in the occurrence of dry days and moderate rainfall days, our analysis indicates a similar pattern to changing overall monsoon patterns. For example, the majority of the tehsils in the country which saw an increase in JJAS rainfall also saw a decrease in frequency of dry days and an increase in frequency of moderate rainfall days. However, an important observation emerges: the frequency of dry days is notably on the rise in specific tehsils along the Indo-Gangetic plains and the northeast. Interestingly, we identified contrasting trends of more dry days coupled with fewer moderate rainfall days in the affected areas. This distinct pattern is discernible in approximately nine per cent of all tehsils across India.

Figure 10 Increase in the number of dry days is offset by the decrease in moderate rainfall days in 9% of tehsils during JJAS rainfall.

While the southwest monsoon greatly impacts India’s economy, delivering the majority of its annual rainfall from June to September, the northeast monsoon from October to November holds significance for the cultivation of rabi crops across the country. This monsoon is particularly crucial for peninsular India and states such as Andhra Pradesh and Tamil Nadu, which receive up to 60 per cent of their annual rainfall during this period. The northeast monsoon significantly affects the cultivation of rice and maize in Tamil Nadu and Andhra Pradesh (Krishna Kumar et al. 2004). The rainfall during the northeast monsoon exhibits high variability both spatially and temporally. The coefficient of variation (inter-annual) for the northeast monsoon rainfall averaged over five subdivisions is 25 per cent, exceeding that of the southwest monsoon rainfall averaged over the entire country (10 per cent). The peninsula in the south is renowned for its substantial year-to-year variability (Rajeevan et al. 2022).
As seen in Figure 11, we observe a similar phenomenon with the northeast monsoon as we did with the southwest monsoon. Over the past four decades, there has been a slight increasing trend in the rainfall during the northeast monsoon across the country. This trend reflects a gradual increase at a rate of 0.7 mm/day, according to Sen’s slope estimator, though it’s worth noting that this trend is not significant.
Figure 11 The northeast monsoon over India shows a slightly increasing trend, at the rate of 0.7 mm/year (not statistically significant)

Source: Authors’ analysis
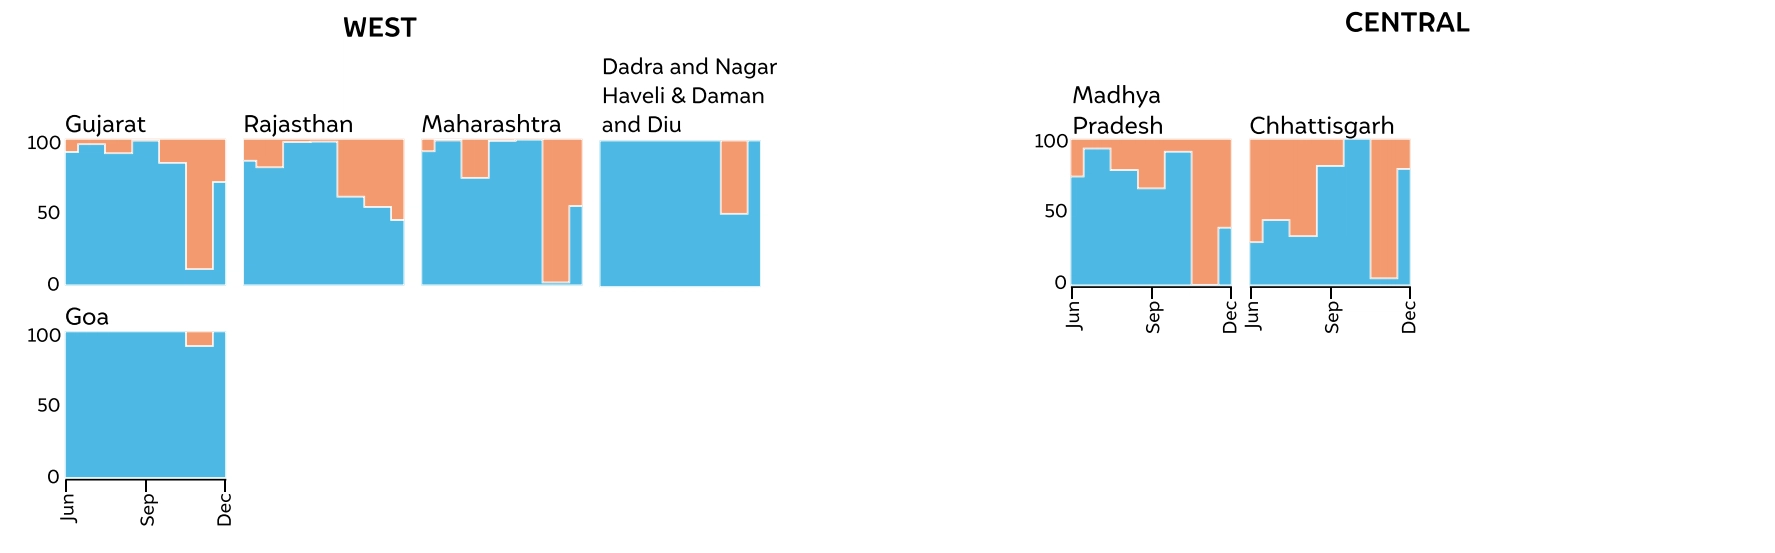
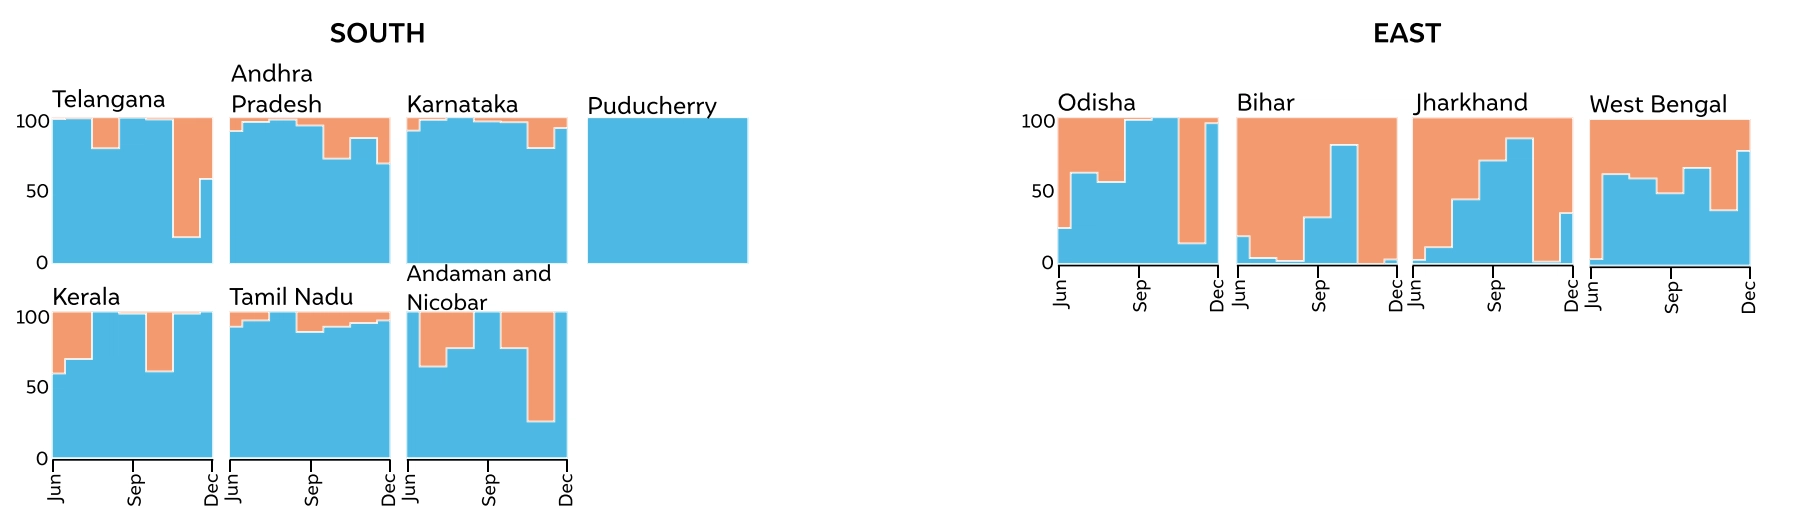
Over the past decade, there have been significant changes in the northeast monsoon patterns across the regions it impacts. As depicted in Figure ES1, regarding alterations in OND rainfall within the core states it affects, our analysis revealed that the OND rainfall increased in nearly 80 per cent of Tamil Nadu’s tehsils, 44 per cent of Telangana’s tehsils, and 39 per cent of Andhra Pradesh’s tehsils in the past decade compared to the climate baseline by more than 10 per cent.
Furthermore, even though the northeast monsoon mainly affects peninsular India and the OND rainfall contribution constitutes only a small portion of the annual rainfall in the Indian mainland, we observed changing patterns in these tehsils as well. For example, the tehsils showing an increase in OND rainfall in the past decade compared to the climate baseline are in Odisha, south West Bengal, and the Konkan region. Conversely, a decrease is observed in tehsils of Uttarakhand, Himachal Pradesh, Haryana, and northeastern states such as Meghalaya and Assam.
The OND season, also known as the retreating monsoon season or post-monsoon season, witnesses a shift in the rainfall zone to the southern regions of India, Sri Lanka, and the adjacent sea. As the southwest monsoon recedes from the northern parts of India, the mean sea level pressure and upper tropospheric wind circulation patterns undergo a swift transition from the summer monsoon type to the winter type. By October, the ITCZ or monsoon convergence zone, previously situated over northern India, starts shifting southwards (Rajeevan et al. 2022).

Source: Authors’ compilation
Figure 12 48% of tehsils in India saw an increase in October rainfall in the past decade.


Source: Authors’ analysis
Our analysis of monthly OND rainfall changes reveals a remarkably variable trend characterised by significant month-to-month variations. Notably, our findings indicate that around 48 per cent of the tehsils have been witnessing an increase in October rainfall during the past decade by more than 10 per cent, which could be due to the delayed withdrawal of the southwest monsoon over the mainland, as evident in 2023 (IMD 2023).
While examining wet and dry rainfall extremes, we observed minor shifts occurring in India’s coastlines, as the frequency of heavy rainfall days was found to be increasing in the range of 1-5 days per day in the past decade. However, the majority of the country experiences a lower intensity of heavy rainfall events during this period compared to the southwest monsoon period and hence, the extent of the increase is relatively modest in comparison and could be attributed to the post monsoon cyclonic activity in the region. Our analysis revealed no notable or substantial changes in the frequency and intensity of very heavy rainfall events, dry days, or moderate rainfall days.
The impacts of climate change are becoming increasingly evident worldwide. According to a recent report by the WMO, Asia is the world’s most disaster-prone region (WMO 2023). In 2022 alone, Asia experienced over 80 hydro-climatic disasters, which directly affected approximately 50 million people. Notably, floods and droughts accounted for nearly 70 per cent of the total economic losses resulting from hydro-climatic disasters in Asia during that year. In the context of India, the loss and damages were primarily associated with floods during the monsoon season. The total economic loss from these disasters was estimated to be USD 4.2 billion (WMO 2023).
The Indian monsoons are intricately influenced by atmospheric and oceanic processes, naturally displaying significant variability in both space and time. However, our analysis, along with the findings from the reviewed literature, indicates a worrisome intensification of this variability, which can be largely attributed to climate change.
Given these circumstances, it has become crucial to study the intricacies of rainfall variability in order to gain new insights into the performance of both the southwest and northeast monsoons in India. Consequently, there is an urgent need not only to access detailed climate information that reflects the latest trends, but also to accurately capture localised variabilities through tailored thresholds. This is particularly relevant for countries such as India, which has one of the most diverse climate profiles globally.
Therefore, to build resilience against changing monsoon patterns, there is a pressing need for localised decision-making. This involves analysing monsoon performance accurately, re-evaluating strategies in key sectors, and formulating adaptation action plans tailored to the specific needs of each locality.
We found significant spatial variabilities in changing rainfall patterns as well as high month-to-month variability, with increasing occurrence of extreme rainfall events. Considering these evolving complex trends, localised decision-making is crucial for building resilience against increasing monsoon variability Presently, IMD provides monsoon information at country, zonal, state, meteorological sub-division, and district scales, based on existing observation stations. However, this network lacks the density needed to map the monsoon at a more granular administrative level. Therefore, we utilised reanalysis data from IMDAA to map monsoon variability for all tehsils in India for both JJAS and OND seasons. Annexure 1 includes the coefficient of variation (CV) and long-period average (LPA) for all tehsils considered in this study, following WMO and IMD guidelines outlined in Chapter 2. Figure 13 a and b depict the CVs for JJAS and OND rainfall, while Annexure 1 contains CVs for both seasons and individual months. These metrics can assist local decision-makers in analysing monsoon performance for upcoming years.
While the total quantum of rainfall is crucial for mapping performance across the considered temporal scale, it is equally important to adopt new frameworks that consider monthly variability and contrasts between dry and wet extremes at a finely detailed spatial scale when assessing monsoon performance. Studies like Mishra, Tiwari, and Kumar (2022) have proposed such frameworks, which can offer more actionable insights into monsoon performance, contributing to enhanced disaster preparedness and response.
Figure 13 Tehsil-wise coefficient of variation

Source: Authors’ analysis
Based on the directive framework from the MoEFCC in 2019, most states are currently in the process of submitting their revised SAPCCs up to 2030. While the initial focus of climate risk analysis in these plans is at the district level, as evident in our findings, tehsil level climate information is available due to data-democratisation initiatives such as the National Monsoon Mission.
We recommend that all districts in India should develop district-level climate action plans where this information needs to be synergised with detailed socio-economic and sector-specific data to craft meticulous climate risk assessments, particularly for pivotal sectors such as energy, water, and agriculture, which bear the brunt of climate impacts.
As per the latest Global Goal on Adaptation, each country is required to conduct updated assessments of climate hazards, impacts, and exposure to risks and vulnerabilities by 2030. However, existing SAPCCs heavily rely on prolonged trends upto 2050 and 2100 derived from CORDEX-based RCMs and statistically downscaled CMIP models. These methods face challenges in capturing nuanced variations within the intricate Indian monsoon system, particularly over smaller spatial scales and shorter time frames.
For effective planning towards 2030, there is a pressing need for more short-term projections. Thus, prioritising the development of advanced global weather prediction models at a 12-kilometre horizontal resolution, as outlined in the MoES’ ACROSS scheme, becomes crucial. Additionally, fostering collaboration between research institutions, meteorological agencies, and civil society organisations is essential to make climate information more accessible for a diverse range of stakeholders. Drawing insights from global best practices, such as California’s Cal-Adapt platform, which is recognised for supporting local hazard mitigation and aiding climate policy, can be instrumental. Implementing such strategies can facilitate the creation of tailored and granular climate action plans that align with local needs.
Our evaluation of monsoon variability at the tehsil level underscores the significant diversity in monsoon rainfall patterns on a local scale. It becomes increasingly clear that hyper-local climate adaptation strategies are needed to cope with these variations. Consequently, there is a demand for hyper-local data that encompasses both climate-related and socio-economic variables to inform these strategies effectively. Currently, the most refined observational rainfall data available operates at a 25-km spatial resolution and is derived from 6955 rain gauge station records countrywide (Pai et al. 2014). However, a significant increase in this number is needed if more precise climate models and hyperlocal action plans are to be developed. In this context, data democratisation through the augmentation of alternative weather recording sources, such as AWS, gains prominence. A positive step in this direction is WINDS, an integral component of the Pradhan Mantri Fasal Bima Yojana, which provides AWS-recorded real-time weather information. Similarly, noteworthy instances of community engagement, such as school students in Kerala recording 24-hour rain data, humidity, wind speed, and direction to comprehend micro-weather patterns and climate, present an avenue for amplifying such efforts to enhance the assessment of micro-climatic rainfall variabilities (Philip 2023).
The southwest monsoon is the primary monsoon affecting India, which occurs from June to September. Around June, the monsoon hits Kerala on southwestern coast, gradually progressing across the country. The monsoon's arrival is eagerly awaited as it marks the end of scorching summer heat, providing relief and contributing significantly to India's diverse ecosystems and economy, especially the growing of kharif crops. India is also impacted by the northeast monsoon, also known as the winter monsoon or retreating monsoon, which affects the peninsular India and occurs from October to December. This monsoon is less intense compared to its southwestern counterpart but plays a crucial role in growing rabi (winter) crops and helps recharge groundwater.
The natural variability of Indian monsoons is further influenced by climate change, as revealed in our study. Traditionally monsoon-rich regions like Northeast India, the Indo-Gangetic plains, and the Indian Himalayan region experienced a decrease in the past decade. Conversely, traditionally drier areas, including Rajasthan, Gujarat, central Maharashtra, and Tamil Nadu, witnessed an increase in southwest monsoon rainfall. The northeast monsoon intensified in Tamil Nadu, and states such as Odisha and West Bengal on the east coast, as well as Maharashtra and Goa on the west coast, observed heightened October to December rainfall.
Several factors influence the monsoon patterns in India. The primary driver is the differential heating of the land and sea. During summer, the Indian subcontinent heats up, creating low-pressure areas. Meanwhile, the surrounding oceans maintain relatively lower temperatures, creating high-pressure zones. The resulting pressure gradient triggers the southwest monsoon, drawing moist air from the Indian Ocean. Other factors include the El Niño-Southern Oscillation (ENSO), with El Niño leading to drier conditions and La Niña enhancing the monsoon. The Indian Ocean Dipole (IOD) also plays a role, impacting sea surface temperatures. Additionally, features like the Tibetan Plateau, Western Ghats, and Himalayan mountains influence wind patterns, affecting rainfall distribution across regions.
As Earth's surface temperatures rise globally, the scientific understanding is that increased evaporation leads to a rise in overall precipitation. This phenomenon is anticipated to result in increased rainfall in various regions globally due to a warming climate. Projections over India align with this trend and an increase in both southwest and northeast monsoon rainfall in the country is expected, accompanied by more heavy rainfall days. Climate change projections for India indicate a substantial 10-14 per cent rise in southwest monsoon rainfall by the close of the twenty-first century.
Adapting to the evolving monsoon patterns necessitates a comprehensive approach, integrating policy, research, and citizen science. Initially, fostering more localised decision-making is essential, emphasising the creation of district and city-level climate action plans. These plans should incorporate climate risk assessments tailored for key sectors like agriculture, water, and energy. Secondly, critical sectors must undergo a strategic reevaluation and adjustment of their approaches in response to the shifting patterns. This entails recalibrating crop cycles and disaster management calendars, to align with the dynamic nature of the changing monsoons.
Roadmap of the methodology to assess the climate co-benefits of the SUP ban in Tamil Nadu
Unlocking finance for NbS in Indian Cities
Locally-led Climate Action in the Global South
Towards Climate-resilient Indian Industries:
Roadmap of the methodology to assess the climate co-benefits of the SUP ban in Maharashtra