Council on Energy, Environment and Water Integrated | International | Independent

Suggested Citation: Sikdar, Mirambika, Amber Woodward, Dhruvak Aggarwal, and Yixin Sun. 2026. How can India Create a Demand Flexibility Market? A Roadmap for a Flexible Power System. Council on Energy, Environment and Water
As India rapidly electrifies its economy and scales up renewable energy, the grid faces increasingly complex real-time operational challenges. Demand is growing with rising cooling loads, industrial electrification, and electric vehicle adoption. Relying solely on conventional, supply-side solutions to manage this transition risks driving up costs. There is an urgent need to explore new ways to source, value, and integrate grid flexibility.
A demand flexibility (DF) market offers a more cost-effective path. By coordinating rooftop solar units, EVs, smart appliances, and home storage systems with real-time grid conditions through clear price signals, a DF market can ease network congestion, integrate more renewables, and reduce the need for costly grid upgrades. While India's regulations already allow demand flexibility to serve peak demand and provide ancillary services, a well-functioning DF market — with multiple buyers and sellers, standardised contracts, open APIs, and shared data — does not yet exist.
This report, a collaboration between CEEW and the Centre for Net Zero (CNZ), presents a five-pillar road map for creating a demand flexibility market in India. Drawing on case studies from Great Britain and Australia, a survey of 14 Indian distribution companies, the study maps the regulatory, technical, and institutional steps India must take to scale demand flexibility from pilots to market operations.
As the share of renewable energy in India’s rapidly growing power system rises, the grid faces complex real-time operational challenges. In parallel, India is seeing growing power demand with rising cooling demand, industrial electrification, and electric vehicle (EV) adoption, similar to power grids globally. Relying solely on conventional supply-side solutions to establish a flexible grid could increase costs, prompting a need to explore new ways to source, value, and integrate grid flexibility.
In this context, a growing decentralised system with distributed energy resources (DERs) such as rooftop solar units, EVs, smart appliances, and behind-themeter storage offers a more cost-effective way to support crucial grid functions, if supported by regulations and a smart metering infrastructure (Figure ES1). Although time-of-day (ToD) tariffs can encourage load to shift from peak to off-peak hours, they are too coarse and inflexible to address real-time, location-specific grid constraints (Rawson 2026a, 2026b). As India rapidly electrifies the economy and scales up renewable energy capacity, new demandside mechanisms to manage demand in real time will be essential to reduce pressure on the grid.
A demand flexibility (DF) market can help address these challenges by aggregating and coordinating DERs and aligning their use with real-time grid conditions through clear price signals. Clear pricing rules and standardised contracts between utilities and aggregators can transform these resources from unpredictable loads into dependable assets that can help resolve local network congestion, support RE aggregation, and defer the need for costly infrastructure upgrades (Electron 2024; Lovell 2025).
Currently, regulations in India allow DF to serve peak demand and provide ancillary services (Figure ES1). However, a well-functioning DF market – that is, one with multiple buyers and sellers trading services using standard contracts, open APIs, and shared data – does not yet exist. Transitioning to this market-led approach to DF will lower barriers to aggregator participation, make flexible services scalable, and help utilities meet their DF obligations within a lower-cost, loweremissions power system (Electron 2024).
Figure ES1. Demand flexibility can serve critical functions in India’s grid
Source: Authors’ analysis.
Note: BEIS = Department for Business, Energy & Industrial Strategy (UK); CEA = Central Electricity Authority (India); CERC = Central Electricity Regulatory Commission (India); DAM = day-ahead market; discom = (power) distribution company; IES = India Energy Stack; IEX = Indian Energy Exchange; MERC = Maharashtra Electricity Regulatory Commission; MoP = Ministry of Power (India); Ofgem = Office of Gas and Electricity Markets (UK); RTM = real-time market.
We surveyed the key revenue streams that are accessible to DF across mature power markets. We identified two global case studies and analysed the critical regulatory, technical, and institutional enablers that led to the integration of DF in wholesale power markets in Great Britain (GB) and Australia. We discuss the selection of markets below.
We also conducted an online survey of representatives from 14 Indian power distribution companies (discoms) and five semi-structured interviews to gain their perspective on DF opportunities, potential revenue streams, procurement preferences, and readiness to implement DF in India. Annexure 1 provides the details of the survey sample and the list of institutions we interviewed.
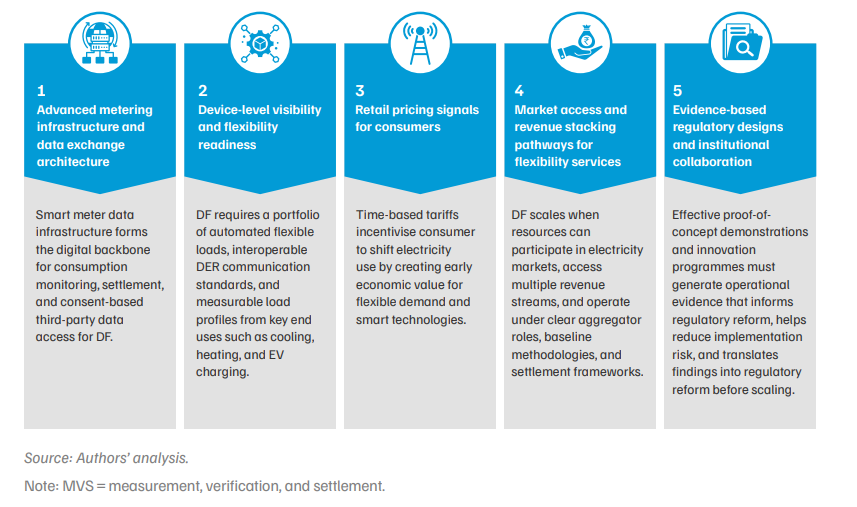
The GB and Australia cases show that scaling DR/DF requires a coordinated stack of building blocks (Figure ES2).
Figure ES2. Key building blocks (five pillars) for scaling demand flexibility
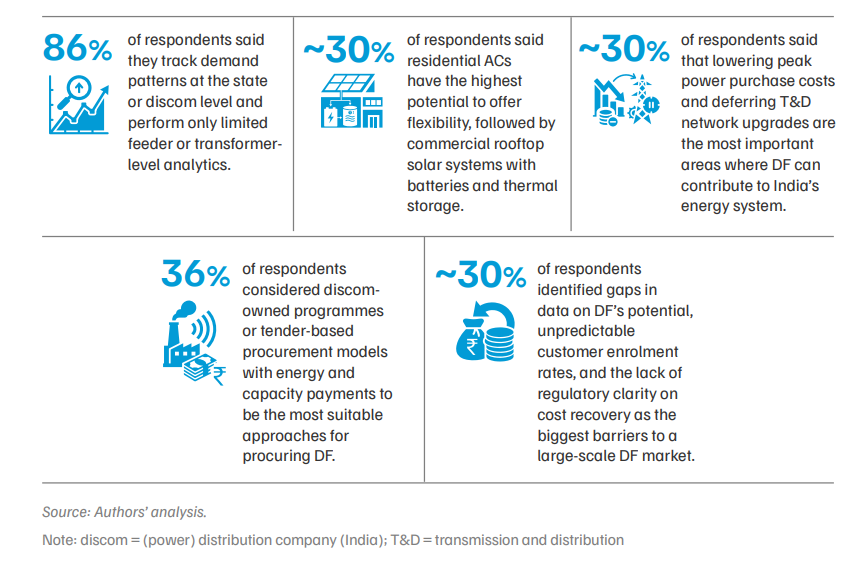
Our online survey of discom officials indicates that while discoms recognise DF as a potential resource, their ability to integrate it with regular operations remains limited due to the lack of granular data on DF’s potential benefits and uncertain consumer participation.
Respondents viewed residential cooling loads as the most promising source of flexibility. They favoured discom-led or tender-based procurement models that prioritise peak cost reduction and delay or avoid network expansion. However, gaps in data on DF’s real-time capability to reduce load during peak hours and the lack of regulatory clarity on business models, continue to inhibit confidence in scaling DF programmes (Figure ES3).
While our survey sample was limited, the results offer interesting insights into how the DF market may evolve in India and the biggest challenges that need to be addressed while integrating it.
Figure ES3. India’s demand flexibility market would require a diversity of consumer segments and business models
India’s existing regulatory and institutional enablers (Figure ES4) span all five pillars of DF creation, as outlined in Figure ES2. Notably, the Maharashtra Electricity Commission’s (MERC) 2024 regulations mark a meaningful shift in how Indian discoms approach grid flexibility, embedding DF and demandside management as core operational obligations for discoms rather than optional measures. Discoms must meet escalating DF portfolio obligations, from 1.5 per cent of peak demand in FY 2026 to 3.5 per cent by FY 2030. There are also defined financial penalties of INR 2 million/MW (INR 0.20 crore/MW) for non-compliance and an equivalent incentive for achievement beyond the obligation. The demand-side management programmes are subject to cost-effectiveness screening to protect consumers from adverse tariff impacts, and independent third-party verification ensures measurable grid benefits (MERC 2024).
Figure ES4. Current enablers for facilitating demand flexibility implementation
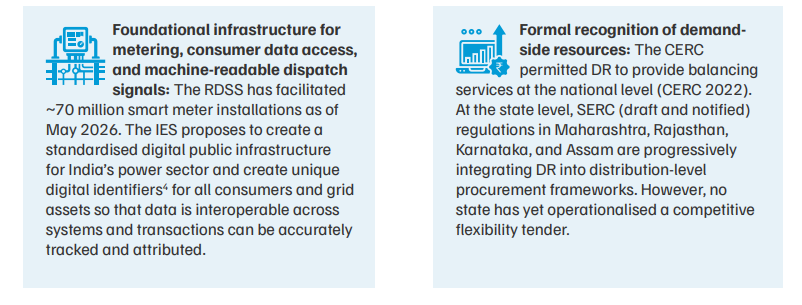
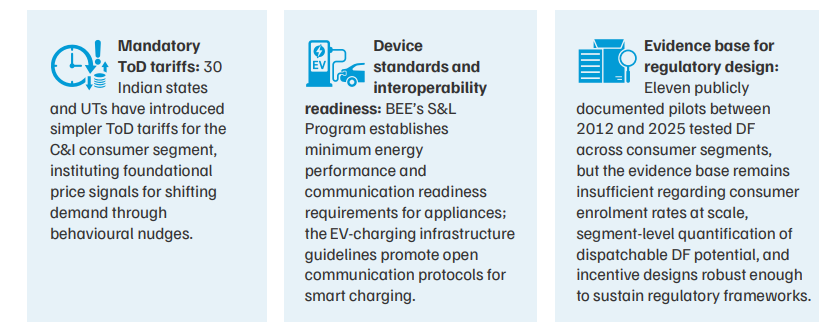
Source: Authors’ analysis based on MoP (2024, 2026); Rural Electrification Corporation (REC), Power Finance Corporation (PFC), and MoP (2021); Kallakuri et al. (2025); CERC (2022); MERC (2024); Rajasthan Electricity Regulatory Commission (RERC) (2026); Karnataka Electricity Regulatory Commission (KERC) (2025); Assam Electricity Regulatory Commission (AERC) (2024); Vasudha Foundation and BEE (2024); Malhotra et al. (2024); and Patankar et al. (2025).
The GB and Australia case studies demonstrate that while early utility-led pilots played a foundational role in support DF, scale is only achieved when flexibility is standardised, monetised across multiple value streams, and integrated into core market operations. Drawing on the combined evidence from the global case studies and consultations with Indian discoms, we identified next steps for India to establish a market for DF services in the long term (Table ES2).
Table ES2. Next steps to expedite the creation of a demand flexibility market in India
Source: Authors’ analysis based on AERC (2024); Vasudha Foundation and BEE (2024); Malhotra et al. (2024), and Patankar et al. (2025).
India’s power supply and demand has become more variable, peak-driven, and digitally coordinated; hence, the future grid will likely be fundamentally different from the present one. On the supply side, India’s renewable energy (RE) generation capacity is increasing on an unprecedented scale. The government aims to install more than 250 gigawatts (GW) of additional capacity in FY 2026–30, including significant solar and wind capacity (Central Electricity Authority [CEA] 2022). Unlike conventional thermal power generation, variable renewable energy, such as solar and wind, is weather-dependent, nonsynchronous, and often most available during hours of the day when demand is low (Abhyankar et al. 2024).
On the demand side, India has achieved nearuniversal electricity access (Agrawal et al. 2020); per capita consumption continues to rise with economic growth, urbanisation, and the increasing use of electric appliances. The growing demand for electricity for various purposes, such as air cooling, mobility, digital infrastructure, and industrial expansion, has contributed to the variability and peakiness of the power grid (Pachouri et al. 2023).
These supply- and demand-side shifts are converging with the rapid expansion of digital infrastructure: discoms have installed over 70 million smart meters as of May 2026 (MoP 2026b), and the India Energy Stack initiative (Kallakuri et al. 2025) is building digital public infrastructure to standardise transactions and data exchange in the power sector. Together, these measures advance the technical feasibility of active demand-side participation in grid operations.
Balancing supply and demand in real time will become more complex and costly as RE penetration increases and demand patterns evolve, especially if addressed solely by employing conventional supplyside resources such as coal and hydroelectric sources, and batteries (Agarwal et al. 2025; Hledik and Peters 2023). The current market structure, designed around centralised thermal generation and passive demand, is not equipped to balance the volatility of RE on the one hand and rising peak demand on the other.
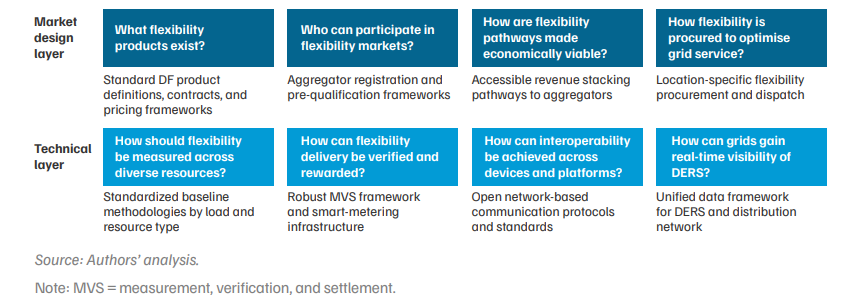
This creates a structural need to rethink how flexibility can be sourced, valued, and incorporated into the power system (Figure 1).
Figure 1. Regulations should focus on defining and standardising market design principles and the underlying technical framework to create a well-functioning, interoperable demand flexibility market
Demand flexibility (DF) refers to the capacity of demand-side loads to modulate consumption by reducing, increasing, or shifting them across the hours of the day in response to price signals or direct dispatch instructions triggered by certain grid conditions. Demand response (DR) is a subset of DF that refers specifically to event-triggered curtailment or load reduction programmes typically contracted and operated by an electricity utility. This brief uses DF as the encompassing term and DR when referring specifically to curtailment-based programmes.
Unlocking DF at scale requires regulations that focus on key components (Figure 1) beyond time-of-day (ToD) tariffs and utility-led DF programmes. ToD tariffs can shape everyday behaviour but do not help manage local congestion or short-duration peak loads. Utilityled programmes, including dynamic tools such as critical peak pricing or direct load control, are difficult to scale and operate across diverse locations and grid conditions. A well-designed DF market resolves both limitations by enabling aggregators to coordinate flexible load where and when the grid needs it the most, and to stack revenue across multiple streams, making participation commercially viable (Rawson 2026a, 2026b).
While the value of DF for consumers and the grid is generally recognised, much of it remains untapped. For example, the International Energy Agency (IEA) estimates that globally, with installed generation capacity of 8000 GW, less than 100 GW of DR is utilised (IEA 2025). To understand what it takes to unlock this potential in India, this roadmap draws on three approaches. The objective is to provide policymakers, regulators, and utilities with a structured approach to move past the ‘pilot paralysis’ stage in implementing DF (Singh et al. 2025).
First, sections 3, 4, and 5 review how DF has been demonstrated across consumer segments, the operational models through which it is delivered, and the revenue pathways it has access to globally. Second, section 6 presents case studies of the regulatory evolution in GB and Australia, examining the coordinated actions of system operators, economic regulators, distribution utilities, aggregators, and retailers that enabled DF markets to scale. Third, section 7 presents findings from a structured survey of 14 power distribution companies (discom) officials and five semistructured interviews, assessing India’s operational readiness for DF implementation. The section also outlines short and medium-term next steps for each pillar, based on the survey and global case studies. Section 8 details and consolidates the action points.
The commercial and industrial (C&I) segment has historically demonstrated the highest potential due to high load density and welldeveloped energy management systems. For example, in utility-led DR programmes in the US, most peak-demand savings come from C&I consumers, while residential programmes account for a smaller share (Federal Energy Regulatory Commission [FERC] 2024).
In the domestic sector, electrified loads such as electric vehicles (EVs), heat pumps and air conditioning enable device-level and schedulable flexibility. A large-scale smart charging demonstration in Amsterdam achieved roughly a 1.2 kilowatts (kW) reduction in peak demand per charging station under coordinated control conditions (Bons et al. 2021). In GB, field evidence shows that residential heat pumps can reduce peak demand by about 1.7 kW per unit when actively controlled (Love et al. 2017). GB’s 2023–24 Demand Flexibility Service (DFS) enrolled 2.6 million households, delivering 3.3 gigawatthours (GWh) of verified reductions through opt-in behavioural events (Figure 2) (National Energy System Operator [UK] [NESO] 2024a).
Water and wastewater utilities represent an underused but commercially viable industrial flexibility resource. The water sector is well-suited to DF due to its large, interruptible pumping loads and extensive storage infrastructure, which allow energy-intensive operations to be shifted in time without disrupting service delivery. California demonstrated a sustained 30 per cent reduction in pump power demand at a water pumping station for up to four hours per event without affecting service reliability (California Energy Commission [CEC], 2023).
Distributed energy resources (DERs) are increasingly recognised as flexibility assets. Examples include California’s Demand Side Grid Support Program, which offers incentives for load reduction through automated DER response during conditions of grid stress, and Australia’s National Consumer Energy Resources Integration Roadmap, which has designated solar panels, batteries, and EVs as foundational flexibility resources (CEC 2025; Department of Climate Change, Energy, the Environment and Water [Australia] [DCCEEW] 2024).
Across segments, the evidence shows that meaningful flexibility exists across a wide variety of loads. However, realising this potential at scale depends not just on who can flex, but on how that flexibility is operationalised. The next section examines the common models for DF globally.
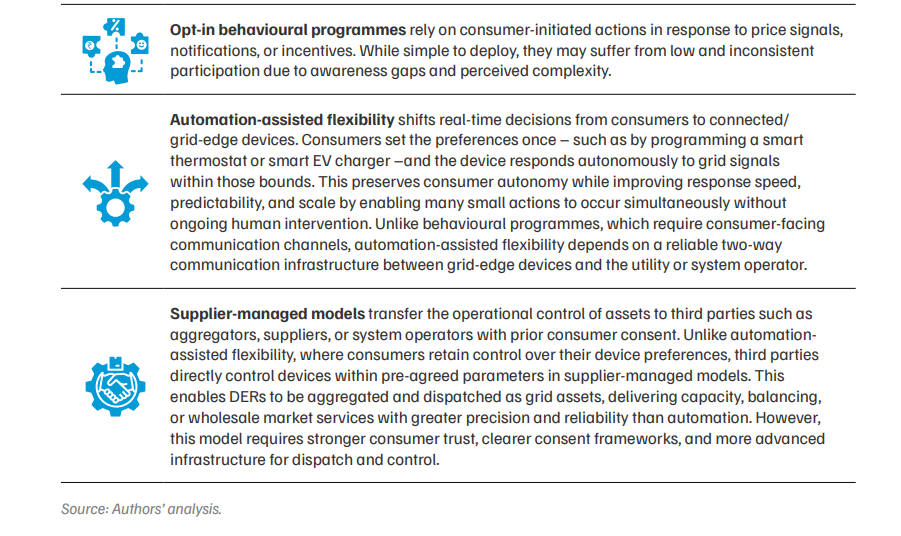
DF can be operationalised using multiple models, from behavioural programmes to supplier-managed automated interventions. DF interventions can be broadly categorised as shown in Figure 2. Each category offers increasing levels of control, predictability, and system value.
These are the most common operational models, but they can become valuable only when the economic pathways are defined and accessible. The next section provides an overview of the same across key global markets.
Figure 2. Demand flexibility interventions vary by the mode and intensity of consumer participation
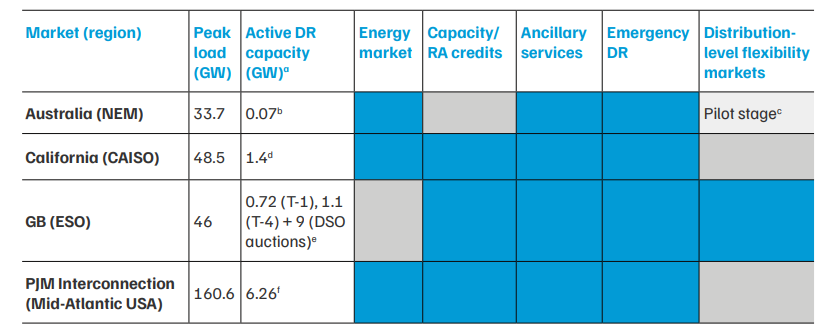
Globally, flexible resources are monetised through six major revenue streams (described in Annexure 1): (1) the capacity market, (2) the energy market, (3) the ancillary services market, (4) emergency and reliability services, (5) distribution-level/local congestion management, and (6) RE integration support services. Not all revenue streams are available in every system. Table 1 provides a comparative overview of DF integration in four major power markets in the world, based on the latest data available for 2024–25. Aggregators can stack distinct revenue streams to build a viable business case.
Table 1. Mature markets allow demand flexibility resources to earn revenue from multiple streams
Source: Authors’ analysis based on various sources (AEMO 2025a, 2025b, 2025c; FERC 2025; CAISO 2025; CPUC 2021; NESO 2021, 2024b, 2026a; Ferguson 2025; Monitoring Analytics 2025; US Energy Information Administration 2024).
Notes: Blue cells indicate established access or availability of the DR revenue stream. Grey cells indicate that the revenue stream does not exist in that market. The markets only consider downward flexibility (DR), except in PJM and GB, where market rules also accommodate upward flexibility from demand-side resources in balancing/ancillary markets. AEMO = Australian Energy Market Operator; ARENA = Australian Renewable Energy Agency; CAISO = California Independent System Operator; CPUC = California Public Utilities Commission; dEX = decentralised exchange; DNSP = distribution network service provider; DSO = distribution system operator; ESO = electricity system operator; GW = gigawatt; NEM = National Electricity Market (Australia); RA = resource adequacy; WDRM = wholesale demand response mechanism.
Table 1 reveals several cross-cutting patterns in how DF is monetised across markets, discussed below. Utility and supplier-led DR programmes serve as the most widely accessible entry point for demand-side participation, often preceding formal aggregator access to markets. For example, in California, utilities such as the Pacific Gas and Electric Company (PG&E) began offering SmartAC (direct-load control programmes for residential air conditioners [ACs] using smart thermostats) in 2007, seven years before the California Independent System Operator (CAISO) opened market access to third-party aggregators (California Public Utilities Commission [CPUC] 2014; PG&E 2008). Such programmes are available to residential and C&I consumers in all four markets listed in Table 1, employing tariff-based mechanisms, such as Time-of-Use (ToU) and critical peak pricing, as well as incentive-based, automation-assisted DR primarily designed for load curtailment or shifting.
Emergency DR is an established service across all four major markets. In PJM Interconnection (a Mid-Atlantic USA power market) and CAISO, DR programmes with pre-registered resources are activated by the system operator during declared emergencies, with availability payments and performance verification managed through utilities or contracted aggregators (CPUC 2023; Monitoring Analytics 2025). The Australian Energy Market Operator (AEMO) procures emergency reserves outside the energy market for dispatch during forecast shortfalls (AEMO 2024). In GB, NESO pays households and businesses to reduce electricity use during peak stress periods to support system reliability (NESO 2026b). In all cases, the system operator declares emergency conditions and manages the dispatch, while the programme administrator (e.g., the utility, a market operator, or an aggregator) contracts with consumers, validates response and makes payments for availability and actual performance.
PJM and GB have enabled demand-side resources to compete alongside conventional generation in forward capacity auctions and earn capacity payments in exchange for firm curtailment commitments (through utilities or third-party aggregators). Capacity market participation offers a more predictable revenue stream than eventbased or out-of-market emergency DR. Resources with capacity credits can also be dispatched during emergencies, making the two mechanisms complementary rather than strictly mutually exclusive.
In the absence of a formal capacity market, California has adopted an alternative model where resource adequacy (RA) obligations are assigned to utilities and retail electricity suppliers through bilateral contracts. Demand-side resources can qualify for a utility’s RA planning if they meet the firm delivery, telemetry, and availability requirements set by CAISO and CPUC. Notably, this framework accommodates both utility-led and aggregatorled procurement channels within the same RA structure. In the summer of 2024, approximately 80 per cent of the 1.4 GW DR capacity participating in the RA programme was delivered through utility-led programmes and the remainder through third-party aggregators (CAISO 2025).
Beyond central wholesale and capacity mechanisms, GB has developed the largest local flexibility market in the world, creating an additional location-specific revenue stream for distributed assets. The UK regulatory framework RIIO-2 (revenue = incentives + innovation + outputs) incentivises distribution utilities to procure flexibility as a cost-effective alternative to network reinforcement (Department for Business, Energy & Industrial Strategy [UK] [BEIS] and Office of Gas and Electricity Markets [UK] [Ofgem] 2021). Independent platforms such as Piclo Flex enable distribution system operators (DSOs) to publish locational flexibility requirements and run competitive tenders for standardised DF products (Piclo 2023), allowing distributed asset owners to stack local revenues on top of wholesale and capacity market earnings.
The next section deep-dives into two international case studies to define the regulatory, policy, technical and institutional changes required to enable DF access to some of the revenue streams that were discussed above.
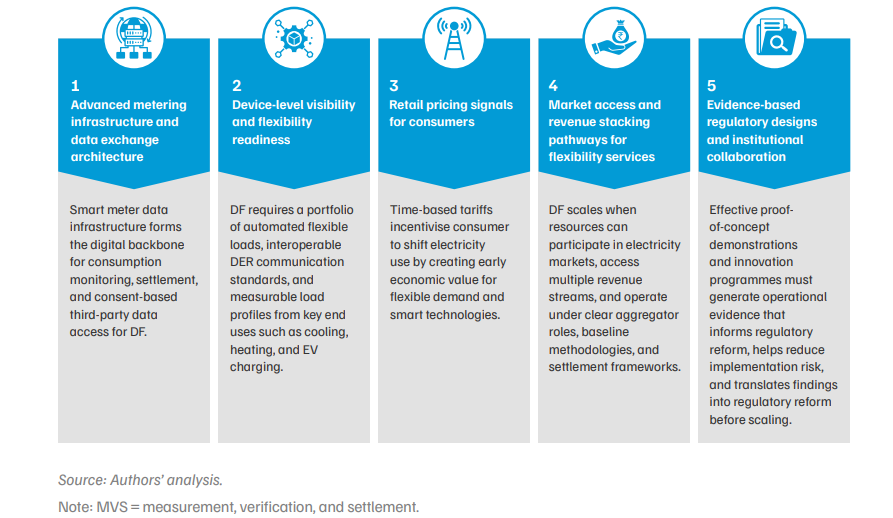
Our review of global DF market developments suggests that even when DF’s technical potential is high, delivery at scale depends on the coordinated evolution of five pillars: (1) advanced metering infrastructure (AMI), data exchange, and consent architecture; (2) device-level visibility and flexibility readiness; (3) consumer-facing price signals; (4) market access and revenue-stacking pathways for flexibility services; and (5) evidence-based regulatory designs and institutional collaboration. This five-pillar framework that structures our analysis is detailed in Annexure 2.
The two case studies that follow illustrate how these five interdependent pillars progressively enabled market access for different DF services in GB and Australia. Both case studies demonstrate that no single reform is sufficient on its own (Figure 3). The institutional structure of the GB and Australian power markets is described in Annexure 3.
Figure 3. Scaling demand flexibility requires coordinated progress across five interdependent pillars, from metering and data infrastructure to governance
GB’s power system is characterised by high RE penetration (44 per cent of electricity production in 2025), winter-peaking demand, declining winter reserve margins, and increasing local grid congestion due to the rapid uptake of DERs such as rooftop solar panels, EVs, and heat pumps (NESO 2026a). Increased variability on both the supply and demand sides requires additional balancing by the NESO. Consequently, NESO’s balancing-service spending jumped from GBP 949 million in 2021–22 to GBP 2.6 billion in 2022–23, with the costs borne by consumers through higher system charges (NESO 2023a). Additionally, localised grid congestion is strengthening the case for flexibility as a least-cost alternative to infrastructure investment. Modelling studies estimate that scaling flexible demand could save between GBP 30 billion and GBP 70 billion in system costs over 2020–50 (Department for Energy Security & Net Zero [UK] (DESNZ), Ofgem, and NESO 2025). National policy frameworks prioritise enabling flexible demand to reduce system costs, support RE integration, and improve network efficiency (BEIS and Ofgem 2017, 2021; DESNZ, Ofgem, and NESO 2025).
We analyse the steps that led to the evolution of a DF market in GB, based on the five-pillar framework discussed above. Figure 4 summarises the major system gaps identified and the institutional and regulatory interventions introduced to address them.
Pillar 1: Advanced metering infrastructure, data exchange, and consent architecture
Pillar 2: Device-level visibility and flexibility readiness
Pillar 3: Consumer-facing price signals
Peak and off-peak tariffs have been available to consumers in GB since the late 1970s. As the smart meter roll-out provided access to more interval data starting in 2013, retailer-specific dynamic tariffs such as Octopus Agile (Octopus Energy n.d.) emerged to enable consumers to benefit from wholesale price fluctuations. The Market-wide Half-Hourly Settlement (Ofgem 2021) proposes to further enable this by aligning supplier costs with actual half-hourly consumption, creating a strong incentive to offer ToU tariffs. Personalised tariffs based on consumption patterns also increase the value of flexible technologies for consumers.
Pillar 4: Market access and revenue stacking pathways for flexibility services
Pillar 5: Evidence-based regulatory designs and institutional collaboration
Figure 4. Demand flexibility in GB evolved through coordinated market reforms, regulatory incentives with a strong emphasis on cost-effectiveness, and revenue-stacking pathways (2014–30)
Case study 2: Australia’s demand flexibility road map
With rooftop solar units generating over 25 per cent of its energy, Australia has the highest per-capita rooftop solar penetration globally (AEMO 2026). This has resulted in frequent midday demand troughs, steep evening ramps, and rising wholesale price volatility (Australian Energy Regulator [AER] 2025). Further, the lack of visibility of virtual power plant operations leads to increased errors in demand forecasting, exacerbating the procurement costs of frequency control ancillary services (Australian Energy Market Commission [AEMC] 2024b; AEMO 2023b). At the same time, the high wholesale price spreads and growing DER ownership present an increasingly convincing case for the economic viability of flexible resources. Fully orchestrated flexibility from gridconnected DERs could generate system-wide savings of AUD 14 billion annually by 2050, primarily through avoided investments in generation, storage, and networks (Energeia 2025). Therefore, the primary goal of the government is to convert the growing DERs into coordinated and dispatchable portfolios that behave like virtual power plants (DCCEEW 2024).
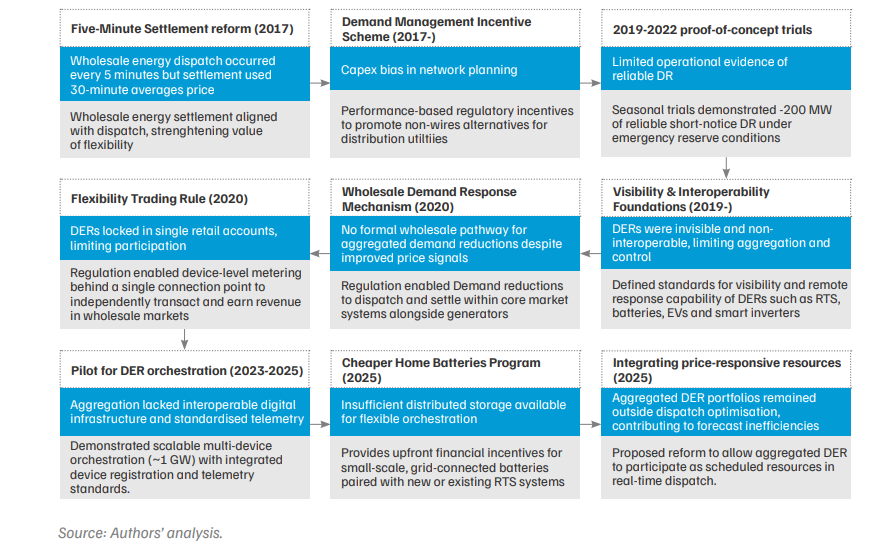
Figure 5 summarises the major system gaps identified and the institutional and regulatory interventions introduced to address them.
Pillar 1: Advanced metering infrastructure, data exchange, and consent architecture
Pillar 2: Device-level visibility and flexibility readiness
Pillar 3: Consumer-facing price signals
Retail tariff reforms under the ‘power of choice’ programme supported the implementation of costreflective ToU and demand-based network tariffs to reflect peak network costs and encourage consumers to shift consumption away from congested periods (AEMC 2012). Several Australian retailers have introduced ‘solar sponge’ tariffs, which offer very low or zero import prices during periods of high solar generation, directly incentivising households to shift flexible loads such as EV charging, hot water systems, and pool pumps to these periods (AEMC 2021). The Australian government is also introducing the Solar Sharer Offer from July 2026, a new electricity pricing plan that will give all households access to free daytime power during peak solar generation, thereby helping to lower bills and make optimal use of Australia’s excess solar energy (DCCEEW 2025). Collectively, this constitutes the consumer-facing price signal layer in Australia’s DF architecture.
Pillar 4: Market access and revenuestacking pathways for flexibility services
Pillar 5: Evidence-based regulatory designs and institutional collaboration
Figure 5. Demand flexibility reforms in Australia were sequenced through iterative market rules, changes in technical codes, and proof-of-concept demonstrations (2017–25)
As these case studies show, a pathway or single destination when developing a DF market. Different systems, through incremental reforms, can make progress towards better integration of demand-side resources. Critically, GB’s case study demonstrates that early utility-led programmes and pilots play a foundational role, but scale is achieved only when flexibility is standardised, monetised across multiple value streams, and incorporated into core market operations.
The next section discusses the status of each pillar of market creation in India, the remaining gaps, and the steps needed to fill them in the short and medium term.
In this section, we discuss the status of each of the five DF market pillars in India. The case studies discussed above illustrate how DF markets emerge from the coordinated actions of system operators, economic regulators, distribution utilities, aggregators, and retailers. We complement these insights from the structured survey responses from 14 Indian power distribution companies (discoms) and five semi-structured interviews. Annexure 4 provides details of the survey sample and the list of institutions interviewed. In India’s context, we focused on gathering insights from discoms as they serve multiple important roles in the market creation process – as electricity retailers, operators of the distribution network, or custodians of consumer data. They are crucial to the running of DR programmes with regulatory oversight.
institutions must take the lead in implementing (1) urgent, short-term interventions and (2) mediumterm interventions that require further evidence and consensus amongst stakeholders. This effort must be coordinated across regulators, market operators, and distribution utilities responsible for operationalising flexibility markets and embedding demand-side resources in planning.
Pillar 1: Advanced metering infrastructure, data exchange, and consent architecture
As the review of GB and Australian DF markets demonstrates, smart metering and consent-based access to the obtained data by consumers, utilities, and third parties are essential to inform tariff design, baselines, measurement, verification, and settlement; they are the building blocks of any DF market.
Figure 6. None of the surveyed discoms currently use smart meter data to understand demand drivers (n = 14)
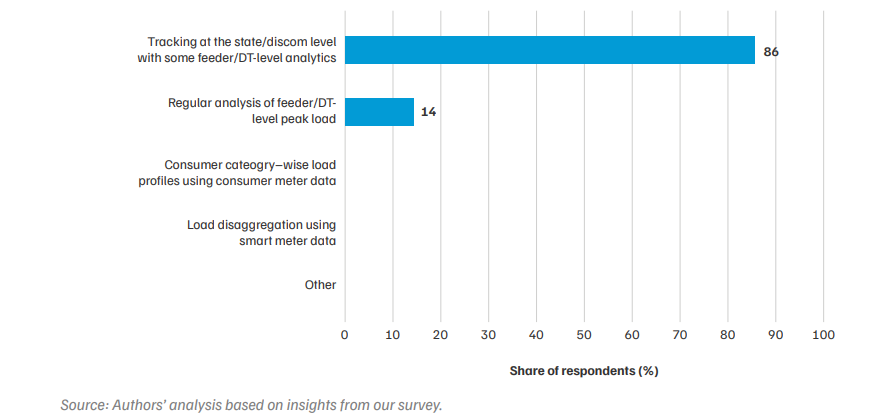
Indian distribution utilities have installed about 70 million cumulative consumer-, distribution transformer (DT)- and feeder-level smart meters as of May 2026 (MoP 2026). However, the analytical utilisation of interval data from smart meters for load research, consumer segmentation, and planning remains limited (Figure 6).
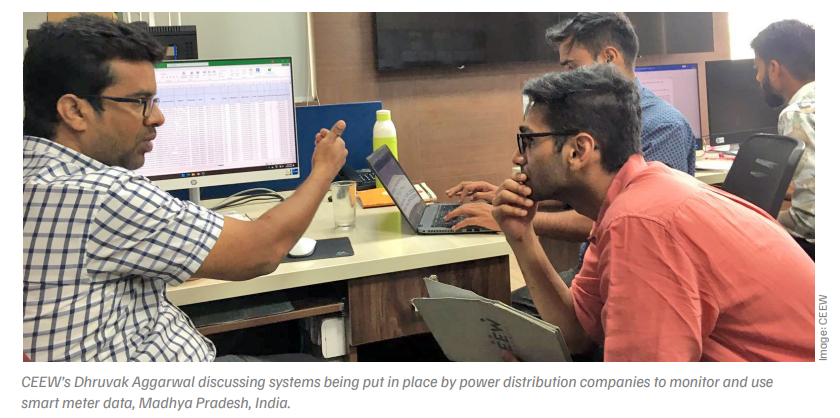
Consultations with discom officials indicate that while consumers with smart meters can view their consumption data through utility or AMI service provider–managed apps, the quality and depth of the analytics vary across discoms, from basic bill summaries and digital payment alerts to readable interval-level consumption graphs.
There is also no standardised digital consent mechanism by which consumers can authorise third parties to access their smart meter data, limiting the ability of aggregators and flexibility service providers to develop consumer-facing services.
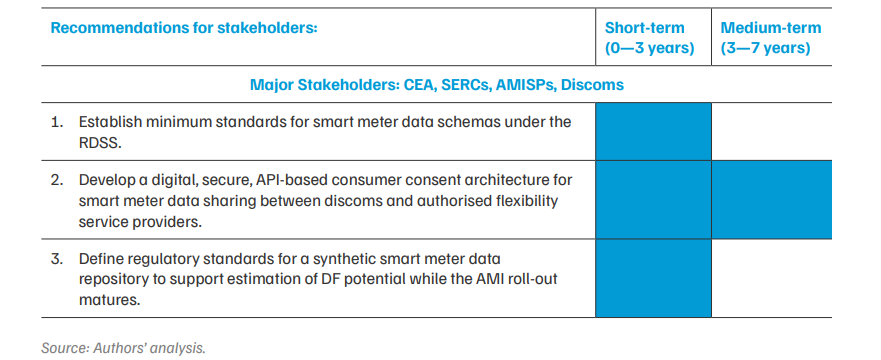
Table 2 lists three crucial enablers that can facilitate API-based data portability and address the limited analytical use of smart meter data. The standards should be developed in the short-term, integrated with existing power sector schemes wherever possible, and mandated for adoption in the medium-term.
Table 2. In India, smart meter data architecture needs to address three key issues to enable demand response
Pillar 2: Device-level visibility and flexibility readiness
This pillar refers to the grid-level visibility of distributed assets such as ACs, batteries, EV chargers, and grid-interactive building systems and their technical capacity to respond to grid signals through various interventions.
Residential ACs and behind-the-meter battery storage in C&I contexts have emerged as the most prominent end uses with DF potential, according to the surveyed discom officials (Figure 8). Perceived DF capacity by end users varied across discoms based on their consumer mix. In Delhi, nearly 40 per cent of the evening peak load is estimated to come from residential ACs (Ansari et al. 2024), making them the preferred equipment for discoms. In Gujarat, the high rooftop solar penetration (Ministry of New and Renewable Energy [MNRE] 2026) makes it suitable for integration with the battery energy storage systems for flexibility. In Mumbai, municipal water treatment is a proven flexible end use (Tata Power Company Limited 2024).
Buildings are also central in this context because they contain multiple flexible end uses, such as space cooling, EV charging, thermal storage, and behind-themeter batteries. Global evidence shows that smart, connected buildings equipped with controls and DERs can help materially reduce system costs and emissions (Satchwell et al. 2021). This is consistent with the survey insights, where 21 per cent of the surveyed discoms ranked commercial buildings as the segment with the highest relative DF potential (Figure 7).
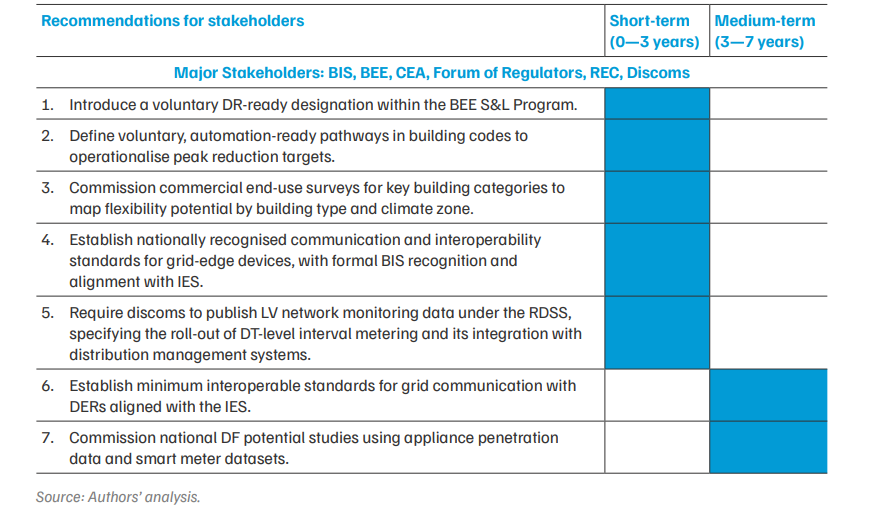
Realising this DF potential requires building the stock of grid-responsive devices, establishing the standards to measure and verify their response, and planning for low voltage (LV) network visibility of grid-edge devices for DER orchestration in the future (Table 3).
Addressing these gaps would allow India’s existing energy efficiency policy foundations to extend into a device layer that is measurable, interoperable, and structurally aligned with scalable flexibility markets.
Figure 7. Heating, ventilation, and air conditioning (in the residential segment) and BESS (in the C&I segment) have the highest perceived DF potential (n = 14)
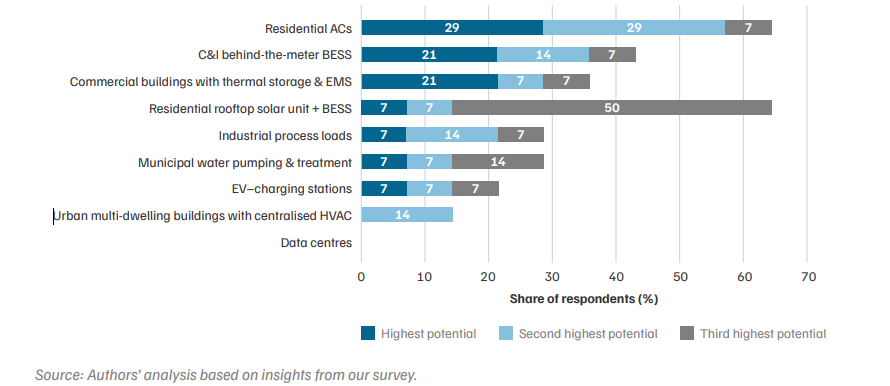
Table 3. Coordinated reforms across appliance standards, building codes, and communication protocols are needed to enable grid-responsive devices
Pillar 3: Consumer-facing price signals
Retail electricity tariffs create economic signals that motivate consumers to shift or reduce load in response to system conditions (Faruqui et al. 2017). The global case studies show that ToU and dynamic tariffs often precede or co-exist with formal DF market reforms (see Boxes 1 and 2).
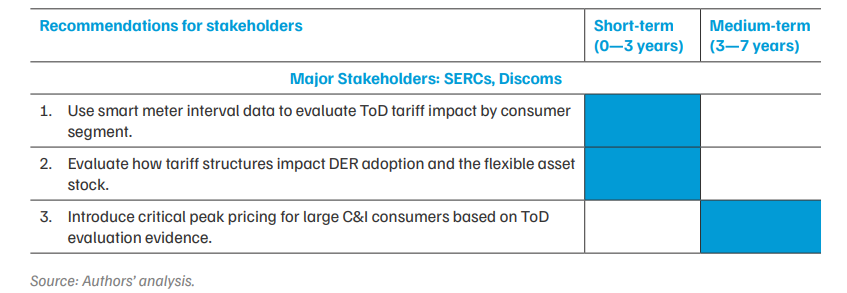
By 2025, 30 Indian states and union territories had introduced the simpler time-of-day (ToD) tariffs (Malhotra et al. 2024), but only eight extended them to domestic consumers, and just seven offered any rebate during solar hours. Despite the widespread roll-out, there is limited evidence of the effectiveness of ToD tariffs in shifting load in India. This is partly due to the nascent level of smart meter penetration in most states and to the lack of regular measurement and analysis of how individual- or consumer-level load profiles respond to tariff signals. Table 4 identifies the short and medium-term actions for improving retail tariff signals for consumers.
As tariffs remain the most widely used lever to modify consumer behaviour, strengthening ToD design is essential to establish consumers’ baseline familiarity with DF.
Table 4. Strengthening time-of-day tariff design and evaluation is the most immediate strategy for building consumer familiarity with demand flexibility in India
Pillar 4: Market access and revenue-stacking pathways for flexibility services
Australia’s experience shows that integrating DF through a single, energy-only wholesale market yields limited registered capacity, while GB’s approach of opening multiple revenue streams across capacity, balancing, and local flexibility markets has enabled participation at a much larger scale (Boxes 1 and 2). This pillar discusses key reforms that will enable similar uptake and scaling of DF.
Currently, Indian regulations allow DF to provide secondary and tertiary ancillary services in the national market (Central Electricity Regulatory Commission [CERC] 2022) and peak load services at the state level (Maharashtra Electricity Regulatory Commission [MERC] 2024) – both facilitated by aggregators.
Survey responses and stakeholder consultations indicate that the perceived value of flexibility varies across discoms depending on the system characteristics (Figure 8). Utilities managing dense urban networks, for example, in Delhi and Mumbai, emphasised the potential of flexibility to defer distribution infrastructure upgrades where land availability is limited. In contrast, discoms in states with higher RE penetration, such as Gujarat, highlighted the usefulness of flexibility in managing load to absorb RE generation and maintain grid stability.
Figure 8. Savings in power purchase costs and network investments are demand flexibility’s biggest perceived value proposition (n = 14)
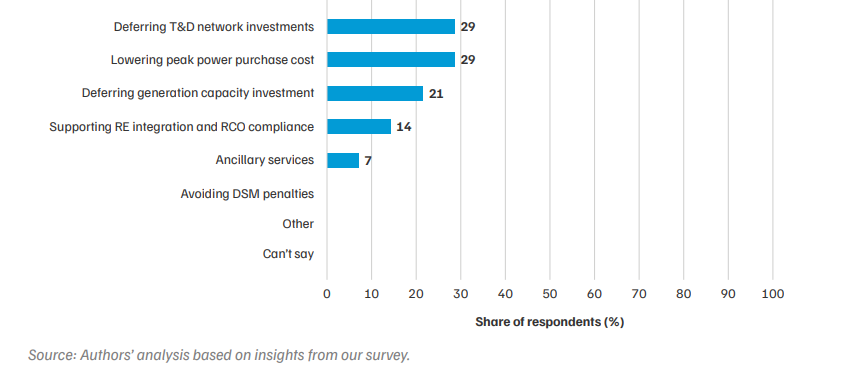
Mumbai, emphasised the potential of flexibility to defer distribution infrastructure upgrades where land availability is limited. In contrast, discoms in states with higher RE penetration, such as Gujarat, highlighted the usefulness of flexibility in managing load to absorb RE generation and maintain grid stability.
The value of a specific flexibility service to a discom, and therefore the price it is willing to pay, depends on the avoided costs of the particular system it addresses, such as deferred network investment and reduced peak power purchase or ancillary service procurement.
Together, these energy and capacity revenue streams show that a combination of fixed and performance-based payments can help balance the cost of deploying flexibility services, particularly for hardware-intensive interventions. Global evidence also suggests that aggregators need access to multiple value streams simultaneously to justify the investment in automation, enrolment, and coordination that flexibility at scale requires (Briggs et al. 2023).
Figure 9. Top buyers on the IEX’s DAM and RTM procure marginal power at an average buy price of INR 3 to INR 6 per kilowatt-hour
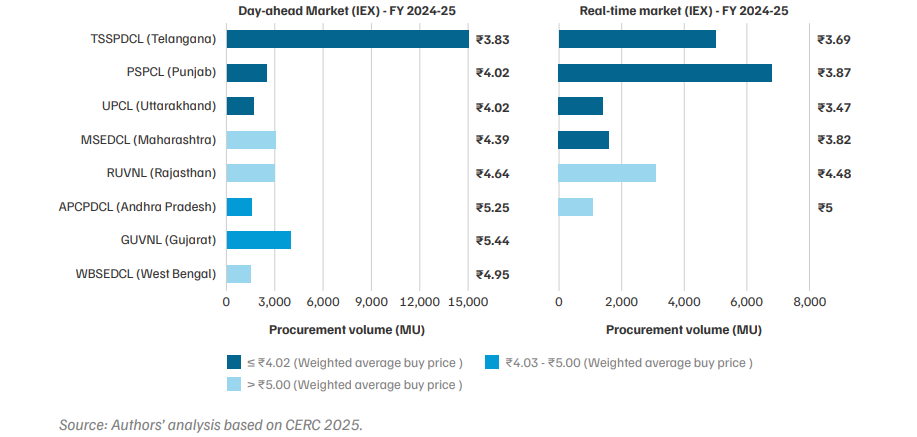
Figure 10. Most respondents prefer bilateral procurement of demand flexibility services with energy plus capacity payments (n = 14)price of INR 3 to INR 6 per kilowatt-hour
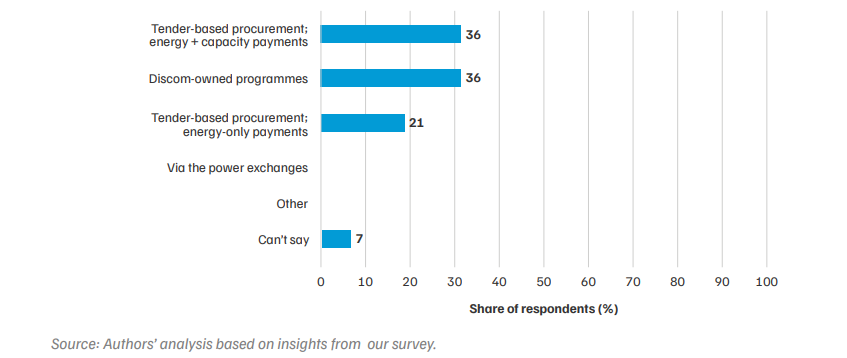
About 36 per cent of the surveyed discoms were open to combining energy and capacity payments if the peak reduction and potential network expansion deferral value were demonstrable and regulatorapproved (Figure 10). Our consultations revealed that many discoms prefer not to procure DF through power exchanges, as flexibility needs are typically location-specific rather than driven only by systemwide peak shortages. Utilities, therefore, prefer to have their own programmes, where they can target DF as needed or use location-tagged procurement models for distributed flexibility services (Table 5).
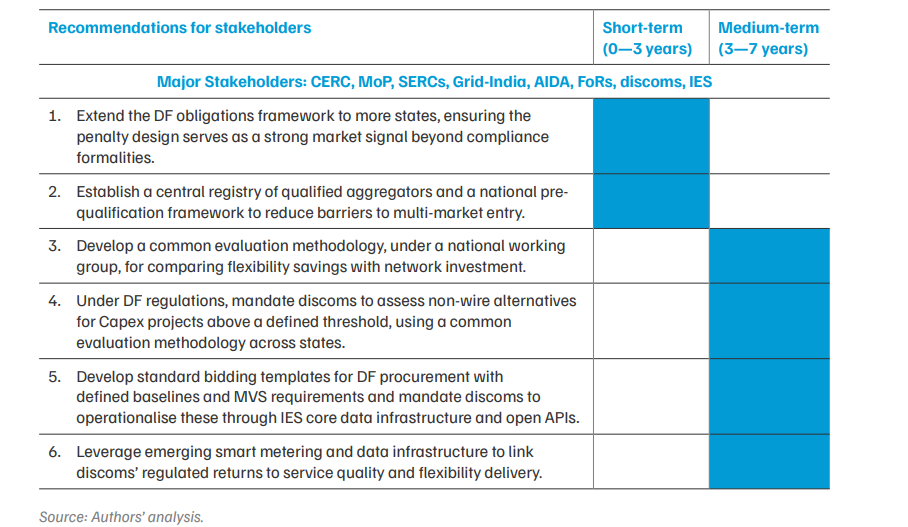
Table 5 identifies the short and medium-term actions needed across market design, regulatory frameworks, and digital infrastructure to establish the foundations for a DF market in India.
The GB and Australia case studies show that regulators and system operators played a central role in incentivising DF uptake, defining third-party aggregators, and providing them access to revenue streams. This facilitated the transition towards an open, interoperable ecosystem with standardised products and unified data sharing, instead of monolithic utility silos. India’s regulatory bodies are well placed to lead a similar evolution, building on the foundations that state-level regulations have begun to establish.
Table 5. India needs a clearer market design and stronger regulatory incentives to enable discoms and aggregators to participate in and scale demand flexibility
Pillar 5: Evidence-based regulatory designs and institutional collaboration
GB’s Open Networks programme and ARENA’s portfolio retrospective demonstrate that the institutional architecture for gathering and acting on evidence matters as much as the evidence itself (Boxes 1 and 2). This pillar focuses on evidence generation and regulatory feedback mechanisms, which enable DF to move beyond isolated pilots.
Despite the 11 documented pilots conducted in 2012–25 (Patankar et al. 2025), evidence on consumer enrolment, segment-level DF potential, and successful incentive designs remains insufficient to anchor regulatory reform. A few pilots, such as Tata Power’s residential behavioural and automationassisted DR programmes, have demonstrated consumer participation across multiple seasons, but their findings remain limited in scale, geography, and consumer diversity (Tata Power Company Limited 2024; Singh et al. 2025). Building a robust evidence base for regulation requires demonstrations at a much larger scale, spanning multiple states, consumer segments, and load types and running long enough to capture seasonal and operational variability. These are the features that enabled Australia’s ARENA-funded RERT pilot to institutionalise utility-led DR programmes and inform market regulations (see Box 2).
MERC’s cost recovery framework requires programmes to demonstrate cost-effectiveness and long-term tariff reduction; hence, it may not be suitable for early-stage demonstrations, whose value lies precisely in generating that evidence. Discom officials consulted in this research cited the absence of a sandbox mechanism as a specific barrier to testing new business models before committing to scale. Our survey also found that unpredictable consumer enrolment rate, lack of regulator-approved cost recovery frameworks and insufficient data to identify flexibility potential are the three biggest perceived barriers to DF market development (Figure 11). These barriers are directly related to insufficient evidence generation.
Figure 11. The lack of cost-recovery frameworks and limited data for valuing demand flexibility are one of the biggest challenges to creating a large-scale demand flexibility market (n = 14)
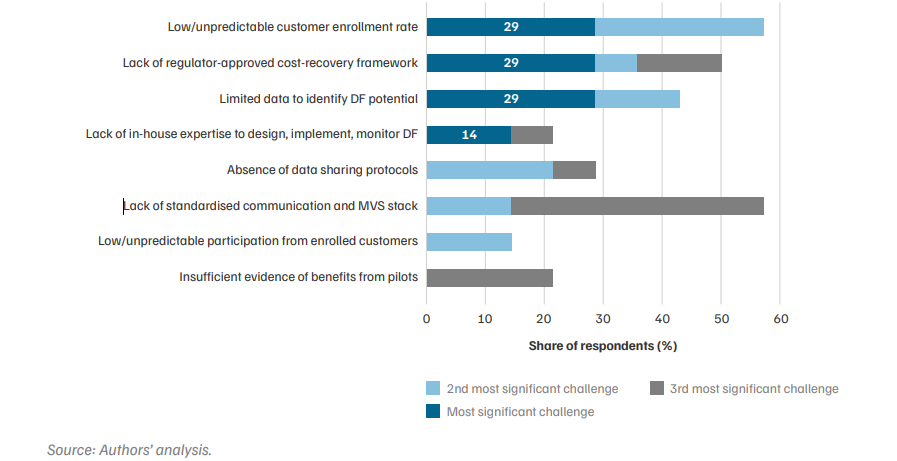
If each discom develops its own approach to baseline measurement, product definition, and procurement frameworks, this leads to fragmentation, raises aggregator entry costs, prevents cross-state market development, and makes it challenging for regulators to assess whether programmes are being designed or procured effectively. In the UK, this problem was resolved through an eight-year-long multi-stakeholder programme, Open Networks, which iteratively standardised contracts, products, and evaluation frameworks across all distribution operators before concluding in 2025 (Box 1). Discom officials also identified the lack of in-house expertise to design, implement, and monitor DF as a significant barrier (Figure 9), which a shared institutional infrastructure can address more efficiently than each discom independently.
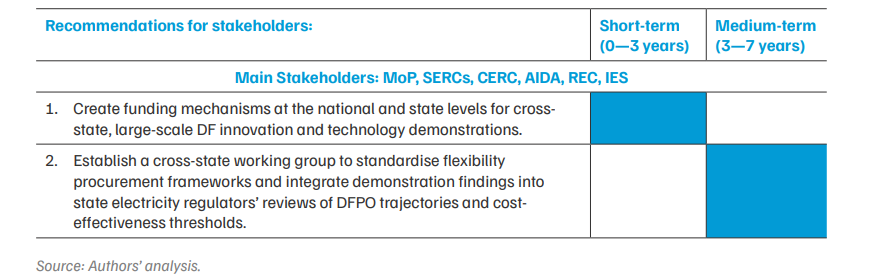
In conclusion, our findings indicate a gap between experimentation and regulatory integration, which is addressed in Table 6.
Addressing these gaps simultaneously with market design and monetisation frameworks will be essential for building the credibility and confidence needed to scale DF.
Table 6. Building a structured evidence base and institutional feedback loop is essential to move demand flexibility from isolated pilots to scalable programmes
The following section details the action points introduced in Section 7, organised under the same five-pillar framework. The recommendations are not sufficient in isolation. Earlier actions create the foundations that later interventions depend on. For example, metering infrastructure enables tariff reform, tariff signals expand the flexible asset stock, and market access mechanisms determine whether aggregators can monetise that stock at scale. The steps are for short-term priority (0-3 years), unless otherwise noted.
Pillar 1: Advanced metering infrastructure, data exchange, and consent architecture
Pillar 2: Device-level visibility and flexibility readiness
Pillar 3: Consumer-facing price signals
Pillar 4: Market access and revenuestacking pathways for flexibility services
Pillar 5: Evidence-based regulatory designs and institutional collaboration
India stands at an inflection point: With over 65 million smart meters deployed, emerging regulatory frameworks, and a rapidly growing DER base, the foundational conditions for a DF market are taking shape. Yet infrastructure alone is insufficient. As the experiences of GB and Australia demonstrate, sustained scaling requires coordinated progress across metering, device standards, price signals, market access, and evidence-based regulation. India must move decisively from pilots to programmes, transitioning distributed loads from passive consumers into active grid assets. A well-designed DF market will not only lower system costs but also accelerate the clean energy transition.
This CEEW–CNZ report examines how India can build a demand flexibility (DF) market where distributed energy resources such as EVs, smart ACs, rooftop solar, and storage can be coordinated to serve grid needs in real time. Targeted at policymakers, regulators, discoms, and aggregators, the report presents a five-pillar road map drawing on global case studies and a discom survey, with actionable near-term (0-3 years) and medium-term (3-7 years) steps to move India from isolated pilots to a structured, scalable DF market.
Demand-side management (DSM) programmes in India have historically focused on efficiency improvements and broad load reduction, often through utility-driven initiatives. A demand flexibility market goes further — it enables distributed energy resources to actively participate in electricity markets, access multiple revenue streams (energy, capacity, ancillary services), and operate under standardised contracts and open data platforms. While DSM is utility-led and programme-based, a DF market is a structural, competitive mechanism where multiple buyers and sellers, including third-party aggregators, trade flexibility services at scale.
The report identifies five foundational building blocks based on global experience and India-specific analysis. The first is advanced metering infrastructure and data exchange architecture — standardised smart meter data schemas, consumer consent frameworks, and API-based third-party access. The second is device-level visibility and flexibility readiness — nationally recognised communication standards for grid-edge devices like smart ACs, EV chargers, and grid-connected batteries. The third is retail pricing signals for consumers — updated time-of-day tariff designs evaluated using smart meter interval data. The fourth is market access and revenue stacking for aggregators — extending demand flexibility portfolio obligations, establishing aggregator registries, and mandating open APIs for procurement. The fifth is evidence-based regulatory design and institutional collaboration — a competitive national demonstration fund, harmonised baseline and bidding methodologies, and channelling pilot findings into state and central regulatory reviews.
Great Britain's experience shows that clear market rules, standardised contracts, digital infrastructure (such as the Half-Hourly Settlement reform), and a regulatory framework enabling revenue stacking across capacity, balancing, and distribution markets were decisive. GB's local flexibility market grew from no formal procurement in 2019 to approximately 9 GW by 2025. Australia's context, characterised by the world's highest per-capita rooftop solar penetration, highlights the importance of interoperability standards for distributed energy resources, regulatory sandboxes to test mechanisms before scaling, and improving utility visibility of DERs. As of May 2025, about 70 MW of DERs participate in Australia's Wholesale Demand Response Mechanism, with regulatory reforms now aiming at full integration into the wholesale market.
The study's survey of 14 discom representatives found that while discoms recognise demand flexibility as a potential resource, their operational integration of it remains limited. Most track demand only at the state or discom level and conduct limited feeder-level analytics. Discom respondents prefer discom-led or tender-based procurement models that prioritise peak cost reduction over open market mechanisms. Their foremost concerns are insufficient granular data on DF's real-time load-reduction potential, unpredictable consumer enrolment, and the absence of regulatory clarity on cost recovery for DF programmes.
The India Energy Stack (IES) aims to create a standardised digital public infrastructure for India's power sector, assigning unique digital identifiers — analogous to Aadhaar for individuals — to every consumer connection, meter, and grid asset. This would enable data to be interoperable across systems and allow transactions to be accurately tracked and attributed. For demand flexibility, the IES is critical because it can break down utility data silos, enable API-based third-party access for aggregators, and create the consent architecture needed for consumers to share their smart meter data with flexibility service providers.
The report recommends several near-term actions. Under metering and data, these include standardising meter data schemas under RDSS and enabling API-based third-party access via the IES. For device standards, the report recommends introducing a DR-readiness category within BEE's Standards and Labelling programme and establishing nationally recognised communication standards for grid-edge devices. On market access, it calls for extending the Demand Flexibility Portfolio Obligation framework to more states with proportionate penalties, establishing central aggregator registries, and mandating discoms to publish location-specific network congestion data. On evidence generation, the report recommends a competitive, grant-based national demonstration fund for multi-state DF programmes and a harmonised baseline methodology across states.
How Should Indian States Choose New Power Generation Capacity?
Contracts for Difference for Flexible and Affordable Clean Power
Enabling Corporate India's Clean Energy Transition
Scaling Solar Power for Irrigation in India: