Council on Energy, Environment and Water Integrated | International | Independent
Suggested Citation: Aggarwal, Prateek, Vishal Tripathi, and Harsha V. Rao. 2026. Enabling Corporate India's Clean Energy Transition: Reforming Open Access Framework and Tariff Design for the Next Decade. New Delhi. Council on Energy, Environment and Water.
A manufacturing-led economic transformation, anchored by emerging sectors such as AI-enabled digital infrastructure and green hydrogen, is one of the pillars of India's Viksit Bharat 2047 ambition. Manufacturing’s share of GDP is targeted to rise from around 17 per cent today to 25 per cent by 2047. Achieving this goal will depend on the ability of Indian businesses to remain competitive in both domestic and global markets. Yet, in an increasingly volatile geopolitical environment, businesses are becoming more vulnerable to energy supply disruptions and price volatility, with significant implications for their competitiveness.
The need to enhance competitiveness has driven Commercial and Industrial (C&I) consumers to widen their renewable energy (RE) procurement choices beyond distribution companies (discoms). Discoms and non-discom RE routes accounted for ~23 per cent of C&I electricity consumption in 2025. Three structural shifts are now redefining corporate RE procurement. First, the sharp decline in storage costs is enabling reliable, dispatchable renewable power to emerge as a cost-competitive and domestically available solution. Second, evolving global standards are placing increasing pressure on companies to decarbonise their operations and supply chains. Third, ongoing regulatory and retail tariff reforms are pushing towards mechanisms that ensure C&I consumers fairly compensate discoms for the services they provide. Together, these trends are transforming both the economics and architecture of corporate clean energy procurement, while the existing open access framework has yet to evolve in step with these changes.
Against this backdrop, this report analyses the interaction between the ongoing tariff rationalisation efforts and the open access charges framework and how the two remain disconnected. We studied six open access (OA) charges that govern this market: cross-subsidy surcharge (CSS), additional surcharge (AS), standby charge, banking charge, parallel operation charge (POC), and wheeling charge. We examine how each charge is designed, where and why it fails, and what specific reforms are needed to create a level playing field across the discom and non-discom routes.
A manufacturing-led economic transformation, supported by the rise of sunrise sectors such as AI-driven digital infrastructure and green hydrogen, is one of the pillars of India's Viksit Bharat 2047 ambitions. Manufacturing's share of GDP should rise from around 17 per cent today to 25 per cent by 2047 (Jha 2025), a shift also central to capitalising on the China+1 opportunity as global supply chains diversify away from concentrated manufacturing bases (Debroy and Sinha 2024). Realising this ambition rests on Indian businesses being competitive across domestic and international markets. But in a geopolitically uncertain world, corporates are increasingly exposed to energy supply and price shocks that put their competitiveness at risk. Industrial investment decisions, with 20–25 year horizons, require long-term electricity price certainty and revenue visibility. Clean, firm, and competitively priced power is now a precondition for attracting this investment, not a sustainability overlay on top of it.
This is already changing how large electricity consumers think about clean energy procurement. The need to enhance competitiveness has driven commercial and industrial (C&I) consumers to widen their renewable energy (RE) procurement choices beyond distribution companies (discoms). Non-discom RE routes, including third-party open access (OA) and captive arrangements, accounted for around 10 per cent of C&I electricity consumption in 2025. When combined with grid-embedded RE supplied through discoms, renewables meet approximately 23 per cent of C&I electricity demand.1 Three megatrends are now shaping how corporates source power. First, the rapidly falling cost of storage is making on-demand, dispatchable RE, a competitive and indigenously available option. Second, global frameworks are increasingly enforcing stringent standards on the carbon footprint of corporate operations and supply chains. Third, regulatory and retail tariff reforms require migrating C&I consumers to fairly compensate discoms for the services they provide. Together, these forces are reshaping not only what corporations procure, but also how they procure.
Recent actions by the central government including the four-year sunset provision for the additional surcharge under the Electricity Amendment Rules 2024 (MoP 2024a), the draft Electricity (Amendment) Bill 2025's proposal to phase out cross-subsidy for manufacturing, Indian Railways, and metro rail within five years (MoP 2025a), and the simplification of groupcaptive proportionality requirements under the Electricity Amendment Rules 2026 (MoP 2026), have begun to address parts of the problem. At the state level, Karnataka has set a trajectory to raise fixed-cost recovery from 19 to 38 per cent by FY2028 (KERC 2025). These are material developments, however, they do not completely address the underlying problem of discoms' cost underrecovery and a conducive framework for OA. Our analysis examines some of these developments, and recommendations set out in this report are meant to complement these ongoing efforts.
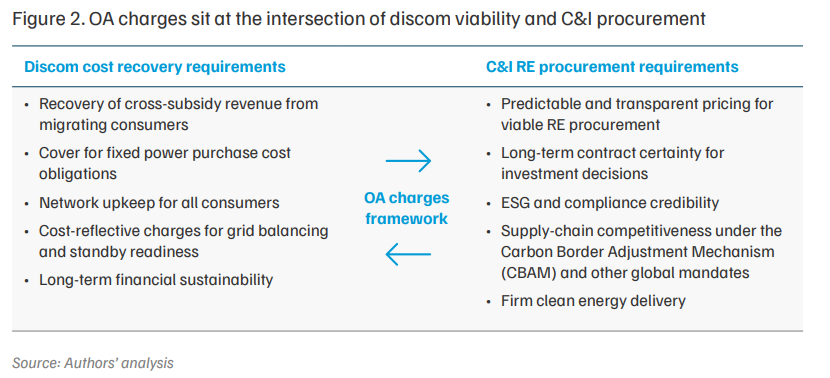
India's OA framework for corporate RE procurement is caught between two countervailing pressures. On one hand, tariff reforms across states are correcting long-standing distortions in electricity pricing. In many states, C&I consumers have historically cross-subsidised other consumer categories through higher tariffs. OA-based RE procurement allowed these consumers to procure RE at significantly lower rate than than grid power. As states rationalise tariffs and revise OA charges, the cost arbitrage is narrowing. On the other hand, decarbonisation pressures on Indian corporates are intensifying rapidly. Regulatory mandates, global carbon border adjustment mechanisms, investor-driven environmental, social, and governance (ESG) requirements, and supply-chain pressures from multinational buyers are turning RE procurement into a compliance necessity rather than a cost-driven choice.
Positioned at the intersection of these two shifts, the current OA charges framework is no longer adequate for the decade ahead. It undercompensates discoms for some of their legitimate costs and exposes C&I consumers to unpredictable, litigation-prone OA charge levies. Yet in CY2025 alone, solar OA additions reached 7.8 GW. Overall, C&I consumers contracted over 36 GW of RE capacity, with 45 GW more under development, and a further 100+ GW of procurement expected over 2030–35 that will need to include firming and storage technologies suited to a high-RE grid (Kothamasu 2025; Mercom India 2025). Table ES1 provides a diagnostic summary of how the six OA charges undermine discom cost recovery and distort the price signals for C&I consumers.
Table ES1. How OA charges undermine discom recovery and distort consumer signals
| Charge | How discoms under-recover | How it distorts consumer signals | Root failure |
|---|---|---|---|
| Cross-subsidy surcharge (CSS) | On the one hand, captive and group-captive consumers are exempt from CSS, leading to a loss of cross-subsidy revenue. On the other hand, in several states, CSS levels exceed the actual cross-subsidies paid by C&I consumers. | CSS is not calibrated to the actual cross-subsidy embedded in tariffs. Even as tariff reforms reduce cross-subsidies, consumers continue to pay elevated CSS due to the disconnect between the Average Cost of Supply and the Voltage-wise Cost of Supply (ACoS–VCoS) and CSS methodology. | Tariff design |
| Additional surcharge (AS) | Fixed costs are largely recovered through energy charges. When consumers migrate, discoms lose the embedded fixed-cost recovery that AS cannot fully offset. In Karnataka, a 5 MW OA consumer contributes to a 6–14% fixed-cost under-recovery despite the AS levy. | AS is not consistently linked to demonstrable stranded capacity. In practice, it is applied under broad assumptions, leading to contested, non-causal pricing. | Tariff design |
| Standby charges | Most states recover only a fraction of the fixed cost of maintaining backup capacity, as charges are based on energy drawal rather than capacity reservation. Punjab’s two-part structure recovers only 21% of the estimated fixed-capacity costs. | The absence of a two-part tariff means consumers do not bear the true cost of maintaining standby capacity. Backup is effectively under-priced and socialised across the system. | Design and data gap |
| Banking charges | Discoms incur back-down costs and peak procurement premiums that are not fully recovered under capped banking charges. | The regulatory cap on banking charges prevents cost-reflective pricing. States respond by restricting banking volumes instead of pricing the service appropriately, undermining procurement certainty. | Design and data gap |
| Parallel operation charges (POC) |
Charges are based on limited studies and lack empirical grounding across the large captive fleet. No state publishes a cost justification. | POC is not linked to the actual impact on power quality. Uniform or presumptive charges apply regardless of technology, overstating costs for RE-based captive plants. | Data deficit |
| Wheeling charges | Network costs are allocated using proxies due to incomplete asset and loss data, leading to approximations in cost recovery. | Consumers face averaged, non-granular charges that do not reflect voltage-wise or locational network costs, limiting their ability to make efficient procurement decisions. | Data deficit |
Source: Authors’ analysis
Note: ACoS (Average Cost of Supply) is the discom's total approved expenditure divided by total energy sold, yielding a single system-wide per-unit cost. VCoS (Voltage-wise Cost of Supply) disaggregates this cost by the voltage level at which consumers are connected, reflecting that serving consumers at higher voltages involves fewer distribution assets and lower losses, and therefore costs less than the system average.
In parallel, decarbonisation pressures are becoming more binding. Domestic policies such as renewable consumption obligations and the Carbon Credit Trading Scheme are introducing compliance requirements for industrial consumers. International mechanisms such as the EU’s CBAM will penalise carbon-intensive exports of steel, cement, aluminium, and fertilisers from the late 2020s (Singh et al. 2025). The Securities and Exchange Board of India’s (SEBI) Business Responsibility and Sustainability Reporting framework mandates emissions disclosures and assurance for top-listed companies. Sustainability-linked loans now tie borrowing costs directly to emission reduction targets (Climate Bonds Initiative 2025). Apple’s commitment to a 100 per cent carbon-neutral supply chain has driven over 250 suppliers across 28 countries, including India, to adopt verified renewable procurement (Apple 2023). These developments are not voluntary signals but contractual, regulatory, and commercial obligations with direct financial consequences.
This report analyses six OA charges–cross-subsidy surcharge (CSS), additional surcharge (AS), standby charges, banking charges, parallel operation charges (POCs), and wheeling charges–in terms of purpose, reform drivers, and actionable recommendations. Across all six, a common cluster of problems recurs, which can be distilled into three structural failures.
Only 15–20 per cent of discom revenue comes from fixed charges, despite fixed costs comprising nearly half of discoms’ total expenditure. When consumers migrate to OA, discoms lose the contribution toward fixed costs embedded in energy charges–a loss that the compensatory additional surcharge cannot fully offset. An illustrative analysis of a 5 MW Karnataka consumer shows that, even with AS levies, the discom faces a 6 per cent fixed-cost under-recovery in case of third-party OA, which rises to 14 per cent for captive arrangements (which are exempt from AS). Cross-subsidy surcharges further compound the distortion: in Karnataka, the CSS is set at INR 1.82/kWh, 11–14 times higher than the actual cross-subsidy contribution of high tension (HT) industrial consumers under the proposed FY2027–28 trajectory. The root problem is not the surcharge rate; it is the inefficient tariff design.
Studies on POCs cover fewer than 10 plants, despite there being ~73 GW of captive capacity. In four of six states, wheeling charges rely on ratio-based asset splits because updated fixed-asset registers are unavailable. Several discoms lack metering at intermediate voltage levels, leading regulators to adopt benchmark or historical loss percentages from earlier orders. Banking cost studies are largely absent. In the absence of such data, OA charges that are precise in form but approximate in substance.
Standby frameworks range from Maharashtra’s four-tier commitment structure to no provisions at all in Tamil Nadu and Rajasthan. Rates for POC vary by more than a factor of 10 across states that use the same nominal methodology. Banking rules have been revised retroactively in Maharashtra. For C&I consumers making 15–25 year investment decisions, this level of regulatory unpredictability is a material barrier to procurement at scale.
Corporate RE procurement in India is undergoing a structural shift, from volume-based annual energy accounting to reliability-centric portfolio design measured in 15-minute time blocks. Leading C&I consumers, such as Hindustan Zinc, have contracted 530 MW of firm RE with battery storage, securing assured delivery in every 15-minute time block. Hindalco and ArcelorMittal have each signed round-the-clock (RTC) RE agreements backed by long-duration pumped-hydro storage. UltraTech Cement has deployed co-located solar, wind, and battery storage to enhance on-site operational resilience. These are not pilot projects but reflect a procurement transformation already underway. Table ES2 maps the evolution of the C&I RE procurement model and its direction.
This transformation requires a fundamentally different regulatory foundation: one that supports procurement models that combine RE with storage, flexibility, and market-based balancing, rather than one built around administratively determined charges and limited data transparency.
Table ES2. C&I renewable energy procurement is shifting from cost arbitrage to reliability driven strategic procurement
| Typical coverage | Balancing mechanism | Delivery metric | |
|---|---|---|---|
| Cost arbitrage era: Plain solar–cost-driven procurement | |||
| Driver: Lower tariff vs grid supply | 30–50% of annual demand | Annual banking with generous OA provisions | Annual energy volume (MU) |
| Hybrid scale-up era: Solar–wind hybrid–expanded demand coverage | |||
| Driver: Cost savings combined with greater RE displacement | 50–65% of annual demand | Monthly banking with increasing Time of Day (ToD) alignment | Annual energy with seasonal profiling |
| Reliability and compliance era: Firm RE with storage–assured delivery | |||
| Driver: Compliance requirements (ESG mandates, CBAM, RCOs) and tightening banking restrictions are pushing consumers toward assured delivery. The GHG Protocol Scope 2 revision proposes hourly matching for reporting, making grid-level emission optimisation essential to substantiate corporate sustainability claims. | Near-100%, including peak hours | Battery energy storage systems (BESSs), pumped hydro, and portfolio-based dispatch | Assured supply at 15-minute intervals |
Source: Authors’ compilation based on stakeholder consultations and Hindustan Zinc (2025); Greenko Group (2022); Hindalco (2022); ArcelorMittal (2025); Gentari (2025), and UltraTech Cement (2025).
The report's recommendations are organised around addressing four challenges: first, correct the tariff distortions that make compensatory surcharges redundant; second, build the evidence base required for rationalising charges accurately; third, redesign charges to reflect the costs they are intended to recover; and fourth, strengthen market mechanisms that can, over time, replace administrative charges. Without progress on the first challenge, the remaining three can only partially succeed. Each recommendation is mapped to a specific charge, a responsible institutional actor, a timeframe, and an expected outcome (Table ES3).
Table ES3. Reform requires sequenced action across four themes
| Charge | Stakeholder | Recommendation | Timeframe |
|---|---|---|---|
|
Theme 1: Correct structural tariff distortions
CSS and AS exist partly because tariffs are not cost-reflective, and fixed costs are bundled into energy charges. Reforming tariff structures reduces the need for compensatory surcharges.
|
|||
| CSS | SERCs and state governments | Publish a time-bound trajectory for ABR–ACoS alignment across consumer categories. Implement a trajectory to align consumer tariffs within a ±20 per cent band of ACoS, protecting vulnerable consumers through direct budgetary transfers rather than embedded cross-subsidies. | 1 year |
| CSS | SERCs and state governments | Undertake structural tariff reforms to progressively eliminate cross-subsidies from tariff design. Any support for vulnerable consumers should be through direct budgetary transfers, not tariff cross-subsidies, so that CSS becomes redundant. | 2–4 years |
| AS | SERCs | Implement phased tariff rebalancing by progressively increasing fixed charges and reducing energy charges, beginning with C&I categories. Introduce sunset provisions for AS in states where rebalancing substantially improves fixed-cost recovery. | 2–4 years |
| Banking | MoP and SERCs | The current 8% cap incentivises volume restrictions rather than cost-reflective pricing. Revise the GEOA Rules 2022 to allow for cost-reflective floor and ceiling anchored to independently estimated injection–withdrawal mismatch costs. | 2–4 years |
|
Theme 2: Build the transparency and evidence base
Accurate charges require data that does not yet exist in most states. These actions establish the foundation on which all subsequent reforms depend.
|
|||
| AS | Discoms and SERCs | Publish quarterly, block-wise data on stranded capacity, OA drawal volumes, curtailment events, and scheduling deviations. Data must be publicly available on discom and SERC websites. | 1 year |
| Standby | Discoms | Publish quarterly data on standby capacity contracted, standby power drawn, and associated revenues. | 1 year |
| AS | SERCs | Require discoms to demonstrate a direct link between OA transactions and specific stranded capacity before levying AS. Exclude curtailment arising from demand-forecasting errors or avoidable RE backdown. | 1 year |
| Charge | Stakeholder | Recommendation | Timeframe |
|---|---|---|---|
|
Theme 2: Build the transparency and evidence base
Accurate charges require data that does not yet exist in most states. These actions establish the foundation on which all subsequent reforms depend. |
|||
| Banking | SERCs and discoms | Commission independent studies to quantify the actual system costs of banking, including discom back-down costs and peak procurement premiums. Conduct a structured stakeholder consultation before revising banking provisions. | 1 year |
| POC | SERCs, SLDCs, and discoms | Commission large-sample harmonic studies stratified by fuel type. Publish results and make them available for public comment before use in charge-setting. | 1 year |
| Wheeling | Discoms | Leverage RDSS to prioritise feeder- and distribution-transformer-level metering, enabling voltage-wise loss assessment and network-cost segregation. | 1 year |
|
Theme 3: Align charges with actual costs Most charges are set using outdated proxies or methodologies that no longer reflect the costs they are meant to recover. These actions correct the design
|
|||
| CSS | MoP and SERCs | Review the CSS methodology and notify of a revised methodology after consultation with the states. Align CSS computation with the actual cross-subsidy embedded in consumer tariffs rather than the ACoS– VCoS divergence. | 1 year |
| Standby | SERCs and discoms | Mandate two-part standby tariffs separating capacity reservation from energy components. Require mandatory standby commitment agreements for all consumers above a threshold load, drawing on Maharashtra’s four-tier framework. | 1 year |
| Charge | Stakeholder | Recommendation | Timeframe |
|---|---|---|---|
|
Theme 4: Strengthen market mechanisms and planning Administrative charges are a second-best substitute for market signals. These actions build the systems that can replace them over time.
|
|||
| Standby | SERCs and discoms | Integrate standby commitments into resource adequacy assessments and power-procurement planning. Contracted standby capacity should be treated as a known load to reduce the risk of stranded capacity. | 2–4 years |
| Standby | CERC, SERCs, and market institutions | Enable standby services to be procured through ancillary services and balancing markets, allowing reserve capacity to be sourced competitively rather than through administrative tariffs. | 2–4 years |
| Banking | SERCs and discoms | Develop regulatory frameworks and technical standards for gridconnected BESSs for C&I consumers, covering grid connectivity, scheduling protocols, and metering. | 1 year |
| Banking | SERCs and discoms | Develop a transition pathway from banking-dependent RE procurement to market-based balancing, integrating access to the day-ahead market (DAM) or real-time market (RTM) for C&I consumers and hybrid procurement structures. Publish state-level timelines so C&I consumers can plan contract structures accordingly. | 2–4 years |
Source: Authors’ analysis
India’s commercial and industrial (C&I) sector is at an inflection point in its relationship with renewable energy (RE). What began as a cost-arbitrage play in this sector–procuring solar or wind power because it was cheaper than grid supply–is rapidly becoming a strategic necessity, driven by environmental, social, and governance (ESG) mandates, carbon border levies, investor scrutiny, and supply-chain pressures from global buyers.
Consumers in the C&I sector directly contracted over 36 GW of renewable capacity by December 2025, with solar open access (OA) accounting for the bulk at over 30 GW (Climate Group RE100 2023; Mercom India 2025). Solar OA additions reached 7.8 GW in CY2025 alone, nearly double the 3.9 GW added in CY2023 (Kothamasu 2025; Mercom India 2025). The OA market remains heavily concentrated: Karnataka, Maharashtra, and Rajasthan together account for over 60 per cent of new solar OA installations in CY2025 (Mercom India 2025), while most states see negligible activity. An additional 45 GW of solar OA projects are in various stages of development as of the end of 2025, and the pace is accelerating (Mercom India 2025). India’s C&I segment accounts for nearly half of the country’s total power demand (MoSPI 2025). How this segment procures energy over the next decade will determine whether India’s industrial economy decarbonises at the pace its climate commitments demand.
Open access has been the primary instrument enabling this shift (see Figure 1). By allowing C&I consumers to buy power directly from RE generators, OA has created a market-led pathway for decarbonisation. For consumers, it enables ESG compliance, hedges against rising grid tariffs, and supports long-term energy planning. For RE developers, it provides a bankable demand base that attracts private investment and drives competition.
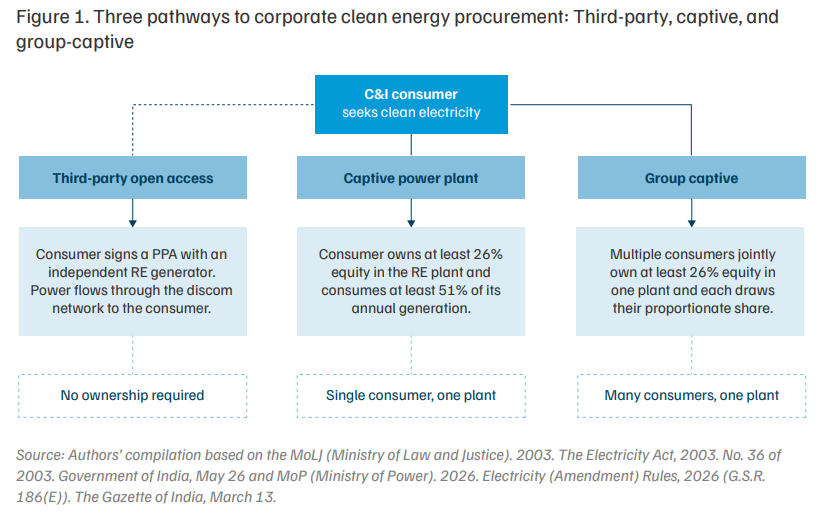
Yet RE meets only ~23 per cent1 of C&I electricity demand today, through a combination of discom supply and direct OA procurement, far short of what the sector must deliver for India to meet its decarbonisation commitments. This gap is not due to a lack of demand or supply; rather, it reflects the limitations of a regulatory framework that has not kept pace with the evolving economics and requirements of corporate clean energy procurement (see Figure 2). Developers and consumers of RE report facing high and unpredictable surcharges, restrictive banking and standby rules, and prolonged administrative delays. These frictions weaken price signals and undermine the competitiveness of clean power (Sethi et al. 2020).
When C&I consumers migrate to OA, discoms face legitimate financial pressures. They lose their highest-paying customers–the same consumers who cross-subsidise agricultural and domestic tariffs. The migration triggers a cascade of under-recovery risks, including fixed-cost liabilities from power purchase agreements (PPAs), stranded network investments, additional costs for grid balancing, and increased administrative burdens (MoP 2017). India’s regulatory architecture addresses these pressures through a set of compensatory charges: CSS, AS, standby charges, banking charges, POC, and wheeling charges (see Figure 3).
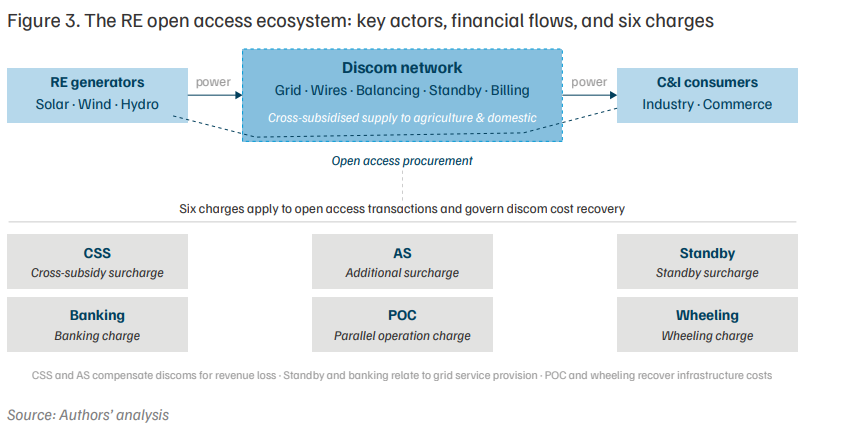
In principle, each OA charge has a clear rationale. However, in practice, all six charges are affected by a common set of problems, including methodologies that are not cost-reflective, data systems that are too weak to support rigorous computation, and inconsistent application across states. The result is a framework that simultaneously undercompensates discoms and overcharges consumers. This misalignment is more urgent now than it was five years ago, as the nature of corporate clean energy demand is changing. A combination of ESG disclosure requirements, the EU’s CBAM, granular greenhouse gas (GHG) accounting standards, and supply-chain mandates from global buyers is pushing Indian companies towards a higher share of clean energy procurement. Leading C&I consumers are now contracting firm, round-the-clock (RTC) power with delivery measured in 15-minute time blocks. Procurement at scale will remain constrained if the regulatory framework governing OA remains unpredictable, litigation-prone, and economically distorting for both discoms and consumers.
Several reforms are already underway. The GEOA Rules 2022 standardised banking provisions, streamlined approval process, and lowered the OA eligibility threshold to 100 kW. The Electricity Amendment Rules, 2024, introduced sunset provisions for an additional surcharge. The draft Electricity (Amendment) Bill, 2025, proposes to phase out cross-subsidy for manufacturing, metro rail, and Indian railways, and to exempt discoms from supply obligations for consumers above 1 MW (Ministry of Power 2025a). Radical proposals, such as reclassifying all HTconnected users as OA consumers, signal meaningful shifts (Prayas Energy Group 2025). However, these reforms will take years to design, enact, and implement. The charges that currently govern OA will shape investment decisions, procurement structures, and discom finances long before any of these proposals take full effect.
Chapter 3 examines each OA charge through a consistent analytical lens–its purpose and legal basis, the drivers for reform, and the specific actions required by regulators, discoms, and policymakers to correct the current misalignment. Chapter 4 situates this regulatory analysis within the broader shift in corporate clean energy strategy, demonstrating why reforming OA charges is not merely a technical regulatory matter but a prerequisite for India’s next phase of industrial decarbonisation. The report’s recommendations are directed at specific actors– the Ministry of Power (MoP), state electricity regulatory commissions (SERCs), the Forum of Regulators (FoR), state load dispatch centres (SLDCs), discoms, and C&I consumers–with clear timeframes and expected outcomes.
India has the RE potential, policy architecture, and corporate demand to build a deep and reliable market for industrial clean energy. What it currently lacks is a robust, cost-reflective regulatory framework for OA that is methodologically transparent and consistent across jurisdictions. This report maps the path from where the framework is to where it needs to be.
This study employs a qualitative research design (Creswell 2009), drawing on extensive document review and long-form stakeholder interviews to explain how OA charges are conceptualised, calculated, and implemented across Indian states. This approach is appropriate when the research objective is not to test causal hypotheses, but to explain how complex regulatory mechanisms operate in practice, why they vary across jurisdictions, and how institutional actors interpret and respond to them. It is therefore well suited to analysing regulatory environments that are legally complex, institutionally embedded, and unevenly implemented across jurisdictions. The research began with a systematic review of primary regulatory and policy documents, including the following:
• SERC tariff orders, tariff regulations, OA regulations, and petitions
• FoR reports and model regulations
• CEA, CERC, and MoP discussion papers, draft rules, and notifications
• State government policies on RE, captive generation, and electricity duty notifications
• Judicial and quasi-judicial decisions, including APTEL judgements and relevant high court and Supreme Court rulings
These documents provided foundational insight into the statutory intent and computational logic behind each charge, as well as the state-wise methodologies. To supplement this review, we examined secondary literature–including reports by sectoral think tanks, academic papers, and analytical studies–to capture expert interpretations and contextualise how state-level OA charges have been designed, adapted, and applied in practice under varying regulatory, data, and system conditions. While primarily qualitative, this study incorporates descriptive statistics from regulatory sources to contextualise and validate qualitative insights. These quantitative insights strengthen the assessment by grounding our arguments in observed trends and sectorlevel evidence.
Alongside this desk research, the study incorporates insights from conversations with renewable developers, C&I consumers, electricity traders, over-the-counter (OTC) platforms, consultants, and sectoral experts. These interviews serve as key-informant consultations, validating the assumptions underlying tariff orders, surfacing implementation challenges that are invisible in regulatory documents, and capturing expectations around how charges may evolve under future reform scenarios.
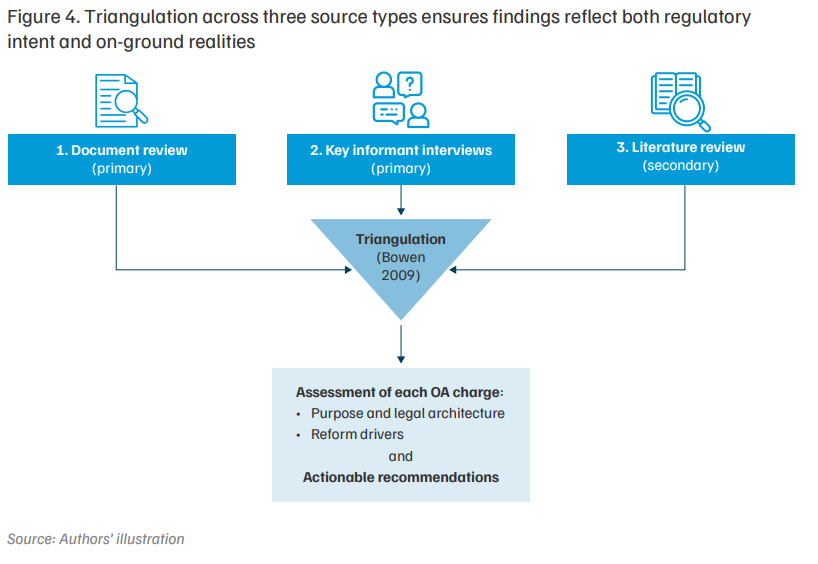
This study adopts triangulation across document analysis and long-form interviews, consistent with the approach outlined by Bowen (2009), in which multiple qualitative sources are combined to enhance analytical depth and validity. We do this through:
• Document triangulation: Cross-checking tariff orders against electricity regulatory commission (ERC) regulations, FoR recommendations, and MoP guidance
• Case triangulation: Comparing similar charges across states to identify outliers, gaps, and best practices
• Stakeholder triangulation: Integrating regulatory analysis with stakeholder narratives to enrich, contextualise, and interrogate how charges operate in practice
This iterative process ensures that the final analysis reflects both doctrinal accuracy and onground realities, resulting in a holistic understanding of how these charges shape corporate renewable procurement in India.
Each charge is analysed using a consistent three-part structure: its purpose and legal basis; the regulatory, financial, and structural drivers calling for reform; and specific, timeframebound recommendations directed at named institutional actors. This structure enables direct comparison across the six charges while maintaining a focus on actionable outcomes.
Limitations of the study
• Stakeholder consultations are qualitative and not statistically representative of all market participants. Participant views may reflect organisational positions or limited experiential scope.
• Triangulation partially normalises cross-state comparison; however, inherent regional and regulatory heterogeneity limits the generalisability of findings across all Indian states.
• Limited access to granular administrative data, such as load curves, banking transaction records, and voltage-wise cost components, constrains deeper quantitative validation of several charge methodologies.
• Several regulatory provisions are ambiguously drafted. Where computational steps are not fully specified in tariff orders, interpretive judgement has been applied and noted.
• The analysis reflects the regulatory landscape up to FY2024–25. Subsequent tariff orders, court rulings, or policy changes may alter specific charge methodologies.
• Some recommendations have cross-cutting implications for other charges. These interlinkages are noted where relevant and would benefit from system-wide regulatory review.
Open access has emerged as a key pathway for C&I consumers to transition to RE. The pace of RE uptake, however, depends not only on enabling OA provisions but also on how various OA charges are structured and applied. These charges include the CSS, AS, standby charges, banking charges, wheeling charges, and POCs. Each charge serves a distinct purpose, ranging from compensating discoms for revenue loss to payment against services such as wheeling of power, banking, and standby power.
This chapter examines each of these OA charges through a common analytical lens. First, we analyse their purpose, statutory basis, and prevailing methodologies; then, we identify key regulatory and policy shifts driving reform; and finally, we set out a coherent set of actionable recommendations.
3.1 Cross-subsidy surcharge
Purpose, legal basis, and design
Cross-subsidy has long been a central feature of India’s electricity tariff design framework. Commercial and industrial consumers pay tariffs above the discom’s average cost of supply (ACoS), enabling below-cost tariffs for agricultural and low-income domestic users. An assessment of 60 discoms for 2019 found that C&I consumers overpay by an average of INR 2.46/kWh and INR 1.35/kWh for C&I categories, respectively (Tyagi and Tongia 2023).
The CSS is anchored in Section 42(2) of the Electricity Act, 2003 (MoLJ 2003). It compensates discoms for the loss of cross-subsidy revenue when higher-tariff C&I consumers migrate to OA. It applies only to third-party OA transactions; captive and group-captive consumers are exempt under the Electricity Act. In practice, CSS constitutes the largest single component of OA charges and plays a decisive role in shaping both discom revenues and the economics of RE procurement (Gambhir et al. 2020). The act specifies that CSS should reflect the current level of cross-subsidy within the discom’s area of supply–a requirement that, as the analysis will show, is systematically violated in practice.
Apart from the Electricity Act, 2003, the design and application of CSS are governed by multiple regulatory instruments, including the policy guidance under the National Tariff Policy, 2006 (NTP) and its subsequent amendments in 2008 and 2016 (MoP 2016), as well as subordinate legislations, such as the Electricity Amendment Rules, 2022 and the Electricity (Promoting Renewable Energy Through Green Energy Open Access) Rules, 2022 (MoP 2022b). The NTP 2016 provides the operational guidance that CSS should neither stifle competition nor undermine discom viability. It also specifies that CSS should not exceed 20 per cent of the applicable consumer tariff and requires state electricity regulatory commissions (SERCs) to establish a trajectory for reducing cross-subsidies, gradually bringing tariffs for all consumer categories within ±20 per cent of the ACoS.
Subsequently, the Electricity (Amendment) Rules, 2022, capped CSS at 20 per cent of the ACoS (MoP 2022a), which differs from the provision under the NTP 2016. The GEOA Rules 2022 introduced additional provisions governing the CSS for green energy OA (MoP 2022b). The GEOA Rules specify that the CSS shall not increase by more than 50 per cent of the surcharge fixed in the year OA was granted, for a period of twelve years from the commissioning of the generating plant. Despite these overarching provisions, states continue to apply varying methodologies and interpretations in determining CSS, resulting in a lack of uniformity across jurisdictions.
Further, the recently notified Electricity (Amendment) Rules, 2026 (MoP 2026), simplified proportionality requirements for group-captive projects and clarified verification and appeals, thereby reducing litigation and compliance uncertainty. These changes are likely to improve the viability and scalability of captive-based renewable procurement for C&I consumers.
CSS should reflect the current level of cross-subsidy within the discom’s area of supply, violated in practice.
Drivers for reform
A series of regulatory, financial, and structural changes in India’s power sector are beginning to alter the relevance and effectiveness of the current CSS framework. These developments could prompt policymakers and regulators to reassess both the methodology for CSS and its role in an evolving electricity market.
Tariff rationalisation and solarisation of domestic and agricultural demand is leading to a reduction of cros subsidy requirement.
A. Declining cross-subsidy requirements
Impact of tariff rationalisation measures: One of the most significant developments in recent years is the gradual reduction in cross-subsidy requirements across states. The regulatory framework mandates the progressive alignment of the average billing rate (ABR) with the ACoS within a ±20 per cent band across consumer categories. As of FY2024–25, domestic tariffs in Bihar, Madhya Pradesh, Maharashtra, Tamil Nadu, and Karnataka are already above 90 per cent of ACoS. For agriculture, Bihar and Madhya Pradesh have met the ±20 per cent threshold (ETPI 2024). Karnataka has gone the furthest, establishing a trajectory to nearly eliminate crosssubsidy from tariff design by FY2027–28. These developments suggest that state governments are increasingly bearing a larger share of the subsidy burden through direct budgetary transfers rather than embedding it within tariff structures (Tripathi and Aggarwal 2025).
Impact of solarisation programmes: Central government schemes, such as Pradhan Mantri Kisan Urja Surakshaevam Utthaan Mahabhiyan Yojana (PM-KUSUM) and PM Surya Ghar: Muft Bijli Yojana, along with several state initiatives, aim to meet a substantial share of agricultural and household electricity demand through decentralised solar generation. PM-KUSUM targets the solarisation of 35 GW of agricultural demand by March 2026, while PM Surya Ghar aims to deploy 30 GW of rooftop solar for residential consumers by March 2027. These initiatives are expected to reduce both subsidy requirements and cross-subsidy burdens embedded within tariffs. For instance, Maharashtra estimates that feeder-level solarisation could reduce its annual subsidy outlay by around 45 per cent (from INR 10,000 crore to INR 5,500 crore), lower the cost of supply and reduce cross-subsidy requirements. This could potentially lower C&I tariffs by INR 1.0–1.5/kWh, making solarisation an attractive pathway for tariff rationalisation (MAHAVITARAN 2025; MAHAPREIT 2025).
Misalignment between cross-subsidy levels, CSS methodology, and intent under the Electricity Act, 2003: Cross-subsidy requirements are declining; however, CSS has not followed. Karnataka illustrates this divergence clearly: the cross-subsidy contribution of industrial (HT-2a) and commercial (HT-2b) consumers under the proposed FY2027–28 tariff trajectory is INR 0.17/kWh and INR 0.13/kWh, respectively. In contrast, the CSS approved by the regulator is INR 1.82/kWh, 11–14 times higher than the actual cross-subsidy contribution. Similar patterns are observed in Gujarat, Madhya Pradesh, Uttar Pradesh, and Rajasthan.
This divergence has a structural basis. Regulators compute CSS using voltage-wise cost parameters, while cross-subsidy contributions are assessed against the ACoS. Consumer tariffs are set with reference to ACoS rather than the voltage-wise cost of supply (VCoS). Therefore, CSS is anchored to voltage-level cost parameters, while the cross-subsidy embedded in tariffs is determined using average system costs–and the two routinely diverge (see Box 1). Our consultations indicate that SERCs are complying with the provisions of the NTP, which require CSS to be determined at the relevant voltage level, resulting in structural inconsistency.
Gujarat's VCoS and tariff data for FY2021 make the structural problem concrete. For the HT industrial category, the VCoS is computed at INR 5.67/kWh, notably lower than the ACoS of INR 6.34/kWh—indicating that the actual cost of serving industrial consumers at high voltage is lower than the system average. However, because tariffs are set on an ACoS basis, the industrial tariff (ABR) is INR 7.35/kWh, implying a cross-subsidy contribution of INR 1.01/kWh relative to ACoS. The CSS, computed at 20 per cent of ABR, is INR 1.47/kWh, which is INR 0.46/kWh higher than the actual cross-subsidy contribution.
To demonstrate our hypothesis that the current ACoS–VCoS disconnect causes CSS to systematically overcharge third-party OA consumers relative to the actual cross-subsidy they contribute within the discom's area of supply, we present two scenarios:
| Category/ Unit |
Scenario 1: ACoS-aligned tariffs | Scenario 2: VCoS-aligned tariffs | |||||
|---|---|---|---|---|---|---|---|
| ACoS (INR/kWh) |
ABR @ ACoS (INR/kWh) |
CS @ ABR-ACoS |
CSS – 20% of ABR (INR/kWh) |
VCoS (INR/kWh) |
ABR @ VCoS (INR/kWh) |
CS @ VCoS-ABR |
|
| Low tension | |||||||
| Domestic | 6.34 | 6.34 | 0 | NA | 6.98 | 6.98 | 0 |
| Non-Domestic | 6.34 | 6.34 | 0 | NA | 7.25 | 7.25 | 0 |
| Low Tension Industry | 6.34 | 6.34 | 0 | NA | 6.88 | 6.88 | 0 |
| Public Water Works (PWW) | 6.34 | 6.34 | 0 | NA | 5.07 | 5.07 | 0 |
| Agriculture | 6.34 | 6.34 | 0 | NA | 6.80 | 6.80 | 0 |
| High tension (HT) | |||||||
| Industry | 6.34 | 6.34 | 0 | 1.27 | 5.67 | 5.67 | 0 |
| CSS under scenario 1: VCoS – ABR @ACoS (Industry, INR/kWh) |
-0.67 | Summary | |||||
| CSS under scenario 2: VCoS – ABR @VCoS (Industry, INR/kWh) |
0.00 | ||||||
Scenario 1—ACoS-aligned tariffs: If the ABR of all categories is aligned with the ACoS, the industrial ABR falls to INR 6.34/kWh (from INR 7.35/kWh). Under this scenario, the ACoS-based cross-subsidy contribution reduces to zero. However, CSS under the current formula remains INR 1.27/kWh, as it is computed on ABR rather than actual cross-subsidy. The VCoS-implied cross-subsidy for the HT industry is INR 0.67/kWh (the gap between ACoS and VCoS: 6.34–5.67). Therefore, CSS overcharges by approximately 47 per cent relative to the VCoS estimate of the actual cross-subsidy. A consumer whose tariff reform has eliminated their cross-subsidy contribution is still paying CSS.
Scenario 2—VCoS-aligned tariffs: If tariffs are set equal to VCoS, the industrial billing rate becomes INR 5.67/kWh. Both the cross-subsidy embedded in tariffs and the CSS payable on migration to OA fall to zero. The charge disappears precisely because the underlying distortion, the gap between average and voltage-level costs, has been eliminated. Table 1 shows both scenarios across all consumer categories.
The conclusion is direct: the current CSS formula is not calibrated to the actual cross-subsidy. It is calibrated to ABR, which inflates the charge regardless of what cross-subsidy actually exists. Several discoms have indicated that they lack the granular data required to compute VCoS reliably, which is why ACoS-based tariff determination persists across all states. However, data limitations do not justify a formula that systematically over-recovers. Even within an ACoS-based tariff framework, the CSS methodology requires revision.
Source: Authors' analysis based on GERC (Gujarat Electricity Regulatory Commission). 2022. Tariff Order: Truing up for FY 2020–21 and Determination of Tariff for FY 2022–23 for Paschim Gujarat Vij Company Limited (Case No. 2031 of 2021). Gujarat Electricity Regulatory Commission, and PGVCL (Paschim Gujarat Vij Company Limited). 2021. Category Wise Cost of Service Study for Paschim Gujarat Vij Company Limited (FY 2020–21). Paschim Gujarat Vij Company Limited.
Note: VCoS-based numbers were available only for FY21; therefore, we used them for the analysis. The industry (HT) row is highlighted to underscore the ACoS–VCoS divergence. Summary rows show the gaps between ACoS, VCoS, and ABR for each scenario in the HT industry category.
Further, a review of financial disclosures from several large discoms suggests that CSS collections remain modest compared with the discoms’ overall revenue base. In many cases, annual CSS collections range between INR 200–300 crore, representing less than 0.5 per cent of the annual revenue requirement. Yet the administrative burden of verifying captive status for CSS exemptions is substantial, creating compliance costs for discoms, regulators, consumers, and generators alike.
These observations indicate that the policy objectives under the Electricity Act, 2003, and NTP 2016 have not been implemented in tandem. The NTP calls for progressive reduction of cross-subsidies in tariffs, while the Electricity Act requires CSS to reflect the current level of cross-subsidy. These two mandates should reinforce each other; however, in practice, the CSS formula has not tracked the decline in cross-subsidies, resulting in systematic over-recovery and highlighting the need to review it.
B. Discoms under-recovery due to CSS exemptions for captive consumption
Under the Electricity Act, 2003, CSS applies only to third-party OA transactions, while captive consumption remains exempt. As a result, when C&I consumers migrate to captive arrangements, discoms lose the cross-subsidy revenue embedded in tariffs and do not receive compensation through CSS. In practice, this financial loss should reflect the foregone crosssubsidy contribution rather than CSS receipts. To partially offset this impact, several states levy electricity duties on captive consumption, which can moderate the net revenue loss for discoms (Kokate and Josey 2022).
As tariff reforms progressively align consumer ABRs with ACoS, the cross-subsidy embedded in C&I tariffs will shrink, and with it, the revenue discoms stand to lose when those consumers migrate to captive arrangements. In the long run, as tariffs become fully cost-reflective, the rationale for cross-subsidy disappears entirely, and CSS loses its purpose. Reform is therefore self-reinforcing, and every step towards ACoS alignment reduces the distortion that CSS was designed to address. Policy discussions are already moving in this direction. For instance, the draft Electricity (Amendment) Bill, 2025, proposes to phase out CSS for manufacturing enterprises, Indian Railways, and metro railways within five years. Once cross-subsidy is eliminated from tariff design, the distinction between captive and third-party OA also becomes redundant.
Implementing these reforms will require navigating significant political and institutional constraints. Tariff rationalisation often involves difficult trade-offs for state governments and regulators including balancing cost-reflective pricing with consumer affordability, improving discom finances while preserving C&I competitiveness, and introducing efficient price signals without undermining renewable investment certainty. Policymakers will therefore need to pursue these changes gradually while protecting vulnerable consumers and strengthening coordination between regulatory and fiscal institutions. Recognising these constraints is essential to ensure that reforms remain both practical and implementable.
Recommendations
Declining cross-subsidy requirements, potential over-recovery under the existing CSS methodology, and revenue risks for discoms arising from captive exemptions together warrant a reassessment of how CSS is computed and applied. The recommendations here propose immediate regulatory actions and longer-term structural reforms, organised by timeframe and responsible actor. Some actions may also affect other OA charges and will therefore require coordinated regulatory attention to ensure consistency across the broader tariff framework.
MoP must review the CSS methodology and, after consultation with states, notify a new framework.
| Timeframe | Stakeholder | Recommendation | Expected outcomes |
|---|---|---|---|
| Short (1 year) |
MoP and SERCs | MoP must review the CSS methodology and, after consultation with states, notify a new framework. SERCs must align with the revised CSS formula. | Prevent potential over-compensation to discoms and reduce pricing distortions in OA markets. |
| SERCs | Publish a consultation or white paper that sets out a time-bound trajectory for ABR–ACoS alignment across consumer categories. | Establish a transparent roadmap for tariff rationalisation and signal the gradual reduction of cross-subsidy dependence. | |
| SERCs and state governments | Implement a time-bound trajectory for aligning consumer tariffs within a ±20 per cent band of the ACoS, while safeguarding vulnerable consumers through direct budgetary transfers. | Reduce cross-subsidy levels embedded in tariffs and limit the revenue impact of captive exemptions. | |
| Medium (2–4 years) |
SERCs, state governments, and discoms | Undertake structural tariff reforms to progressively eliminate cross-subsidies from tariff design and eventually phase out CSS. Any support to vulnerable consumers should be through direct budgetary transfers. | Create cost-reflective tariffs, improve transparency in electricity pricing, and reduce reliance on CSS over the long term. |
3.2 Additional surcharge
Purpose, legal basis, and design
The AS is levied under Section 42(4) of the Electricity Act, 2003. When C&I consumers procure electricity through OA, discoms may remain obligated to pay fixed charges under long-term PPAs that were originally contracted to serve those consumers. The AS enables discoms to recover unavoidable fixed costs arising from such stranded power purchase commitments. The AS applies only to third-party OA transactions, while captive and group-captive users are exempt. This distinction has been upheld in several Appellate Tribunal for Electricity (APTEL) and court judgments, including JSW Steel Ltd & Others vs Maharashtra Electricity Regulatory Commission & Others (2019).
The design and application of AS are governed by multiple regulatory instruments, including the NTP 2006 and subsequent amendments, the Electricity (Promoting Renewable Energy Through Green Energy Open Access) Rules, 2022, and the Electricity Amendment Rules, 2024. The NTP 2016 broadly establishes that AS should reflect only the actual stranded fixed costs arising from discoms’ power purchase commitments and should not undermine the viability of OA. It further clarifies that AS is distinct from network-related charges, which are recovered separately through wheeling and transmission tariffs.
Subsequent regulatory provisions have further refined the scope of AS. The GEOA Rules 2022 specify that AS shall not apply to green energy OA consumers if they continue to pay fixed charges to the discom. The Electricity Amendment Rules, 2024, also cap AS at the per-unit fixed cost of the discom’s power purchase. In addition, the rules introduce a sunset mechanism under which the surcharge must be reduced linearly from the level applicable in the year in which OA or general network access is granted and eliminated within four years. Despite these overarching provisions, states continue to apply varying methodologies and interpretations when determining AS, resulting in limited consistency across jurisdictions.
Drivers for reform
Several structural and regulatory factors limit the effectiveness of the current AS framework, including issues related to tariff design, stranded capacity attribution, and the treatment of certain OA transactions. The following subsections examine these challenges in detail.
A. Discom under-recovery due to captive exemptions
Under the Electricity Rules, 2005, captive and group-captive consumers are exempt from AS. Discoms challenged this exemption for several years; however, the Hon’ble Supreme Court recently upheld the legal position in Dakshin Gujarat Vij Company Limited vs Gayatri Shakti Paper & Board Limited and Another (2023). The exemption has significantly reduced AS-related revenues and has financial consequences for discoms. For instance, in Maharashtra, AS revenues declined by more than 80 per cent, from INR 575 crore in FY2017–18 to INR 109 crore in FY2023–24, following courts’ clarification that AS does not apply to group-captive projects (MSEDCL vs JSW Steel and Others 2021).
Renewable energy developers frequently structure projects as captive or group-captive arrangements by transferring the minimum required equity to consumers. This structure allows consumers to access OA power while avoiding both AS and CSS. Even where such transactions leave discoms with genuinely stranded contracted capacity, the current framework provides no compensatory mechanism. Several states levy electricity duties on captive consumption to partially offset this gap; however, these duties are state-specific and do not systematically address the underlying structural shortfall (Kokate and Josey 2022).
B. Inadequate assessment of curtailment reasons
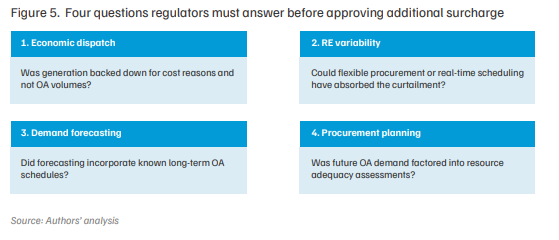
Additional surcharge is justified only where OA transactions directly cause discoms to strand contracted capacity. In practice, however, regulators and discoms routinely attribute curtailment to OA volumes without adequately examining alternative causes, such as economic dispatch decisions (where discoms back down costlier power when cheaper sources are available), RE variability management, demand forecasting errors, or grid outages. Renewable energy developers and OA consumers have consistently contested this assumption, arguing that several factors unrelated to OA transactions also contribute to power curtailment.
In recent times, courts and tribunals have already scrutinised this assumption. In Lord Chloro Alkali Limited vs Rajasthan Electricity Regulatory Commission & Others (2025), the APTEL overturned Rajasthan’s regulator’s AS levy for FY2015–16, finding that the state had failed to establish a clear link between power curtailment and actual OA volumes. The ruling highlights the need for discoms to demonstrate that OA transactions directly result in stranded capacity before seeking compensation. To ensure that AS reflects genuine OA impacts, regulators should examine the underlying reasons for curtailment before attributing stranded costs to OA consumers. Figure 5 sets out key questions.
Regulators should examine the underlying reasons for curtailment before attributing stranded costs to OA consumers.
C. Discom under‑recover fixed cost due to inefficient tariff design
Regulatory proceedings across several states show that commissions apply varying methodologies to determine AS, a practice that RE developers and OA consumers frequently contest. Regulators and discoms often justify these approaches by arguing that discoms underrecover fixed costs due to the inherent design of electricity tariffs, and that AS is therefore required to compensate for the resulting revenue gap. Therefore, the strongest driver of AS is not OA itself, but the structural mismatch between how discoms incur costs and how tariffs recover them.
Discoms incur two types of costs: fixed costs associated with long-term power purchases, transmission, and distribution networks, and variable costs linked to the energy consumed from generators. Although fixed costs account for nearly half of a discom’s total expenses, fixed charges typically contribute only 15–20 per cent of total revenue (KERC 2025). The remaining 30–35 per cent of fixed costs is recovered through energy charges, creating a structural mismatch between cost recovery and tariff design. State-level data confirms the scale of this issue. In Delhi, regulators bundle more than 60 per cent of fixed costs into energy charges (DERC 2025). In Maharashtra, fixed charges account for only about 19 per cent of revenue, even though fixed costs represent nearly 57 per cent of total costs (MERC 2025). As a result, when consumers shift to OA and reduce their energy drawal from the discom, a significant share of fixed costs remains unrecovered, strengthening the regulatory justification for levying the AS.
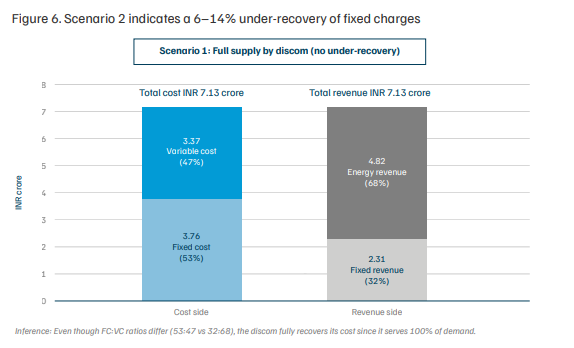
An illustrative analysis of a 5 MW industrial consumer in Karnataka demonstrates how fixedcost recovery operates under discoms and OA-based power procurement. Table 2 summarises the assumptions and calculations used in this illustrative analysis, while Figure 6 presents the findings across scenarios.
In Scenario 1, the discom supplies the consumer’s entire demand. Despite the tariff structure recovering only 32 per cent of fixed costs through fixed charges, full fixed-cost recovery is achieved because the consumer pays energy charges on all units drawn, and energy charges carry the embedded fixed-cost component.
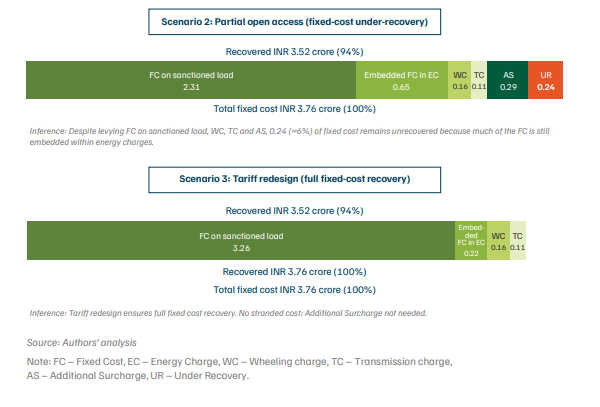
In Scenario 2, the consumer migrates 55 per cent of demand to third-party OA. The discom loses energy charge revenue on these units. The discom applies all applicable charges, including fixed charges on sanctioned load, wheeling charges, transmission charges, and AS. Even after applying these charges, a 6 per cent fixed cost remains unrecovered. For captive transactions, which are exempt from AS, the under-recovery increases to about 14 per cent.
Scenario 3 demonstrates that the entire issue can be addressed through tariff redesign. If fixed charges are increased by 41 per cent (from INR 385/kVA to INR 543/kVA) and energy charges are reduced by 20 per cent (from INR 6.47/kWh to INR 5.18/kWh), fixed costs are fully recovered through the fixed component of the tariff. When a consumer migrates to OA, the discom no longer loses fixed-cost recovery along with energy revenue, because fixed costs are no longer embedded in energy charges. As a result, AS becomes unnecessary, and the distinction between captive and third-party transactions becomes redundant.
This approach also aligns with the GEOA Rules 2022 and several state regulations, which specify that AS should not apply if a consumer pays the full fixed cost through tariffs. The assumption is that fixed charges are set at cost-reflective levels. Several states have begun moving in this direction. Karnataka has set a trajectory to increase fixed-cost recovery from 19 per cent to 38 per cent over FY2024–28. Maharashtra and Rajasthan have initiated similar, though more gradual, adjustments. Table 3 presents Karnataka’s trajectory across consumer categories. The analysis, therefore, shows that prudent tariff design alone can protect discom revenues while providing consumers greater price transparency. Once tariff rationalisation ensures adequate recovery of fixed costs, the rationale for levying AS weakens significantly.
| S no | Parameter | Description |
|---|---|---|
| Key Parameters and Assumptions | ||
| 1. | Consumer profile | HT industrial consumer Contract demand = 5 MW Load factor = 0.17 Power factor = 1 Karnataka discom tariffs used as reference |
| 2. | Annual energy consumption | 7.45 million kWh/year (~7.45 MU annually) |
| 3. | Cost side (discom expenditure) | Fixed cost = INR 5.05/bWh; variable cost = INR 4.52/kWh; ACoS = INR 9.57/kWh → Annual fixed cost (expected) = INR 3.76 crore |
| 4. | Revenue side (tariff design) | Fixed charge = INR 385/kVA; energy charge = INR 6.47/kWh, ABR = INR 9.57/kWh → Assumed cost-reflective tariffs → Annual fixed cost (recovered) = INR 2.31 crore |
| 5. | OA charges and quantum | OA quantum = 55% of annual demand Wheeling charge = INR 0.40/kWh Transmission charge = INR 0.28/kWh Additional Surcharge = INR 0.70/kWh |
| 6. | Cost–revenue ratio misalignment | FC:VC on cost side = 53:47 vs FC:VC on revenue side = 32:68 |
| Findings | ||
| 7. | Fixed cost recovery with consumer getting full supply from discom | Full recovery of fixed cost (INR 3.76 crore) |
| 8. | Fixed cost recovery as consumer procures 55% from third-party OA and 45% from discom | ~94% recovery of fixed cost (INR 3.53 crore) 6% under-recovered fixed cost |
| 9. | Fixed cost recovery as consumer procures 55% from captive OA and 45% from discom | ~86% recovery of fixed cost (INR 3.22 crore) 14% under-recovered fixed cost |
These tariff changes will also alter the economics of OA procurement. As fixed charges rise and energy charges decline, C&I consumers will reassess their contract demand requirements and load-optimisation strategies. Such adjustments could encourage consumers to reduce contracted demand and invest in alternative supply options, such as solar and storage, particularly as technology costs continue to fall. Discoms therefore face a delicate transition: while higher fixed charges improve cost recovery, large and abrupt increases could accelerate migration away from discom supply
| Particulars | Vikram Solar expenditure (USD million /GW) |
Premier Energies expenditure (USD million /GW) |
|---|---|---|
| Land and site development | 0.8 | 0 |
| Building and civil works | 5.3 | 4.1 |
| Plant, machinery, equipment, and utilities | 59.8 | 55.6 |
| Miscellaneous (fixed assets, pre-operative expenses) | 1.8 | 1.9 |
| Design, engineering, and project management | 0 | 0.7 |
| Interest during construction | 2.0 | 6.2 |
| Contingency cost | 1.4 | 1.4 |
| Total | 71.1 | 70.0 |
Recommendations
A rational AS framework must balance the legitimate cost-recovery needs of discoms with the predictability and fairness required by OA consumers. The following recommendations propose a phased pathway to improve transparency, strengthen methodological rigour, and gradually phase out AS where tariff reforms reduce the need for stranded cost recovery.
| Tariff category | Fixed-charge change (FY26–28) (INR/kW or kVA) |
Energy-charge change (FY26–28) (paisa/kWh) |
|---|---|---|
| LT domestic | +INR 25, +INR 5, +INR 10 per kW | −10p, −10p, −5p |
| LT commercial | +INR 5 per kW each year | −100p, −20p, −20p |
| LT industrial | +INR 10 per kW each year | −160p, −10p, −10p |
| LT irrigation <10HP | - | +90p, +26p, +43p |
| HT industrial | +INR 5 per kVA each year | −30p, 0, −10p |
| HT commercial | +INR 55 per kVA each year | −205p, −25p, −30p |
Source: Authors' compilation from KERC (Karnataka Electricity Regulatory Commission). 2025. Combined Tariff Order 2025. Karnataka Electricity Regulatory Commission.
Note: Positive (+) figure indicates cross-subsidy provided by that category, while negative (−) indicates cross-subsidy received.
3.3 Standby charge
Purpose, legal basis, and design
Standby charges apply when OA consumers rely on the discom for backup supply–during generator outages, transmission constraints, or force majeure events. The discom steps in to ensure continuity of service. Standby charges compensate the discom for maintaining the reserve capacity and operational readiness required to provide backup.
Unlike CSS and the AS, standby charges are payments for a service rather than compensation for revenue loss. The discom acts as the supplier of last resort, maintaining the ability to meet sudden demand when the consumer’s primary power source fails.
The Electricity Act, 2003, does not explicitly define standby charges. State electricity regulatory commissions derive their authority to design such charges from their broader tariff-setting powers under the act. Policy guidance is also available through the NTP 2016 and the GEOA Rules 2022. The NTP states that when the generator supplying an OA consumer trips, the discom should provide a temporary supply at a tariff not exceeding 125 per cent of the applicable retail tariff. The GEOA Rules state that standby charges should not apply when the consumer provides at least 24 hours’ advance notice of the standby requirement, and, where levied, such charges should not exceed 10 per cent of the energy charges applicable to the relevant consumer tariff category.
Despite these guiding provisions, states have adopted widely different approaches to standby arrangements. The variation is substantial–it ranges from structured four-tier frameworks to no provisions at all.
Drivers for reform
Standby charges are a critical but underdeveloped component of the regulatory landscape. Most states lack a cost-reflective design, leading to significant under-recovery for discoms and weak economic signals for consumers.
A. Discom stand-by services are not cost-reflective, leading to cost under-recovery
Standby supply involves two distinct cost components. The first is capacity reservation cost–the fixed cost of maintaining generation capacity and system readiness regardless of whether backup power is drawn. The second is variable procurement cost–the cost of actually sourcing electricity when a consumer calls on standby. A cost-reflective standby framework recovers both through a two-part tariff: a fixed charge for capacity reservation and an energy charge for actual drawal. The MoP’s 2017 Consultation Paper on Open Access recommended exactly this structure (MoP 2017).
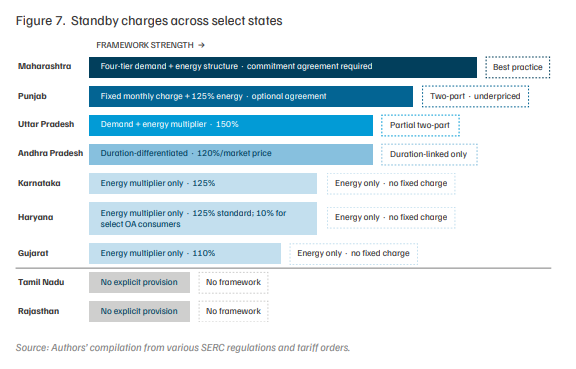
Although there is limited quantitative evidence on the extent of discom under-recovery from standby charges, insights can be drawn from the current design of standby charges and their linkage with fixed-cost recovery, as discussed in Section 3.2 on AS. In practice, most states lack a structured and cost-reflective framework. As shown in Figure 7, standby charge mechanisms vary widely across states. Some states apply a simple multiplier to energy charges (such as Karnataka, Haryana, and Gujarat), while others combine demand and energy charges (such as Maharashtra and Punjab). A few states, including Tamil Nadu and Rajasthan, lack an explicit framework, leading to ad hoc and non-transparent practices. The variation across states highlights the absence of a consistent regulatory framework for valuing backup capacity and recovering associated system costs.
Punjab provides a clear illustration of the limitations of even relatively advanced frameworks. The state has a formal two-part structure–one of only two states in Figure 7 do so. However, the capacity reservation charge of INR 50–60/kVA per month recovers only about 21 per cent of the estimated monthly fixed cost of INR 280/kVA (PSERC 2025). An energy charge of 125 per cent of the applicable tariff for actual drawal is also applicable. A 5 MW consumer contracting standby without drawing power pays approximately INR 3 lakh per month, leaving an estimated fixed-cost gap of INR 11 lakh per month, which is approximately INR 1.3 crore annually. In the absence of cost-reflective standby charges, discoms socialise these backup costs across all consumers or resort to ad hoc surcharges.
B. Designing cost-reflective standby charges is challenging
Designing fair and cost-reflective standby charges is not straightforward. Discoms and regulators face several structural challenges in pricing standby services appropriately (Figure 8).
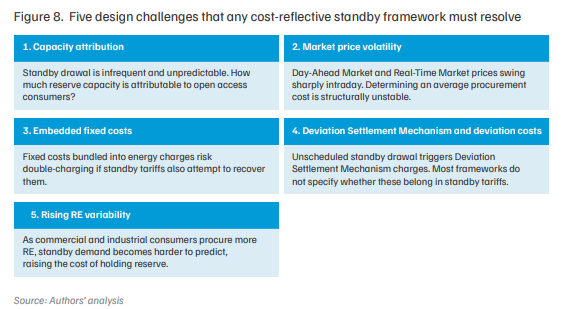
Challenge 3 is directly linked to the tariff rebalancing argument presented in the AS section. As states correct the fixed–variable cost bundling problem, standby pricing becomes simultaneously easier to implement, because the risk of embedded fixed-cost double-charging diminishes.
Given these challenges, regulators require a structured and transparent approach to standby provisioning. Maharashtra demonstrates that a workable solution exists despite these challenges. Its four-tier commitment framework resolves Challenge 1 (capacity attribution) through contractual commitments, and Challenges 2 and 4 (market pricing and DSM [deviation settlement mechanism]) by anchoring charges to demand rates rather than spot prices. Figure 9 illustrates this structure.
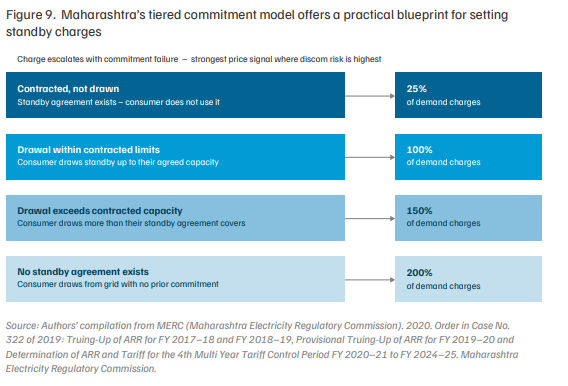
The framework has three key advantages. First, advance commitments allow discoms to estimate reserve requirements, directly addressing Challenge 1. Second, the escalating penalty structure creates strong price signals against unplanned drawal, reducing the exposure to market price volatility from Challenge 2 (Kokate and Josey 2025). Third, anchoring charges to demand rates rather than energy rates keeps the framework compatible with tariff rebalancing–as fixed charges rise, standby charges increase proportionally without double-counting.
Looking ahead, two structural shifts could transform how standby services are priced. The growth of ancillary services and balancing markets may enable reserve capacity to be procured competitively rather than through administrative tariffs. In parallel, digitalisation and advanced metering may enable real-time standby pricing linked to grid conditions, allowing consumers to manage standby risk through storage or third-party flexibility providers.
Recommendations
A rational standby charge framework must balance two objectives: enabling discoms to recover the cost of maintaining reserve capacity while ensuring predictability and fairness for OA consumers. At present, many state-level mechanisms remain ad hoc or poorly aligned with the underlying cost drivers of standby supply. The following recommendations set out a phased roadmap to improve transparency, strengthen tariff design, and integrate standby provisioning into broader system planning.
| Timeframe | Stakeholder | Recommendation | Expected outcomes |
|---|---|---|---|
| Short (1 year) |
Discoms and SERCs | Publish quarterly block-wise data on stranded capacity, including OA drawal, scheduling deviations, and reasons such as curtailment, outages, or economic dispatch. Data must be publicly available on discom and SERC websites. | Improve transparency and allow stakeholders to independently verify AS calculations. |
| SERCs | Require discoms to demonstrate a clear causal link between OA transactions and generator back-down before approving AS. Exclude RE curtailment, demand forecasting errors, and other operational causes from AS computation. | Ensure AS reflects genuine stranded capacity and reduce regulatory disputes and litigation. | |
| Discoms and SERCs | Integrate OA demand trends into power-procurement planning and resource adequacy assessments. | Reduce the risk of future stranded capacity and improve long-term procurement efficiency. | |
| Medium (2–4 years) |
SERCs | Implement phased tariff rebalancing by progressively increasing fixed charges and reducing energy charges, beginning with C&I categories. Protect low-consumption domestic consumers through targeted support rather than suppressed fixed charges. | Improve recovery of fixed costs through tariffs and reduce reliance on AS. |
| SERCs | Introduce sunset provisions for AS in states where tariff rebalancing substantially improves fixed-cost recovery. Once fixed charges cover their intended cost base, the rationale for AS disappears, and the charge should be phased out. | Phase out AS where it no longer serves a meaningful cost-recovery function. |
3.4 Banking charge
Purpose, legal basis, and design
Renewable energy banking allows generators to inject surplus electricity into the grid and withdraw an equivalent amount later when their own generation declines. The grid temporarily absorbs the surplus and returns energy when required. Like standby charges, banking is a payment for a grid-balancing service rather than compensation for revenue loss. By enabling temporal adjustment between generation and consumption, banking helps consumers manage renewable variability and improves the utilisation of intermittent resources.
India introduced RE banking in 1986 in Tamil Nadu for wind generators as a promotional mechanism to support early RE deployment. States such as Maharashtra and Karnataka allowed annual banking with minimal or no charges, enabling generators to bank most of their surplus RE and withdraw it within the settlement period. These policies were instrumental in scaling renewable capacity when technology costs were high and grid integration frameworks were still being developed.
As RE costs fell from approximately INR 14.5/kWh in 2010 to below INR 3/kWh today, the economics of banking changed (Casey 2024). States now apply banking charges typically in the range of 8–10 per cent of the banked energy, with settlement timelines varying across states, including intraday, monthly, and annual adjustments, depending on regulatory frameworks.
To harmonise banking provisions across states, the central government notified the GEOA Rules 2022. The rules state that banking, where permitted, should be settled at least monthly and capped at 8 per cent of banked energy. The rules also specify that states should allow banking of RE up to 30 per cent of the consumer’s total electricity consumption in a month, subject to regulatory approval.
Drivers for reform
Banking originally functioned as a promotional instrument but has increasingly become a source of operational and financial pressure for discoms, particularly as solar penetration created large midday surpluses that consumers banked and then withdrew during evening peak hours at the discom’s cost. The following factors explain why several states are revisiting their banking frameworks.
A. Banking services are often not cost-reflective
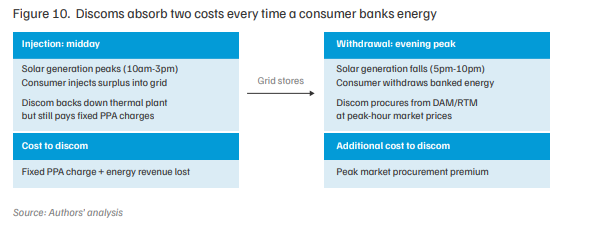
When consumers bank energy, discoms incur two distinct costs. The first is a back-down cost: surplus RE injected during midday forces discoms to curtail contracted thermal generation while continuing to pay fixed-capacity charges. The second is a peak procurement premium: when consumers withdraw banked energy, typically during evening peak hours, discoms must source replacement power from short-term markets at prices substantially higher than what they would have paid from their contracted portfolio. Figure 10 shows why this mismatch is structural rather than incidental.
When consumers bank energy, discoms incur two distinct costs: back down cost and peak procurement premium.
Discoms, therefore, argue that banking effectively forces them to absorb the cost of balancing renewable variability for OA consumers (UPPCL 2024). For instance, an assessment of Karnataka’s banking framework estimated that discoms incurred losses of INR 0.50–0.70/kWh due to banking provisions in FY2020–21, amounting to approximately INR 253–350 crore for around 5,000 MU of OA consumption (Dixit et al. 2022). Such experiences have prompted regulators to reassess whether existing banking charges adequately reflect underlying system costs.
B. States are tightening banking provisions and moving towards a de facto ‘no banking’ regime
Several states have begun modifying banking rules to better align withdrawals with evolving system conditions (Gulia et al. 2021)
In Maharashtra, recent regulatory changes have linked banking withdrawals more closely with time-of-day (ToD) scheduling (MERC 2025). These changes were made to reflect the state’s evolving supply profile, where growing solar capacity is expected to create substantial midday generation surplus. Under the revised framework, the ability to shift large volumes of low-cost daytime solar generation to high-value other periods is significantly constrained. As a result, the effective substitution of discom supply through OA renewable procurement may decline from now 50–65 per cent of a consumer’s demand to around 30–40 per cent, depending on project configuration. Although elements of this framework have faced legal challenges and remain under review, the regulatory direction indicates increasing scrutiny of banking arrangements (Deshpande 2025).
Rajasthan has retained annual banking but introduced several restrictions. The state now limits banking primarily to captive renewable projects and excludes third-party OA transactions. It also caps the banked quantum at 25 per cent of monthly injected energy or 30 per cent of the consumer’s monthly consumption, whichever is higher (RERC 2023).
Gujarat continues to permit banking but levies one of the highest charges in the country, currently around INR 1.50/kWh (Mathew 2026). The regulator has also commissioned a study to assess appropriate banking charges under different renewable penetration scenarios (Kumar 2023). Although the status of this study remains unclear, the approach indicates a shift towards cost-reflective pricing of banking services.
C. Banking may be a transitional instrument as alternative balancing mechanisms mature
Battery storage costs have fallen from approximately INR 13,860/kWh in 2020 to around INR 8,400/kWh in 2025 and are projected to decline further (Chojkiewicz et al. 2025). The day-ahead market and real-time market have expanded significantly, creating new flexibility mechanisms for managing short-term imbalances (Jarbratt et al. 2023; Das and Rodrigues 2025). Green hydrogen and hybrid renewable-plus-storage procurement are emerging as additional alternatives. As storage costs decline and market mechanisms mature, the role of banking is becoming increasingly redundant. The question is therefore shifting from whether banking should continue in its current form to how and at what pace states should transition from banking-dependent procurement to market-based balancing mechanisms.
Recommendations
A reformed banking framework must balance grid reliability, discom cost recovery, and operational flexibility for RE consumers. As renewable penetration increases and alternative balancing mechanisms emerge, regulators will need to gradually transition banking from a promotional policy instrument to a priced grid-balancing service. The following recommendations outline a phased pathway to support this transition while minimising regulatory uncertainty for market participants.
| Timeframe | Stakeholder | Recommendation | Expected outcomes |
|---|---|---|---|
| Short (1 year) |
FoR | Develop model guidelines for standby charge design, including cost components, tariff structures, reporting standards, and commitment agreements. | Harmonise regulatory approaches across states and improve investor confidence. |
| Discoms | Publish quarterly data on standby demand contracted, standby power drawn, and associated revenues on their websites. | Improve transparency and enable evidence-based charge determination. | |
| SERCs | Mandate two-part standby tariffs, drawing on Maharashtra's tiered framework. | Align standby tariffs with underlying cost drivers. | |
| Discoms and SERCs | Require mandatory standby commitment agreements. | Improve capacity planning and prevent free-riding on the discom reserve capacity. | |
| Medium (2–4 years) |
Discoms and SERCs | Integrate standby commitments into resource adequacy assessments and power-procurement planning. | Enable better forecasting of reserve requirements and reduce the risk of stranded capacity. |
| CERC, SERCs, and market institutions | Enable the procurement of standby services through ancillary services and balancing markets. Reserve capacity sourced competitively reduces administrative pricing risk and links standby costs to actual market conditions. | Transform the standby supply from an administrative tariff into a market-based reliability service. |
3.5 Parallel operation charge (POC)
Purpose, legal basis, and design
Parallel operation charges–also known in some states as grid support charges (GSC)–are levied on captive power plants (CPPs) that operate in parallel with the grid. These charges compensate discoms for grid support services provided to captive users, including maintaining stability, offering backup during outages, and managing voltage and frequency imbalances. Discoms argue that CPPs, while drawing reliability from the wider network, also introduce what is termed ‘grid pollution’–disturbances in power quality arising from harmonic injection, reactive power imbalances, voltage dips, and frequency fluctuations. These technical disruptions, they contend, impose measurable costs on the distribution system, justifying a compensatory levy.
The Electricity Act, 2003, empowers SERCs under Sections 86(1)(f) and 86(1)(g) to determine fees, which form the legal basis for the levy of POC. The Supreme Court, in its 2019 ruling (Civil Appeal 4569 of 2003), upheld POC as a legitimate “service charge” payable to discoms, affirming its distinct legal standing from other OA charges. However, there is no national framework governing POC, and it is levied only in states where SERCs have exercised their powers under Section 86.
Over the years, POC has evolved through a series of judicial and quasi-judicial rulings. Decisions of the Appellate Tribunal for Electricity in certain cases have clarified three key aspects: (i) SERCs hold jurisdiction over the charge; (ii) POC applies only to co-located captive loads; and (iii) POC is distinct from CSS and AS (Rain CII Carbon (Vizag) Ltd vs Andhra Pradesh Electricity Regulatory Commission & Others [2023]; Hindalco Industries Limited vs Madhya Pradesh Electricity Regulatory Commission & Others [2021]; Salasar Steel & Power Ltd vs Chhattisgarh State Power Distribution Company Ltd & Another [2016]). Researchers have aptly termed it a “litigious levy” in their examination of this jurisprudence (Sanjay et al. 2025, 1). Its incidence and structure have largely been charted in courts and tribunals; however, these orders have resulted in inconsistent methodologies across states.
Drivers for reform
The case for reforming POC arises from both design inconsistencies and a shifting technological and regulatory landscape. Originally designed as a compensation mechanism for discoms managing grid disturbances from large synchronous captive units, the rationale and methodology behind POC are increasingly under scrutiny. The most pressing issues are detailed here:
A. Evolving regulatory mandates on power-quality monitoring
Amendments to the CEA’s Technical Standards for Connectivity to the Grid (2019) now mandate both discoms and bulk consumers to undertake continuous power-quality monitoring (CEA 2019). Bulk consumers are required to install power-quality meters and share data with discoms at specified intervals, with compliance required within 12 months of the amendment’s notification. Simultaneously, discoms must install such meters at a minimum of 33 per cent of their 33 kV substations annually, achieving full deployment within three years. The regulations also require periodic measurement of parameters such as voltage sag, swell, flicker, and harmonics, with data to be shared with consumers.
B. A patchwork of methodologies
There is no single framework governing POC (see Figure 11). Some states, such as Madhya Pradesh and Gujarat, continue to rely on installed capacity, reflecting legacy approaches from the early 2000s when monitoring infrastructure was still in its infancy. Andhra Pradesh and Telangana, in contrast, link the charge to utilities’ repair and maintenance (R&M) expenses, arguing that this better reflects the cost of grid upkeep. Rajasthan, after commissioning a study by the Electrical Research and Development Association (ERDA), introduced a hybrid framework, using base MVA capacity for conventional captive plants and power-quality-linked computation for renewable ones. This heterogeneity raises concerns about fairness and comparability across jurisdictions. As a result, captive consumers (especially those transitioning to RE-based CPPs) face cost uncertainties that affect project viability.
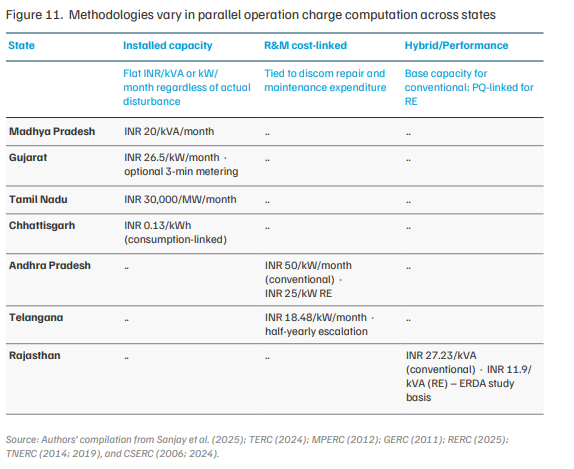
C. Double counting and design overlap
Across several states, POC overlaps with existing fixed-demand charges or standby charges, raising concerns of double recovery (see Figure 11). Captive consumers argue they already pay for grid reliability through sanctioned-load demand charges, and that imposing POCs effectively charges them twice for the same reliability cushion. This undermines transparency for C&I consumers and increases litigation risks. Discoms counter that contract demand only secures capacity; it does not cover the instantaneous reactive power and voltage balancing required for parallel operation (APERC 2025). In practice, this distinction is difficult to verify without actual power-quality measurement data, which is precisely what the CEA’s 2019 mandate is intended to provide.
D. Transparency and evidence deficit
Despite its technical justification, POC lacks a robust empirical foundation. Most SERCs rely on limited technical studies, often based on fewer than 10 plants–an inadequate sample given India’s 72.8 GW captive capacity across nearly 2,900 large plants of 1 MW+ capacity (India Infrastructure Research 2021). No state publishes a detailed cost breakdown or measurable benefits derived by discoms from parallel operation. As a result, captive users argue that they pay a ‘black-box’ levy, as they have no visibility into how grid pollution is quantified, how much of the revenue is actually used for grid improvement, or even whether discoms are monitoring harmonics as required. For regulators, this lack of evidence limits their ability to fairly adjudicate POC petitions or to challenge poorly substantiated claims. Discoms, too, are disadvantaged, as the lack of data prevents them from justifying differentiated treatment across technology types or system configurations.
E. Outdated logic of levying POC with rising renewables
Captive generation has evolved significantly, with wind–solar hybrids, waste-heat recovery, and biomass cogeneration increasingly being preferred over traditional coal-based captive units. However, POC remains calibrated to the operational patterns of old thermal plants. Captive RE plant owners note that RE-based CPPs inject fewer disturbances, operate intermittently, and often provide ancillary flexibility through storage, yet are still billed at par with fossil-based units (APERC 2025). Studies also show that inverter-based renewables can introduce harmonics, which are mitigated through in-built harmonic filters in advanced inverters (Kaur and Bath 2025). As power-quality meters mandated under CEA’s 2019 Connectivity Regulations become operational, discoms will need to move away from presumptive levies and adopt performancebased standards. For discoms, this transition will also require proactive investment in monitoring infrastructure, without which future POC filings may be contested or rejected.
Recommendations
The structure and levy of POC vary widely across states due to limited technical evidence and evolving jurisprudence. This section outlines a roadmap for harmonised, evidence-based regulation that balances discom cost recovery with the fair treatment of captive RE generators.
| Timeframe | Stakeholder | Recommendation | Expected outcomes |
|---|---|---|---|
| Short (1 year) |
SERCs, SLDCs, and discoms | Commission large-sample empirical studies to assess harmonic injection across captive generators, stratified by fuel type. Results should be published and made available for public comment before being used to set charges. | Establish a technical evidence base to inform and differentiate the regulation of POC. |
| RE-based CPPs | Commission independent, plant-level power-quality studies demonstrating actual harmonic injection relative to conventional CPPs. | Support evidence-based differentiation in charges for RE-based captives and equip them with plant-level data to contest unwarranted POC levies. | |
| SERCs | Adopt the FoR Model Power Quality Regulations (2018) to formalise power-quality oversight and establish consistent measurement standards across states. | Align state frameworks with national guidance and provide regulatory certainty for all stakeholders. | |
| Medium (2–3 years) |
Conventional CPPs | Deploy power-quality meters at the point of common coupling (PCC) to document real-time compliance with regulations. Adopt grid-friendly operational protocols (e.g. coordinated switching, load smoothing). |
Enable self-verification, reduce the risk of arbitrary penalties, and improve dispute resolution. Enhance power quality and improve cooperation between generators and discoms. |
| SERCs | Transition from presumptive flat charges to incentive and penalty structures based on verified power-quality violations. Plants demonstrating compliance with harmonic and voltage standards should pay a reduced or zero POC. | Introduce contestable and performance-linked enforcement mechanisms that are technically justified. | |
| Discoms | Install power-quality monitoring infrastructure (e.g. PQ meters and analysers) across transmission and distribution networks, as per the CEA Connectivity Regulations, 2019. | Enable systematic and transparent monitoring of harmonics and power quality, reduce disputes, and support regulatory design. |
3.6 Wheeling charge
Purpose, legal basis, and design
Wheeling charges represent the cost paid by users (including OA consumers) for using the discom’s network to transport electricity from the point of injection to the point of consumption. In essence, they are the fee for using the grid’s wires similar to a toll paid for using a public road. These charges are levied to compensate discoms for maintaining and operating the network that enables the physical delivery of electricity.
Wheeling charges are derived from Section 42(2) of the Electricity Act, 2003, which mandates distribution licensees to provide non-discriminatory OA to their network, subject to the payment of applicable wheeling charges as determined by SERCs.
The NTP 2016 reinforces the principle of cost-reflective network pricing, encouraging SERCs to establish transparent methodologies for computing wheeling charges based on voltage level, energy flow, and network usage. More recently, the Electricity (Amendment) Rules, 2024, provide further regulatory clarity by prescribing that wheeling charges be computed as the ratio of aggregate revenue requirement (ARR) towards wheeling to the total energy wheeled during the year, thereby standardising the basic computation principle across states.
Drivers for reform
Wheeling charges are among the least contested among discoms, RE developers, and consumers. However, our consultations and regulatory review indicate that persistent gaps in data systems and cost allocation practices undermine the transparency and accuracy of these charges. If wheeling charges fail to reflect true infrastructure costs, discoms may underinvest, jeopardising the financial viability of future grid capacity. To unpack these issues, Annexure I maps the prevailing stepwise methodology for computing wheeling charges, highlighting how current stages fall short in practice. The key structural challenges that necessitate reform are as follows:
A. Lack of voltage-wise asset accounting
Most discoms lack an audited and granular record of fixed assets segregated by voltage level. In practice, asset costs are allocated across 33 kV, 11 kV, and low tension (LT) systems using proxy indicators, such as line length or transformation capacity. While pragmatic, this approach is an approximation that may not accurately reflect the value or utilisation of assets serving different consumer categories. Completing the voltage-wise fixed-asset register, as mandated in several states’ tariff regulations, would enable future wheeling-charge calculations to be based on verifiable data rather than derived estimates.
B. Use of estimated network costs based on standard material rates
In several cases, where the present cost of network assets cannot be ascertained from the fixed-asset register, discoms estimate costs using store-rate circulars for standard line spans and transformers. While this provides a temporary basis for apportionment, it can distort asset valuation, particularly in networks with a significant share of legacy infrastructure.
C. Reliance on benchmark loss assumptions
Several discoms lack metering at intermediate voltage levels, leading regulators to rely on benchmark or historical loss percentages from earlier orders. This can obscure actual network efficiency and unfairly distribute losses across voltage levels. Progressive roll-out of feeder and substation metering, combined with periodic energy audits, would enable the segregation of actual losses, thereby improving the accuracy of wheeling-charge determination.
D. Uniform charges obscure cost diversity, but locational pricing raises equity concerns
maintain uniform tariffs across states, many commissions prescribe an average wheeling charge applicable to all discoms. While administratively convenient, this averaging can conceal significant cost differences between urban and rural networks or between developed and lagging service areas. However, moving towards region-specific wheeling charges also raises equity concerns. Network investments in one region may be driven by generation or load located elsewhere–for instance, distribution infrastructure built near renewable clusters may primarily serve demand centres located outside that region. Assigning higher wheeling charges to consumers in such cases could therefore shift system costs onto consumers who are not the primary beneficiaries. As improved network data becomes available, regulators will need to balance cost transparency with tariff equity when considering more granular pricing.
Consumers have repeatedly raised these concerns in regulatory proceedings before various SERCs. Table 4 illustrates the diversity in state practices across key components of wheelingcharge computation.
| State | Gross fixed assets (Y/N) | Updated data on voltage-wise losses (Y/N) | Uniform charge across all discoms within the state (Y/N) |
|---|---|---|---|
| Maharashtra | No − uses 60:40 (HT:LT) ratio to segregate network costs. | No − uses the same ratio of 7.5:12 (HT:LT) as in the previous tariff order. | Yes − MSEDCL is the single discom for the entire state, except for Mumbai. |
| Andhra Pradesh | Yes − a separate GFA is used for each discom to determine R&M costs, return on equity, and depreciation. | Yes − based on historical performance and implemented loss-reduction measures. | Yes − the ERC considers uniform WCs across three discoms to be in the public interest and to promote RE. |
| Gujarat | No − uses 30:70 (HT:LT) ratio to segregate network costs. | Yes − based on energy data reported by SLDC (metered) and consumption norms (unmetered). | Yes − uniform WC for all four discoms. |
| Rajasthan | Yes − a separate GFA is used for each discom, as per the fixed asset register (FAR) updated as of 31 March 2024. | No − voltage-wise losses, as determined in the RERC order dated September 19, 2006, are used. | Yes − ERC determines a uniform WCC for all three discoms, as the prevailing tariff is also uniform. |
| Karnataka | No − uses 30:70 (HT:LT) ratio to segregate network cost. | Yes − different voltage-wise losses are considered for each ESCOM as per the energy flow diagrams furnished by them. | No − Separate WCs determined for each of the five discoms. |
| Tamil Nadu | No − uses 30:70 (HT:LT) ratio to segregate network cost. | No − voltage-wise losses, as determined in the TNERC order dated 13 March 2018, are applied. | Yes − TANGEDCO is the sole discom for the entire state. |
Para 8.5.5 of the NTP 2016 stipulates that wheeling charges be determined on the same principles as intra-state transmission charges, which are capacity-based (INR/MW/day). In practice, however, most SERCs compute wheeling charges on an energy basis (INR/kWh). The Electricity (Amendment) Rules, 2024, codified this divergent approach centrally, prescribing wheeling charges as the ratio of wheeling ARR to energy wheeled. The FoR's Model Regulations for Green Energy Open Access similarly adopt an energy-based formula. This departure from the NTP was never formally justified in any regulatory order or policy document.
The underlying rationale appears linked to RE integration. Solar plants operate at CUFs of 17–25 per cent and wind at 25–35 per cent, compared with 55–70 per cent for thermal. Under capacity-based charging, an RE generator would pay the same per-MW network charge as a thermal source but deliver far fewer units, making effective per-unit wheeling costs 3–4 times higher. The RERC, in a 2019 order, struck down Rajasthan discoms' attempt to levy wheeling at 100 per cent CUF for RE projects, holding that charges must reflect the energy actually wheeled.
From a cost-reflectivity standpoint, however, distribution network costs are predominantly fixed (depreciation, RoE, interest on loans) and driven by peak capacity rather than energy throughput. A capacity-based charge, as envisaged in the NTP, is therefore theoretically sounder. One potential resolution is demand aggregation, whereby multiple LT-connected consumers pool demand and pay on cumulative capacity, thereby averaging out low RE CUFs. The 2023 GEOA amendments enabled such aggregation, but no scalable model has yet emerged at the distribution level. Until such models develop, the energy-based methodology remains a pragmatic accommodation—one that the Electricity (Amendment) Rules, 2024 have elevated from state practice to central policy, effectively superseding the NTP's original direction.
Recommendations
Wheeling charges often misrepresent actual network costs due to outdated metering, asset records, and accounting practices. This section identifies critical reforms to improve cost accuracy, enhance transparency, and enable discom-wise, voltage-level tariffs. It recommends phased reforms in metering, asset mapping, and accounting to support fair, data-driven charge design in a high-renewable grid.
| Timeframe | Stakeholder | Recommendation | Expected outcomes |
|---|---|---|---|
| Short (1 year) |
Discoms | Leverage Revamped Distribution Sector Scheme (RDSS) implementation to prioritise feeder- and distribution-transformer-level metering, enabling voltage-wise loss assessment and network cost segregation. | Enable accurate assessment of voltage-wise losses across the distribution network, improve wheeling-charge computation, and strengthen regulatory confidence in data integrity. |
| Medium (2–4 years) |
SERCs | Discontinue uniform wheeling charges in large multi-discom states and prescribe discom-wise wheeling tariffs based on actual network costs. | Improve cost accuracy, reinforce financial accountability, and link network performance to tariff design. |
| Discoms | Modernise and digitise FARs with voltage-wise tagging for new investments, digitise legacy assets, and adopt GIS-based systems. | Enable cost-reflective wheeling tariffs and support prudent network planning in RE-rich distribution grids. |
4.1 Why corporate renewable procurement is becoming a strategic necessity
Commercial and industrial consumers across the US, UK, China, South Africa, and Brazil are accelerating their shift towards RE, even in jurisdictions where industrial power tariffs are lower than or comparable to retail tariffs (Gokarn et al. 2022) (see Figure 12). Cost arbitrage no longer drives this shift; instead, it is shaped by compliance obligations, investor scrutiny, supplychain mandates, and trade exposure. India is on the same trajectory. As Chapter 3 shows, tariff reforms, tightening banking provisions, and improved discom cost recovery will steadily compress the pure cost advantage that underpinned RE OA procurement. What remains– and what is growing–is the strategic necessity to procure clean, firm, and traceable energy, regardless of whether it is cheaper than grid supply.
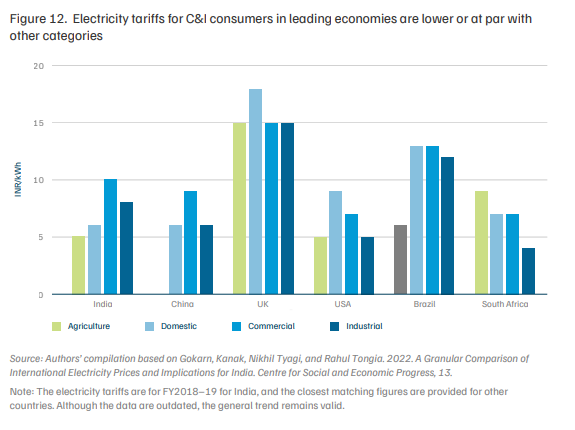
Against this backdrop, RE procurement is increasingly shaped by sustainability, risk management, and long-term competitiveness. Senior Indian business leaders overwhelmingly support the transition to RE, not merely as a cost-saving measure but as a strategic necessity.2 This shift is driven by a combination of regulatory mandates, market incentives, and strategic pressures linked to trade, finance, and corporate reputation. These drivers can be grouped into three broad categories: regulatory push, market pull, and strategic imperatives, discussed in the following subsections.
Regulatory push: Mandates are driving corporate decarbonisation
Around the world, governments are strengthening environmental mandates that encourage corporations to adopt sustainability practices. These regulatory push factors include energy and climate laws, RE obligations, and emissions trading schemes:
• Energy laws and renewable quotas: China recently enacted its first comprehensive Energy Law (effective 1 January 2025), which prioritises carbon emission control and clean energy. The law establishes a ‘dual-control’ system that caps both total carbon emissions and intensity, and sets minimum RE consumption targets that extend responsibilities beyond just grid companies to include power suppliers, consumers, and even CPPs (National Energy Administration 2024). In effect, large energy users in China are now required to consume a certain share of renewable power, a clear mandate for the industry to green its energy mix. The law also promotes green electricity certificates as a mechanism to incentivise compliance (Climate Cooperation China 2025). This mirrors India’s renewable consumption obligations (RCOs), which require designated consumers to source an increasing percentage of their power from renewable sources. India has set an ambitious trajectory for RCOs–requiring nearly 44 per cent of power supply to come from renewables by 2030 (MoP 2025c). Such mandates are compelling corporations to invest in RE procurement or face penalties.
• Emissions trading and carbon pricing: The EU’s Emissions Trading System (EU ETS) has long placed a price on carbon emissions and is tightening significantly under updated climate goals. The EU is phasing out free emission allowances for industries, lowering the cap on allowed emissions, and thereby increasing carbon costs for companies (Singh et al. 2025). Heavy industrial emitters in Europe must therefore either reduce emissions or purchase increasingly expensive carbon permits, making carbon-intensive production progressively less economically viable.
China has also launched a national emissions trading scheme in recent years (initially covering the power sector) and plans to expand it to additional industries, signalling that pollution will carry an economic price in the world’s largest manufacturing base.
India is following a similar trajectory: amendments to the Energy Conservation Act, 2001 have paved the way for a domestic Carbon Credit Trading Scheme (CCTS), essentially a carbon market, to place an implicit price on CO₂ emissions. Once operational, this will create compliance carbon costs (or opportunities to earn credits) for Indian companies, aligning with the ‘polluter pays’ principle. Collectively, these developments indicate a rising regulatory risk associated with carbon emissions. Companies that ignore sustainability may soon incur higher costs or lose market access. By contrast, those that proactively decarbonise can turn regulation into a competitive advantage.
Market pull: Incentives and green finance encouraging sustainability
• India’s sustainability architecture is maturing with new taxonomies and rules: A series of recent frameworks are closing the gap between aspiration and action, tightening the rules around sustainability disclosures, performance, and accountability. The forthcoming Climate Taxonomy will direct both financial and non-financial institutions to invest only in listed sustainable activities, thereby reducing greenwashing and improving capital allocation (MoF 2025). Simultaneously, the newly announced GHG Emission Intensity (GEI) Target Rules, 2025, will require major industrial sectors (steel, paper, cement, aluminium, and chlor-alkali) to either reduce emissions or purchase Indian carbon credits, anchored to FY24 baselines for FY26–27 targets (MoEFCC 2025). The Green Steel Taxonomy introduces a star-rating system (1–5 stars) for finished steel emission intensity (e.g., ≤ 1.6 tCO₂e/tfs for 5 stars), creating market signals for lower-carbon production (MoS 2024). Under the Green Hydrogen Certification Scheme, 2025, hydrogen producers must meet ≤ 2.0kg CO₂e/kg H₂ to claim ‘green’ status and earn tradable certificates (MNRE 2025). Together, these developments are shifting RE procurement from a voluntary cost play to a strategic imperative. Large C&I consumers cannot ignore these developments if they want to maintain credible climate credentials and competitive positioning.
• Tax credits and subsidies for clean energy: Perhaps the most dramatic example is the US’ Inflation Reduction Act (IRA) of 2022, a USD 370 billion climate policy package. The IRA provides substantial tax credits and funding to lower the cost of RE, energy storage, electric vehicles, and more (IEA 2023). These incentives are directly reducing the cost of clean energy for businesses; the US Environmental Protection Agency (EPA) notes that the IRA’s tax credits (such as the 30 per cent investment tax credit for solar and wind or production tax credits for green power) significantly reduce RE costs for organisations and are “key to lowering GHG footprints and accelerating the clean energy transition” (EPA 2023). The result has been a surge in corporate clean energy investments in the US, as companies seize these financial benefits to build onsite solar, purchase renewable power, electrify fleets, and more. Other countries are deploying their own incentive schemes: the EU’s Green Deal Industrial Plan, as well as Germany and China, offer subsidies, low-interest loans, or rebates for the adoption of energy efficiency measures, renewables, and clean technology. India has introduced production-linked incentives (PLIs) to boost domestic manufacturing of solar panels, batteries, and green hydrogen, and is deploying viability gap funding for key technologies. For instance, the government has provided viability gap funding for standalone BESS to encourage storage deployment, which in turn enables greater integration of RE sources. The first tranche supports 13.2 GWh at up to 30 per cent of capital cost or INR 46 lakh per MWh, whichever is lower (MoP 2024b), while the second tranche, announced in June 2025, supports an additional 30 GWh at a reduced rate of INR 18 lakh per MWh, reflecting falling battery costs (MoP 2025b). These financial incentives are tilting business calculations in favour of sustainable options.
• Green finance and investment flows: Capital markets are increasingly rewarding sustainability. Green bonds, green loans, and sustainability-linked financing have expanded rapidly, providing corporates with access to lower-cost capital for climate-aligned projects. In India, for example, the sustainable debt market has grown rapidly–cumulative green, social, and sustainability bond/loan issuance reached USD 55.9 billion by the end of 2024, nearly doubling since 2021 (Climate Bonds Initiative 2025). Notably, Indian corporates alone raised USD 5.5 billion in labelled green loans in 2024 across 19 companies. This reflects strong investor appetite to finance RE, energy efficiency, and other green initiatives by companies. Internationally, corporations with robust ESG performance benefit from higher valuations and access to a broader pool of climate-focused investors and funds. There is also growth in sustainability-linked loans, in which interest rates are tied to a firm’s achievement of climate targets, effectively providing a financial reward for reducing emissions. In short, access to capital is becoming easier and cheaper for sustainable businesses, while carbon-intensive companies risk a higher cost of capital. This ‘pull’ of green finance is a significant motivator for Indian companies to embrace sustainability, not just for the planet but for financial prudence.
• The declining cost of clean technology itself acts as a market pull. Renewable electricity from solar and wind is now often the cheapest power available. In India, solar and wind tariffs have reached record lows of around INR 2–3/kWh in auctions. Even when firm, RTC power is required, new hybrid renewable models are competitive–recent bids for firm and dispatchable RE (solar/wind combined with storage) have come in at INR 3.09–3.52/ kWh (Chojkiewicz et al. 2025), which is actually lower than the variable cost of running coal-based power plants during available generation hours. This cost advantage aligns sustainability with cost savings. Forward-looking companies are locking in long-term green power contracts to hedge against fossil-fuel price volatility and secure affordable energy. The economics are clear: clean energy often makes business sense, with incentives only further strengthening the case.
Strategic drivers: Global trade and ESG pressures
Beyond domestic policies and economics, corporations are also driven by strategic external pressures–maintaining global competitiveness, meeting stakeholder expectations, and mitigating long-term risks. Four major strategic drivers are shaping corporate behaviour: carbon border adjustments, investor and ESG demands, granular accounting standards, and evolving customer preferences.
• CBAMs and trade factors: Industrial companies in India that export to markets such as the EU or the US are increasingly exposed to carbon-related trade policies. The EU’s CBAM, for instance, will soon impose a carbon levy on imports of emissions-intensive products, including steel, cement, aluminium, fertilisers, electricity, and hydrogen. This effectively transfers the cost of EU carbon pricing to foreign exporters. If an Indian steel producer has a high carbon footprint, its steel exports may incur additional taxes at the EU border, eroding price competitiveness. Early analyses suggest that CBAM could significantly impact India’s exporters in these sectors, particularly by the late 2020s, when full implementation is expected to begin (Singh et al. 2025). Indian companies thus face a strategic choice: decarbonise their processes or risk losing market share abroad. Forward-looking companies are already responding. For example, some Indian steel and aluminium producers are exploring low-carbon technologies (such as green hydrogen for steel or increased scrap recycling) to pre-empt trade barriers. The Indian government is also developing a framework, including a domestic carbon market and revised measurement, reporting, and verification (MRV) standards, to help industries align with global carbon standards. India already has the world’s largest green hydrogen mission, with federal and state incentives that could provide up to USD 61 billion in support (Pal et al. 2025). Notably, smaller manufacturers and micro, small, and medium enterprises (MSMEs) in export supply chains face significant challenges, as many lack the tools to measure and reduce carbon emissions, placing them at risk of losing access to overseas customers. Mechanisms such as CBAM are therefore transforming sustainability into a survival imperative for exportoriented companies.
• ESG and investor pressure: Alongside trade, finance markets and corporate governance are exerting growing pressure. Environmental, social, and governance criteria have transitioned from a niche concern to a mainstream determinant of investment decisions. Large institutional investors (including pension funds, sovereign wealth funds, and asset managers) now often require robust ESG performance and transparent disclosures from companies they invest in. This means a company’s carbon emissions, climate risk management, and sustainability initiatives are under continuous scrutiny. Weak ESG ratings may result in investor divestment or higher capital costs. In India, the Securities and Exchange Board of India (SEBI) has introduced new sustainability disclosure requirements through mandatory Business Responsibility and Sustainability Reporting (BRSR) for toplisted companies. As of 2023, SEBI is rolling out BRSR Core, a set of key ESG indicators that companies must report and eventually be assured of. This regulatory shift is driven by investor demand for credible data (Mehta et al. 2025). For corporations, this means that transparency regarding emissions and environmental impact is no longer optional, and any lack of a sustainability plan could harm their stock price or ability to raise funds. Global rating agencies and ESG analysts compare companies on metrics such as carbon intensity per revenue and water usage, which influence investor appetite. Moreover, many multinational corporations are cascading ESG pressure down to their suppliers. See Box 3 for information on how Apple and other companies are collaborating with their suppliers to meet their greener electricity requirements.
• Greenhouse Gas (GHG) Protocol reforms to reshape Scope 2 accounting: A landmark revision of the GHG Protocol’s Scope 2 Guidance is underway, with the first draft released in October 2025. This revision proposes ‘granular accounting’, requiring RE procurement to be matched with consumption on an hourly and regional basis (Greenhouse Gas Protocol 2025; EnergyTag 2025). If adopted, this will transform global ESG disclosure practices by disallowing generic RE certificates that do not reflect physical grid realities. As the GHG Protocol serves as the foundation for global frameworks such as the Corporate Sustainability Reporting Directive (CSRD) and the International Sustainability Standards Board (ISSB), this shift will gradually influence India’s ESG expectations as well. Although the standard is expected to be enforced by 2029, early movers may gain a strategic advantage. For instance, Midea Group’s Chinese factory already follows hourly-matched PPAs (EnergyTag 2025). In India as well, AM Green’s Kakinada facility has voluntarily adopted these standards to futureproof its exports (ICN Bureau 2024). These moves signal a clear trend that 24/7 clean energy with temporal and locational traceability is likely to become the new global bar for credible climate claims.
• Reputation and customer expectations: Public sentiment and consumer behaviour add to the strategic rationale. Consumers, particularly in developed markets and among younger demographics, are increasingly favouring brands with strong environmental commitments (von der Gathen et al. 2024). For multinational firms, sustainability is therefore not only an ethical commitment but a commercial necessity. This cascades into their operations in India and across their local supply chains. Even within India, corporate customers (such as IT firms leasing office space or automakers sourcing parts) are increasingly favouring partners that align with their sustainability values. Being a ‘green company’ enhances brand value, helps attract and retain talent (many young professionals prefer to work for responsible companies), and reduces exposure to activist pressure or regulatory scrutiny (Deloitte 2025). In an era of instant information flows, companies perceived as heavy polluters or indifferent to climate concerns could face significant reputational risks. In contrast, sustainability leaders often benefit from positive media coverage and goodwill.
4.2 The shift in C&I clean energy procurement models
As the drivers outlined in Section 4.1 intensify, corporate RE procurement in India will undergo a structural shift. Historically, most C&I consumers relied on plain solar or solar–wind hybrid projects to meet 50–65 per cent of annual electricity demand. These arrangements were enabled by generous banking provisions and cost arbitrage. This model is now under strain. Tighter banking rules, sharper ToD price differentials, and growing decarbonisation pressures are pushing industrial consumers towards solutions that prioritise assured power delivery rather than installed renewable capacity.
Evidence from recent solar-plus-storage procurement in India suggests that such configurations are becoming increasingly competitive. Recent auction analysis indicates that firm clean power–combining solar generation with battery storage could deliver near RTC supply at tariffs below INR 6/kWh under favourable conditions (Chojkiewicz et al. 2025). A new generation of corporate RE projects is emerging that integrates renewable generation with storage, advanced forecasting, and innovative contracting structures to deliver firm and dispatchable clean power.
Recent projects commissioned or announced over the past two years illustrate how this transition is unfolding. Rather than treating these as isolated case studies, Table 5 synthesises how leading C&I buyers and developers are addressing the underlying challenge of meeting industrial reliability requirements under evolving regulatory and market constraints.
| Project/ Buyer |
Primary objective |
Technology configuration |
Storage strategy |
Power delivery metric |
Market signal |
|---|---|---|---|---|---|
| Hindustan Zinc–Serentica Renewables, 530 MW agreement | Firm renewable power of 315 MW RE for continuous industrial operations | Multi-site solar and wind, integrated with existing RE assets | Battery storage combined with portfolio-level dispatch optimisation | Minimum assured supply in 15-minute time blocks | Shift from annual energy accounting to granular, time-block-based firm supply |
| UltraTech Cement–Gentari, 7.5 MW agreement | On-site resilience and operational stability | Co-located solar, wind, and battery storage (behind-the-meter) | On-site BESS storage | Stable frequency, voltage, and predictable cost at the plant level | Customer-led, performance-oriented energy design |
| Serentica–Greenko, 1,500 MWh pumped storage | Firming renewable supply without owning storage assets | Aggregated solar and wind across locations | Third-party pumped hydro storage (6–8 hours) | Multi-hour dispatchability across peak and non-RE periods | Unbundling of storage ownership from energy supply |
| Hindalco–Greenko, 100 MW round the clock (RTC) | RTC renewable power for electro-intensive processes | Large-scale solar and wind portfolio | Pumped hydro long-duration energy storage | High reliability, suitable for continuous smelting operations | Renewables are becoming viable for energy-intensive baseload industries |
| ArcelorMittal–AM Green Energy, 1 GW agreement | RTC 250 MW clean power at an industrial scale | GW-scale hybrid solar–wind systems | Hydro-based long-duration storage (~6 hours) | Continuous, RTC renewable supply | Renewables are becoming viable for energy-intensive baseload industries |
These projects, while diverse in scale and sector, reveal three common design principles.
1. Reliability, not capacity, is increasingly the product being procured. Buyers are contracting for assured power delivery across time blocks, rather than solely relying on annual or monthly energy balancing.
2. Storage is no longer an optional add-on but a core operational enabler, allowing firms to manage ToD exposure, banking constraints, and process continuity.
3. Market coordination is deepening; developers are aggregating geographically diverse generation, leasing storage, and optimising portfolios.
Together, these trends signal a maturing clean energy market for C&I consumers in India. Corporate procurement is moving decisively from volume-based renewable adoption to reliabilitycentric portfolio design, where storage, forecasting, and contractual innovation are central. As tariff structures become more granular and carbon constraints tighten, such models are likely to shift from being leading-edge examples to becoming the default pathway for deep industrial decarbonisation.
When C&I consumers buy electricity from the discom, the tariff they pay covers not just the cost of power but also network maintenance, cross-subsidy for agricultural and domestic consumers, backup capacity, and grid balancing. When these consumers switch to open access and buy power directly from a renewable energy generator, the discom needs to be compensated for some revenue loss (cross-subsidy, and stranded power purchase cost) and services such as grid balancing, backup arrangements. Open access charges compensate discoms for these continuing costs. Six charges apply: cross-subsidy surcharge (CSS), additional surcharge (AS), standby charge, banking charge, parallel operation charge (POC), and wheeling charge.
Solar power generates most electricity during midday hours, but consumers need power throughout the day, including evenings. Banking allows RE generators to inject surplus power into the grid during the day and withdraw an equivalent amount later. The discom effectively acts as a virtual grid battery. This service has a cost: the discom backs down thermal generation during injection (while still paying fixed charges to generators) and procures replacement power from the market during peak withdrawal hours. Banking charges are meant to recover these costs, but most states either cap the charge or restrict banking volumes rather than pricing the service to reflect actual costs.
Several open access charges exist because underlying tariffs are not cost-reflective, and different reforms affect different charges. CSS exists because C&I tariffs exceed the average cost of supply; as states align the two, the cross-subsidy shrinks, and CSS should fall. AS exists because discoms recover most fixed costs through energy charges; if tariffs were rebalanced toward higher fixed charges, discoms would recover these costs regardless of migration, making AS redundant. Banking charges arise from the mismatch between RE generation and consumption timing; as time-of-day tariffs mature, consumers face signals to align consumption with generation, reducing banking volumes and associated costs. In each case, the open access charge is a symptom of a tariff design problem, not a solution to it.
Several regulatory and market forces are converging. The EU’s Carbon Border Adjustment Mechanism will impose costs on carbon-intensive exports of steel, cement, aluminium, and fertilisers. SEBI’s BRSR framework makes emissions disclosure mandatory for top-listed companies. The GHG Protocol Scope 2 revision proposes hourly matching for reporting, which means companies will need to demonstrate clean energy procurement at a granular level. Sustainability-linked loans tie borrowing costs to emission reduction targets. And multinational supply-chain mandates, such as Apple’s commitment to a 100 per cent carbon-neutral supply chain, require verified renewable procurement from Indian suppliers. Together, these pressures are transforming RE procurement from a cost-driven choice into a compliance and competitiveness requirement.
How can India Create a Demand Flexibility Market?
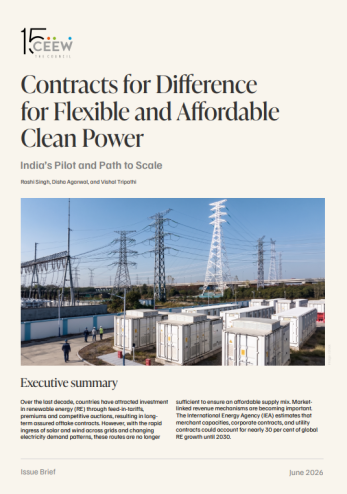
Contracts for Difference for Flexible and Affordable Clean Power
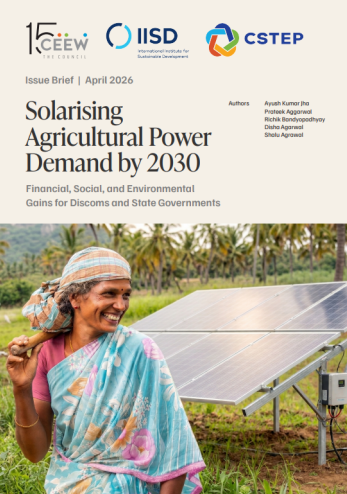
Solarising Agricultural Power Demand by 2030

Scaling Solar Power for Irrigation in India: