


Suggested Citation: Chaturvedi, Vaibhav, and Ankur Malyan. 2021. Implications of a net-zero target for India’s sectoral energy transitions and climate policy. New Delhi: Council on Energy, Environment and Water.
This study presents alternative peaking and net-zero scenarios for India and highlights its implications for transition in the energy-intensive sectors such as electricity, transport, building, and industry. It explores four combinations of peaking and net-zero-year scenarios for India (2030–2050, 2030–2060, 2040–2070, and 2050–2080) and analyses how a combination of possible technological developments like carbon capture, utilisation and storage (CCUS) and hydrogen production would affect the transition within each of the policy scenarios. Further, the study presents sectoral pathways based on 16 policy-technology scenario combinations for the required sectoral transitions and provides insights into India’s climate policy.
The Intergovernmental Panel on Climate Change (IPCC) 1.5o C report highlights the criticality of achieving a net-zero greenhouse gas future. Many countries have announced their commitments to achieve a net-zero future for their economies. India, while doing much more than its ‘fair share’ of mitigation, has yet to announce a net-zero year target, presumably owing to the absence of an India-focused analysis on this issue. This study attempts to address this gap by modelling alternative peaking and net-zero-year scenarios for India, and highlighting its implications for transition in energy-intensive sectors. We model four combinations of peaking and net-zero-year scenarios for India (2030– 2050, 2030–2060, 2040–2070, and 2050–2080) and a combination of technology availability scenarios related to carbon capture and storage (CCS) and hydrogen within each of the policy scenarios. We also present sectoral pathways based on the 16 policy-technology scenario combinations to provide actionable policy insights. We present the implications of these alternative scenarios for the required sectoral transitions across the electricity, transport, building, and industrial sectors in India and provide insights into India’s climate policy. Specifically, for the 2040 peaking–2070 net-zero scenario with no commercial availability of CCS but hydrogen being commercially available, we determine that the following 12 steps across sectors would be critical:
The country would need to bear economic losses due to shift in investments patterns across sectors needed to achieve the peaking and net-zero targets. The shift in investments that would need to happen due to stringent decarbonisation policies implies that investment that was otherwise profitable in the absence of climate change mitigation policies would have to be forgone for the sake of more expensive low carbon choices. The cumulative discounted economic cost for India (discounted up to 2015 at 4 per cent real discount rate between 2015 and 2050, and at 2 per cent for years beyond 2050) in the 2030 peaking - 2050 net-zero scenarios ranges from 1353 to 1872 billion USD (2015 prices) between 2030 and 2050, and 12,562 to 19,318 billion USD, between 2050 and 2100 (Fig: Cumulative discounted policy cost). If the net-zero year is postponed to 2080 with 2050 as the peaking year, there would be no economic costs before 2050 (as no additional efforts beyond the ‘business-as-usual’ progress would be undertaken prior to 2050), and the economic costs between 2050 and 2100 would range from 6555 to 9691 billion USD. Thus, the earlier the net-zero year, the higher the cost. Availability of CCS lowers the economic losses by 23 per cent between 2030 and 2050, and 32 per cent between 2050 and 2100.
Understanding of economic costs is critical not to avoid or delay deep decarbonisation, but to deploy smart strategies to minimise the cost and create an economy of the future in the process. The key to reducing economic losses is to minimise the cost of mitigation technology suite. International financial support in form of low-cost finance has the potential to reduce the overall economic costs. The criticality of low-cost finance and co-development of technologies for a faster reduction in the cost of mitigation technology suite can’t be over emphasised.
It is critical to emphasize that the policy cost of mitigation should not be the deciding factor while choosing a net zero year. India is one of the most vulnerable countries to climate risks, and delaying India’s net-zero year would lead to additional global warming and associated climate change impacts that the country would have to face. India suffered an economic loss of USD 37 billion in 2018 due to climate change (Global Climate Risk Index, 2021). Top Indian companies estimate a loss of nearly USD 100 billion between 2021 and 2025 due to risks posed by the climate crisis (CDP, 2020). As per the World Bank, climate change impacts could reduce India’s GDP by 2.8 per cent per annum by 2050, depressing the standards of nearly half of the country’s population (Muthukumara et al., 2018). While taking a call on the choice of a net-zero year, India’s policymakers need to be cognizant of the nonlinear risks that climate change poses for India.
The IPCC 1.5°C report explored and presented pathways for countries to limit average global temperature increases to 1.5°C by the end of the century (IPCC 2018). The report followed up on the Paris Agreement to limit global average temperature increases to ‘well below 2°C above pre-industrial levels and pursue efforts to limit the temperature increase to 1.5°C above pre-industrial levels’. One of the key insights from the report is that the world needs to achieve net-zero emissions by 2050 to attain the 1.5°C temperature limit objective.
Since the release of the report, support has been growing for the net-zero narrative of climate leadership (UNEP 2020; United Nations 2020; WEFORUM 2020). It would not be an exaggeration to argue that the debate on net-zero has taken the world of climate politics by surprise. More than 125 countries have expressed their support for the net-zero target by either proposing hard laws or at least making public announcements to support the net-zero target (UNFCCC 2020; United Nations 2020). While most of these are confined to mere announcements and not backed by credible road maps, the expression of intention to adopt a net-zero target is an achievement in itself (Rogelj et al. 2021). The willingness at the political level backed by robust analysis is expected to move the aspiration towards faster actions to meet this ambitious, yet achievable target.
Major economies like China, the European Union and the United States have already announced a net-zero target in support of the emerging climate leadership narrative (Froggatt and Quiggin 2021). India, the third largest emitter in the world, is also expected to demonstrate its climate leadership in a world in which the definition of climate leadership is rapidly evolving and increasingly being measured in terms of net-zero commitments. Many researchers have explored a range of deep decarbonisation scenarios to highlight the implications of climate pledges on India’s energy system transformation and associated parameters (Chaturvedi, Nagar Koti, and Chordia 2021; Mathur and Shekhar 2020; Gupta et al. 2019; Vishwanathan et al. 2018; Busby and Shidore 2017; Garg et al. 2017; Shukla et al. 2015). There have also been useful sector-specific deep decarbonisation studies to inform India’s climate policy (Dhar, Pathak, and Shukla 2020; Gadre and Anandarajah 2019; Wang and Chen 2019; Dhar, Pathak, and Shukla 2018; Graham and Rawal 2018).
While numerous economy-wide and sectoral studies exist for informing India’s climate policy, specific detailed analyses that could inform the pathways and implications towards a net-zero target are lacking. To the best of our knowledge, no study so far has presented insights from alternative net-zero scenarios for India. This study attempts to address this gap. We analyse combinations of four alternative peaking-net zero scenarios for India for four different sets of breakthrough technology combinations to highlight key insights for informing India’s choice of a net-zero future. Subsequently, we provide our methodological and scenario framework; Section 3 presents the results from the modelling exercise; Section 4 highlights the discussion of results; and Section 5 concludes with key policy insights.
We used the Global Change Analysis Model (GCAM, CEEW version) to analyse sectoral pathways towards a net-zero future for India. GCAM is an integrated assessment model representing the behaviour of and interactions between energy systems, water, agriculture and land use, economy, and climate (Calvin et al. 2019). In GCAM, the overall structure of the energy system includes three major components: energy resources, energy transformation, and final energy demands, and all the elements of the model interact with each other through market prices and physical flows. Annexure 1 in the online supplementary material presents the GCAM structure in detail with a comprehensive description of the key demand and supply sectors as modelled in GCAM, along with the cost and efficient assumptions across sectors.
To analyse net-zero scenarios within the GCAM structure, emission constraint trajectories were provided exogenously to induce a climate policy restricting emissions at a specific level. The model estimates the carbon price needed to achieve the constraint in each period using the emission constraint approach. After the application of the endogenously calculated cost of carbon, the model framework iterates to determine the most cost-effective method to achieve the emission constraints and, in the process, induces energy system transformation towards cleaner energy sources across sectors (JGCRI 2019). In the context of this study, the emission constraint is applied to CO2 emissions, not greenhouse gas (GHG) emissions, from India’s energy sector. The interventions required to limit non-CO2 GHG emissions (e.g. methane, HFC) as well as CO2 emissions from land-use change are of a different character than energy sector CO2 emissions. Correspondingly, we excluded non-CO2 GHGs from our study. GCAM has been widely used across studies for mitigation scenario analysis at economy-wide and sectoral levels (Chaturvedi et al. 2020; Feijoo et al. 2020; Muratori et al. 2017; Chaturvedi et al. 2014). GCAM has also been used to explore pathways towards net-zero targets in some key regions of the world (Fuhrman et al. 2020; Kaufman et al. 2020).
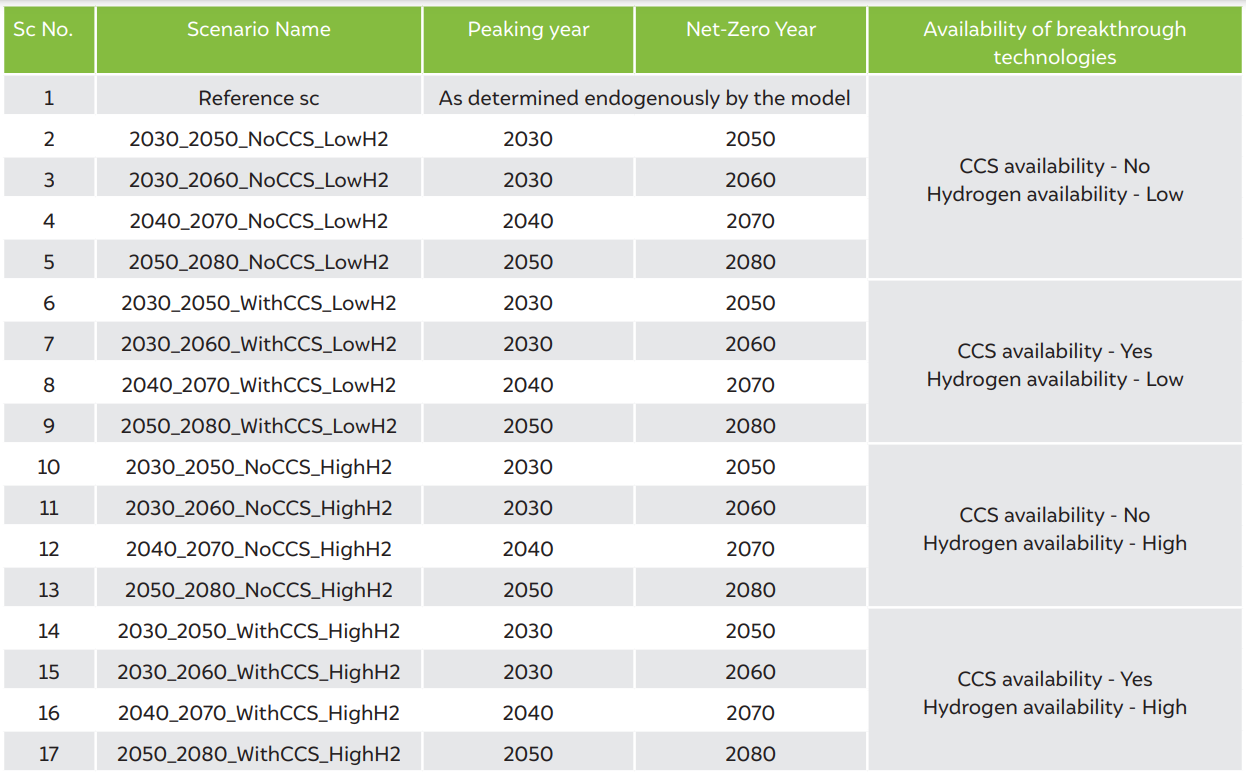
The focus of our analysis is to present insights from alternative policy and technology configurations for informing India’s policy on a net-zero future. Accordingly, we analysed four different combinations of peaking-netzero scenarios, from most ambitious to least ambitious. The rationale for choosing the explored combination is to present a wider range of policy alternatives and highlight the implications of choice. For each of these policy scenarios, we analysed four different technology available sets, woven around the availability of carbon capture and storage (CCS) and hydrogen. Researchers have explored the role of CCS and hydrogen for stricter and faster action against climate change (IEA 2021; Townsend and Gillespie 2020; Hydrogen Task Force 2020; Friedmann et al. 2020; Hall et al. 2020; Vishwanathan et al. 2018; Garg et al. 2017; Viebahn, Vallentin, and Höller 2014). These two technologies are still in a nascent stage of scalable deployment, but can significantly transform the view of a deep decarbonised world. The narrative surrounding CCS in India is gradually evolving, with many government agencies and the private sector expressing enormous interest in this technology (Malyan and Chaturvedi 2021). The National Hydrogen Mission, recently announced by the Indian Prime Minister (Press Information Bureau (PIB) 2021), is set to promote this fuel in India’s energy mix. Nevertheless, the future of these key technologies remains uncertain, and their commercial (un)availability would have significant implications for India’s pathways towards a net-zero future.
In addition, in net-zero scenarios, deploying these technologies could potentially contribute towards easing the extent and pace of penetration of conventional mitigation options such as solar energy in the power sector. Since many countries are making net-zero pledges, the analysis by various global studies highlights that these targets are difficult to achieve without CCS and hydrogen being adopted in a major way. Accordingly, we explored scenarios related to the commercial availability of CCS and hydrogen and its implications for India’s policy choices.
Our Reference scenario (Ref sc) is a progress-asusual scenario in which as gross domestic product (GDP) increases with time, consumers purchase more appliances, vehicles, and services, in line with a growth in their income. Meanwhile, the cost of various lowcarbon technologies declines across sectors, leading to their higher penetration when compared to the base year (2010), even though policymakers have not adopted any dedicated climate policy. In contrast, alternative climate policy scenarios test the implications of the stringency of climate policies formulated in terms of alternative peaking and net-zero-year combinations. The most ambitious scenario is India’s energy sector carbon dioxide emissions peaking in 2030 and reaching net-zero in 2050, against the least ambitious scenario in which emissions peak in 2050 and reach net-zero in 2080. For the most ambitious scenario, we assume that even though peaking does not occur before 2030 (assuming that it would be nearly impossible to peak emissions of a rapidly growing economy before 2030), faster emission mitigation actions start immediately, leading to a lower level of emissions in 2025 and 2030, compared to the Ref sc emissions in these years. Based on an uncertainty assessment presented by Chaturvedi et al. (2021), we assume that emissions in the most ambitious policy scenario would be lower by 5 per cent in 2025 and 15 per cent in 2030 relative to the Ref sc emissions.
In terms of the emission constraint pathway for the other three policy scenarios (2030 peak–2060 net-zero sc, 2040 peak–2070 net-zero sc, 2050 peak–2080 netzero sc), we assume that emissions would follow the trajectory as in the Ref sc until the peaking year, and thereafter decline linearly until the net-zero year. It is understood that in reality, emission pathways may not be exactly linear. The linear decline as assumed by us is a reasonable approximation for our scenario analysis. For each climate policy scenarios, we analyse the implications of alternative futures related to the availability of CCS and hydrogen technologies.
The GCAM philosophy is not based on perfect foresight. In our analysis, the constraint pathway for any policy scenario is exogenously specified and represents a mitigation pathway that policymakers have chosen to achieve a net-zero target. This implies that the model does not determine the time path of emissions based on cost-effectiveness, but offers a cost-effective solution for an exogenously given time path of emissions chosen by the policymaker not solely based on cost, but also on certain larger real work considerations, including domestic compulsions and global climate discourse.
Net-zero is a global debate. In this context, the global framework of GCAM is its strength, as it captures the implications of developments in global energy markets in individual countries. In our analysis, along with the net-zero scenario for India, we also put forth a net-zero constraint on the rest of the world to ensure that there is no carbon leakage. We assume that global emissions will peak in 2025 irrespective of the net-zero scenario as a global net-zero target implies that global emissions have to peak as early as possible, and these reach netzero in the year that India achieves net-zero. Such a formulation allows for differentiation in peaking and net-zero between developed and emerging economies in our scenario setup, while ensuring that the energy sector dynamics in India are in sync with global pathways towards a net-zero future.
Table 1 Scenario Framework
Source: Authors' compilation
Our Ref sc assumes a rapid growth in the Indian economy, with per capita income increasing from USD 1,617 in 2015 (2015 prices) to almost USD 10,500 in 2050 and to USD 36,000 in 2100. Rapid income growth also implies a higher share of urbanisation in the future, with the share of the population living in urban areas expected to increase from 32.7 per cent in 2015 to 50.7 per cent in 2050 and to 74.4 per cent in 2100.
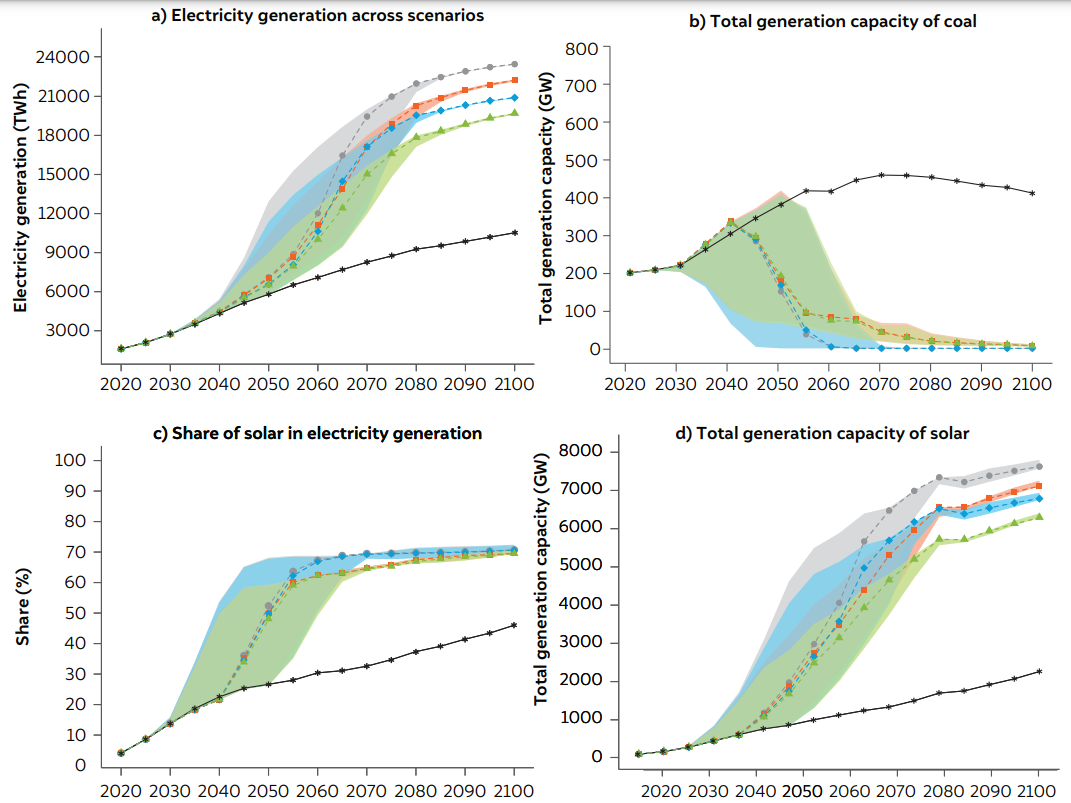
The growth in income and urbanisation implies that India’s electricity consumption is expected to increase significantly in the next few decades, with overall electricity generation scheduled to increase from 1,333 TeraWattHours (TWh) in 2015 to 5758 TWh in 2050 and 10,480 TWh in 2100 (Fig. 1a). The significant jump in electricity generation reflects increasing household income and urbanisation, as well as a growth in the manufacturing base of the economy and electrification of passenger vehicles. This implies that per capita electricity consumption would increase from more than 1,100 kWh per capita in 2015 to 3,512 kWh per capita in 2050. Accordingly, by 2050, the policy objective of achieving adequate electricity consumption by households would largely be met.
A rapid increase in the share of solar energy in India’s electricity generation mix would be a key component in meeting the increasing electricity demand. The share of solar energy in the generation mix would increase from being negligible in 2015 to 26 per cent in 2050 and 46 per cent in 2100 (Fig. 1c). However, this massive increase in the share of solar energy does not imply that the share of coal-based electricity would become negligible. Coal’s share in India’s electricity generation mix would nevertheless reach 50 per cent in 2050 and 30 per cent in 2100. Specifically, without a dedicated climate policy, reducing coal power generation significantly would be a challenge, even though solar power is expected to become more competitive in the future. In the Ref sc, wind and nuclear energy would grow in terms of their installed capacity, although their share in India’s generation mix would remain low.
The industrial sector would account for the largest share of India’s final energy use at 54.6 per cent by 2050. This is commensurate with the country’s plans to increase manufacturing capacity. Our results implicitly assume a small increase in the share of manufacturing in India’s GDP by 2050. If this increases further, in line with much more ambitious manufacturing targets of India (20 per cent share in GDP by 2025), it would imply a much faster pace of growth in manufacturing energy use. The transport and building sectors would account for an almost equal share of India’s final energy use by 2050, around 22 per cent and 19 per cent respectively. Beyond this, the transport sector’s share in final energy would grow much faster than any other sector and would account for 31 per cent of India’s energy demand by the end of the century. This reflects a growth in business and leisure travel demand associated with high income, as witnessed by developed countries. From a wider perspective, however, the industrial sector would continue to dominate long-term energy demand, even after significant efficiency improvements.
India’s current final energy mix (excluding biomass) is dominated by refined liquids (oil products) that account for nearly 45 per cent of India’s final energy mix in 2015, while electricity and coal account for approximately one-fourth each. This would change rapidly in favor of electricity. Rapid electrification and income-induced usage would increase the share of electricity to 31 per cent by 2050. In the long term, the final energy mix is expected to be dominated by electricity, followed by refined liquid fuels and natural gas in that order. The share of coal could reduce to 11 per cent in final energy use (excluding biomass) by the end of the century. Gas use would become much higher compared to coal due to its high penetration in the household and transport sectors in the long run. In the total final energy mix (including biomass), biomass currently holds nearly one-fifth share which declines to approximately 3 per cent by the end of the century.
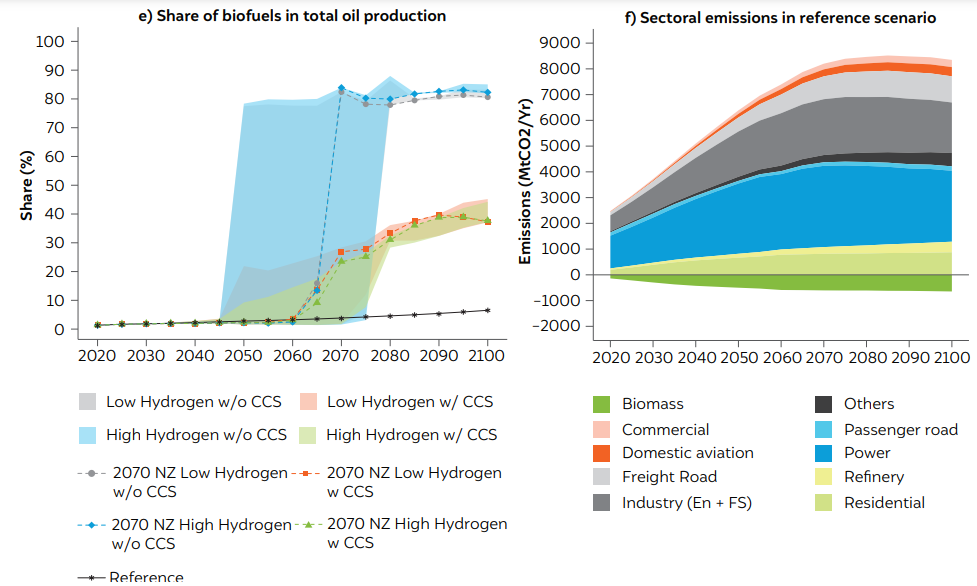
According to our Ref sc, India’s emissions are expected to continue to increase by 2075 (Fig. 2f) when they would peak (refer to Annexure 2 of the supplementary material for emissions by sectors across all scenarios). Beyond this year, a combination of lower economic growth and a competitive set of low-carbon technologies imply that India’s emissions will decline. In the absence of an appropriate climate policy, the cumulative emissions between 2020 and 2100 would be equal to 452 GtCO2.
Scenario with no breakthrough in CCS and hydrogen technologies
Although both CCS and hydrogen are promising technologies, with significant investments made on their R&D, the future seems uncertain for both these critical technologies. While these two technologies have the potential to become game changers if some breakthroughs occur, policymakers have to consider scenarios in which these technologies are not commercially available. What would be the state of a net-zero future and sectoral transformation if these key breakthrough technologies are not available? This section explores this aspect.
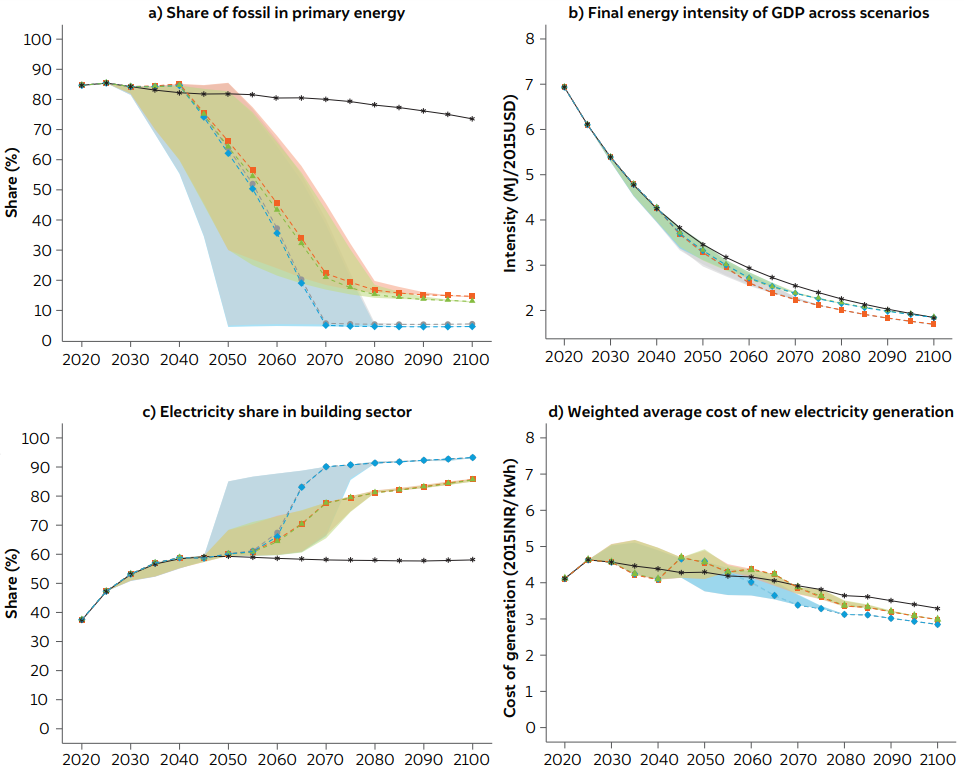
Some interesting insights emerge from exploring this set of scenarios. The first relates to the necessity of a rapid decline in the share of fossil energy in India’s primary energy mix (excluding biomass). In the Ref sc, the share was 96 per cent in 2015 (IEA 2015) and 88 per cent in 2050. Under any net-zero sc without CCS availability, the share of fossil sources has to decline to approximately 5-6 per cent of the primary energy share in the net-zero year (Fig. 2a). Currently, the primary energy mix (excluding biomass) is dominated by coal (59 per cent in 2020), followed by oil (30 per cent) and natural gas (7 per cent). However, in net-zero sc, coal has to be ultimately phased out (reaching nearly 0 per cent share in primary energy) of the Indian economy in the net-zero year. However, this is not the case with gas and oil. The share significantly declines to 2-3 per cent for oil in the net-zero year, whereas the share of gas first increases up to the peaking year before declining to 2–4 per cent in the net-zero year in the respective scenarios. The required pace of transition in the primary energy mix is determined by the choice of the net-zero year. The earlier the net-zero year, the faster the required pace of transition.
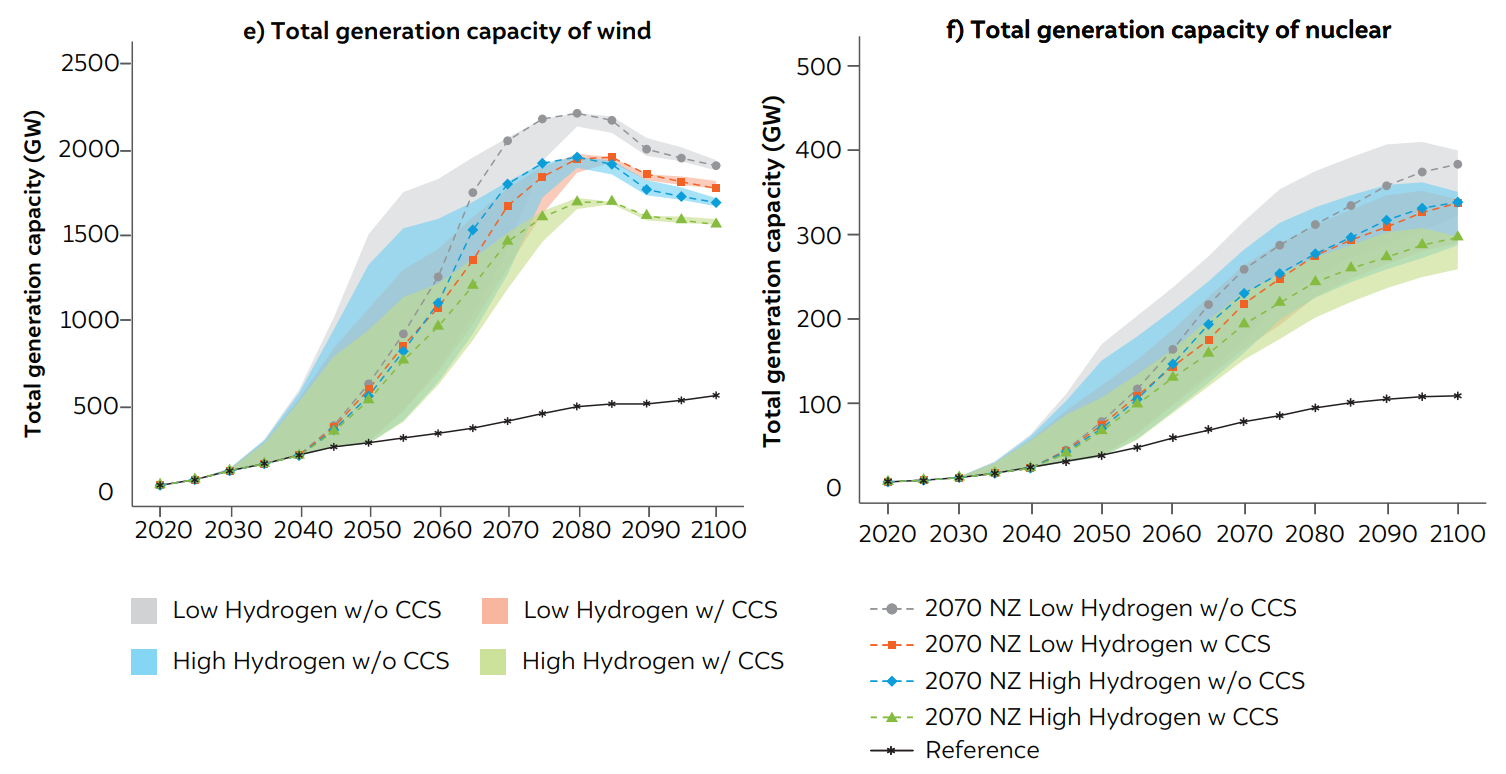
Figure 1 Pathways for electricity generation sector under net-zero scenarios
Source: Authors' analysis
The second key insight from our analysis of alternative net-zero policy futures is a rapid increase in electricity generation (Fig. 1a). India’s total electricity generation increased expeditiously, even in Ref. sc, following an increase in income and urbanisation. Under any net-zero scenario, however, the increase is even faster. Electricity generation is expected to accelerate to 12,896 TWh in 2050 in 2030_2050_NoCCS_LowH2 sc and 23400 TWh in 2100 across the four net-zero policy scenarios without CCS and hydrogen. This translates to a more than two-fold increase relative to the Ref sc in 2050 and 2100 in the most stringent net-zero sc.
The third key insight relates to the massive penetration of solar energy into the electricity supply system. Of all the zero-carbon technologies, solar energy has become more economically viable compared to competing zero-carbon technologies for electricity generation. In addition, this technology has a significant potential in the country. In the absence of CCS technology, meeting the policy objectives of the net-zero scenario is possible only through a significant ramp-up of solar-based electricity generation given that potential generation through alternatives such as nuclear and wind is limited. Of the total electricity generation in the no-CCS and low-hydrogen scenarios, the share of solar power in India’s electricity generation is expected to range from 27–68 per cent in 2050 across the alternative net-zero scenarios (Fig. 1c). This is estimated to increase to 70–72 per cent across all scenarios without CCS and hydrogen by 2100. This is after including the cost of integrating solar energy into the grid. In terms of installed capacity, this implies 816–4,558 GW in 2050 and 7,515–7,740 GW in 2100 (Fig. 1d). The large variation in 2050 reflects the implication of alternative timelines for net-zero years.
The fourth key insight is related to a high increase in the penetration of wind electricity. Though the penetration of wind electricity in net-zero years would vary from one-fifth to one-fourth of solar based electricity generation across policy and technology scenarios, it would still be massive in absolute terms. The requirement for wind powered electricity could increase up to 2200 GW in some scenarios in the long term, implying that technology developments would be needed to harness wind speeds economically at hub heights greater than 120 metres as well as harness offshore wind potential. Both solar and wind need to be together in the grid to harness the complementarities in resource variability geographically and temporally.
In addition to solar and wind-based electricity, the fifth key insight is the criticality of nuclear energy for India’s electricity generation. In the absence of fossil fuels with CCS, there is no other base load zero-carbon technology apart from nuclear energy. Nuclear energy has been very important from the perspective of the country’s energy security and has always been an important pillar of India’s energy policy. However, progress on this technology in terms of its penetration into thegrid has always lagged. Under net-zero scenarios, however, nuclear-based electricity generation would receive a significant push. If CCS technology for power generation is not commercially available, the share of nuclear energy in India’s electricity generation would increase from 2.8 per cent in 2015 to 5.0–10.4 per cent in 2050 and 10.6–13.2 per cent in 2100 (Fig. 1e). In terms of installed capacity, this implies that to meet the objectives of a net-zero India, nuclear-based capacity would have to range from 37–167 GW in 2050 and 316-392 GW in 2100, if CCS technology is not available (Fig. 1f).
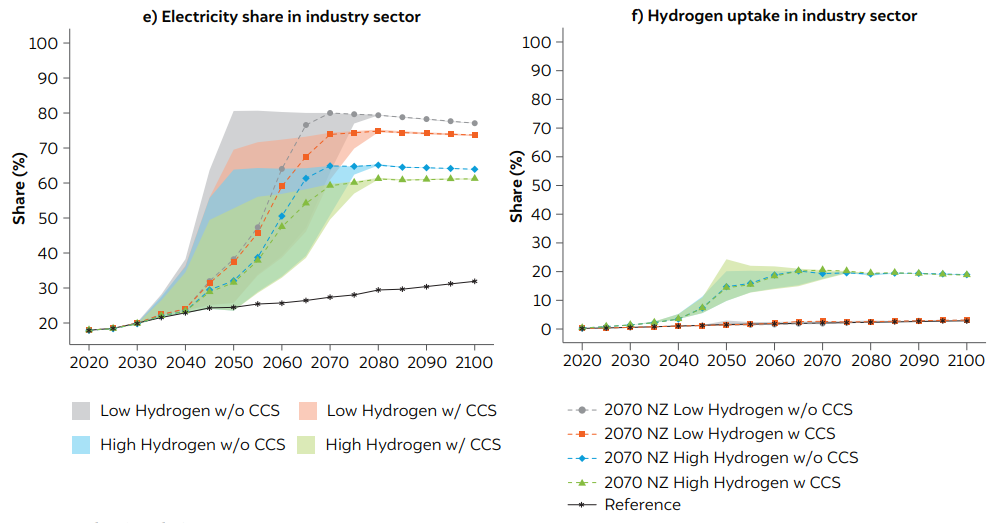
This rapid increase in electricity generation is driven mainly by the electrification of the industrial sector, which is the sixth key insight. While the share of electricity increases by a few percentage points in the Ref sc as well, it has to increase expeditiously to achieve the net-zero goal. In the absence of CCS and hydrogen, electricity has to meet more than 80 per cent of industrial energy demand in the net-zero year, irrespective of the timeline (Fig. 3e). The building sector (including residential and commercial) already has a high share of electrification in the future, even in the absence of climate policy scenarios. With higher income and induced appliance use, the share of electricity in building energy use is expected to increase to 59 per cent in 2050 and beyond under the Ref sc (Fig. 2c).
Beyond electricity, LPG or natural gas for cooking accounts for most of the residual residential and commercial energy consumption. Under net-zero scenarios, however, a significant share of cooking energy needs would have to be shifted to electricity in the absence of any other low-carbon fuel, such as hydrogen, which can be safely used in households and commercial establishments. Net-zero, therefore, also implies a significant shift in the culture of Indian cooking, which has traditionally been fire-based. There is also rapid electrification in the passenger transport sector. However, the energy efficiency of electricity-powered vehicles is extremely high; hence, lower electrical energy is consumed compared to oil for delivering the same level of passenger service. Overall, India’s industrial sector is the defining force for increasing the demand for electricity generation under alternative net-zero policy scenarios.
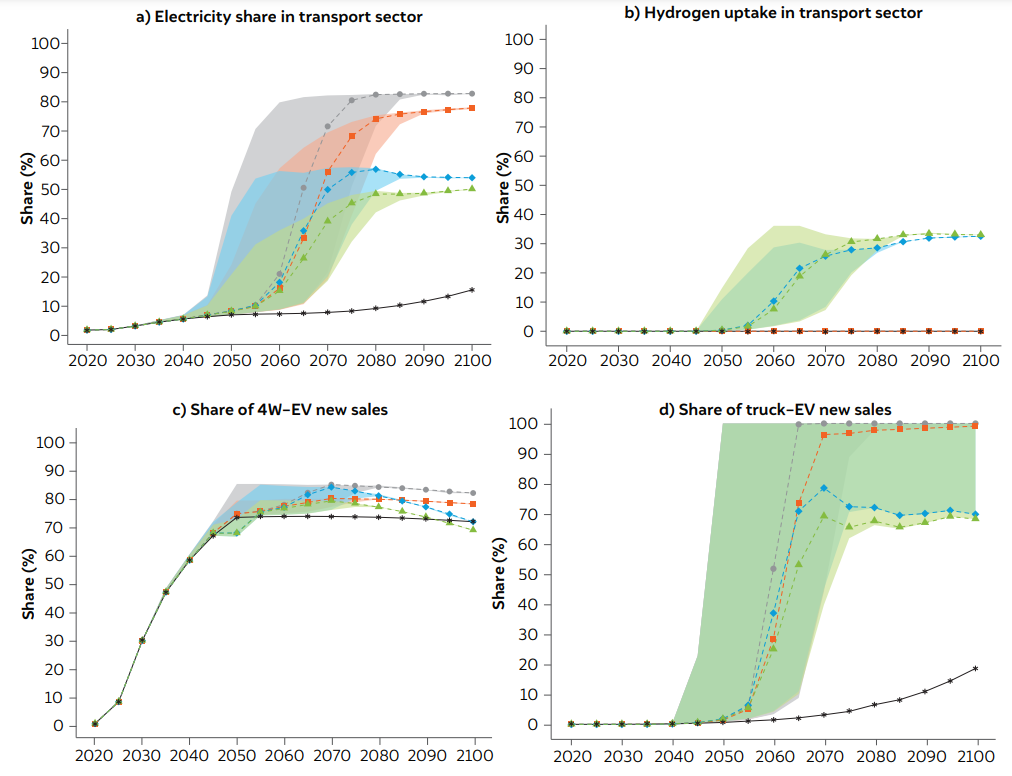
The seventh key insight is the role of low-carbon technologies in the freight sector. The growth of freight demand is closely aligned with the expansion of India’s manufacturing sector. Even a marginal increase in manufacturing share in a rapidly-growing economy implies a significant rate of growth in the freight sector. While the energy demand for meeting freight transportation needs will grow even under the Ref sc, the sources of the final energy mix would have to change rapidly to meet net-zero targets. Our analysis shows that in the absence of a breakthrough in hydrogen production and end-use technologies, such as fuel cells, the share of electric trucks would have to increase rapidly to decarbonise this sector. The share of e-trucks in truck sales would increase to 100 per cent in the net-zero year across scenarios (Fig. 2d).
The eighth key insight relates to the role of liquid fuels, especially biofuels, in India’s net-zero future. The absence of CCS restricts the potential for biofuel usage in the electricity generation sector. Biofuels are mainly used in the form of liquids. While the use of liquid fuels in absolute terms increases in India’s final energy mix in the future, it is nevertheless lower than when compared to the Ref sc in terms of its share in final energy. The share of refined liquid fuels (including their derivatives such as LPG) in final energy usage (excluding biomass) is expected to decrease from 45 per cent in 2015 to 16–31 per cent in 2050 and to around 12 per cent by 2100, under net-zero scenarios without CCS and hydrogen. Within this range, the share of biofuels in netzero scenarios is 1.6–77 per cent in 2050 and 80–83 per cent in 2100 (Fig. 2e). However, such high levels of biofuels are not necessarily produced in India. In a netzero world, liquid biofuels would become a commodity like oil in the current times, and water-rich countries such as Latin American economies, while South Asian economies would become significant exporters of biofuels under a global net-zero future. Biofuel’s share in primary energy consumption is expected to remain around 15 per cent in the net-zero year and beyond across scenarios.
Figure 1 Pathways for electricity generation sector under net-zero scenarios
Source: Authors' analysis
The ninth key insight relates to the rapid decline in the final energy intensity (FEI) of GDP by 49–57 per cent between 2020 and 2050, and by 73–76 per cent between 2020 and 2100 across all net-zero scenarios without CCS and hydrogen availability (Fig. 2b). This decline in FEI of GDP reflects a combination of three key factors — improvements in the technical efficiency of end-us technologies (e.g. improvements in AC efficiency), shift in technologies that have a lower energy footprint than earlier technologies (e.g. electric cars as compared to petrol cars), and some reduction in energy service demand itself.
Finally, the cost of the new vintage of electricity generation declines on an average in the long term, but we would see a sharp increase in the path to the net-zero years (Fig. 2d). The increase can be attributed to the high implicit value put on carbon to incentivise a transition towards a net-zero future, which in consequence promotes the penetration of solar energy significantly. In the near-term, the electricity generation mix holds a considerable share of fossils which is reflected in the increased cost of electricity generation induced by the price of carbon in the economy. However, in the long term, the electricity generation mix is expected to be heavily dominated by solar power, which could become the most competitive technology of all potential choices, thus driving down the average cost of electricity generation below the reference level. For solar electricity, the carbon price is immaterial, as it is a zero-carbon source. Therefore, as soon as fossil energy is priced out of the system, the average electricity generation cost declines. However, this does not account for the stranded asset-related costs as the fossil electricity plants would not be used for their technical lifetime in net-zero scenarios. The pace of increase in average generation cost is lower in scenarios where CCS is available, as it opens up the possibility of persistence of fossils in India’s energy system. Once the low-carbon power generation infrastructure is set up, new electricity vintage gains from this and faces a lower carbon price along with an even lower cost of renewable energy.
Scenario with breakthrough in CCS and hydrogen technologies
There are some interesting insights if CCS and hydrogen technologies become commercially available.
First, while there is higher electricity generation across all net-zero scenarios compared to the Ref sc, there are significant differences in electricity generation among these as well, mainly differentiated by the commercial availability of the two breakthrough technologies. By the end of the century, electricity generation in the 2070 net-zero scenario in which both technologies are not available commercially is expected to be 19.3 per cent higher than the 2070 net-zero scenario in which both CCS and hydrogen are commercially available (Fig. 1a).
Second, the first insight can be mainly attributed to the various channels through which hydrogen and CCS availability operate and impact energy systems. When hydrogen is commercially available, the share of electricity use in the industrial and transport sectors declines (Fig. 3a and 3e). The decline in electricity consumption in the transport sector, mainly in the freight truck segment, is far greater than that in the industrial sector. Therefore, hydrogen availability changes the final energy mix away from electricity towards hydrogen in the industrial and transport sectors. Meanwhile, CCS availability opens up the possibility of liquid biofuel production with CCS, as well as gas and coal with CCS in the electricity generation sector, and hence a higher share of fossil in primary energy use. Our results make it clear that hydrogen, while critical, is no silver bullet for the net-zero challenge.
Third, we do not see a great deal of bio-CCS coming in the power generation mix, even in scenarios in which CCS is available. This is because bio-CCS is much costlier than coal-CCS for power generation. Even a high carbon price does not make it attractive enough for the power system as solar power becomes very competitive and addresses the emission mitigation challenge of the power sector. Most of the biomass-related negative emissions (Annexure 2, online supplementary material) are related to the use of biomass in liquid fuels.
Fourth, the commercial availability of CCS leads to a significant change in solar-based electricity generation. For instance, in the 2070 net-zero sc, the availability of CCS reduces solar-based installed capacity by 18 per cent in the net-zero year, that is, 2070 (Fig. 1d). This cannot be attributed to the higher penetration of CCS in the power generation sector, as it has a marginal effect owing its high comparative cost. This is because CCS availability leads to a higher share of liquid fuels in the end-use sectors (transport and industry), leading to lower demand for electricity, and hence lower installed capacity of solar power plants.
Fifth, CCS allows a significant increase in the consumption of crude oil in the economy (as compared to no-CCS net-zero scenarios), as it helps to capture carbon from the biofuel refining process. In the 2070 net-zero policy scenarios, refined liquid use in the economy in the net-zero year is expected to be higher by 24.5 per cent when CCS is available, but hydrogen is not, as compared to when both technologies are unavailable. In contrast, when hydrogen is available but CCS is not, the refined liquid use is actually lower by 5 per cent compared to when both technologiesare unavailable. CCS availability with biofuels leads to negative emissions which could balance the higher use of crude and related emissions in the economy, particularly in the transport sector. This implies that, counterintuitively, the use of biofuels in the Indian economy reduces significantly with the availability of CCS, and that most biofuels that are converted to liquid fuels in the refinery sector are based on CCS technology.
Sixth, these results imply that the availability of CCS provides a significant respite for investors in fossilaligned sectors and technologies. The average share of fossil energy in India’s primary energy mix when CCS is not available is 5.5 per cent in the net zero year, irrespective of the policy scenario, a drastic reduction from 96 per cent (excluding biomass) in 2015. However, when CCS is available, the fossil energy share in primaryenergy in the net-zero-year ranges from 19 per cent to 30 per cent which continues to decline to reach a share of 13–15 per cent in 2100 across the 16 net-zero scenarios (Fig. 2a). In the primary energy mix, the share of coal in the long run has to decline significantly in cases with and without CCS. However, with CCS being commercially available, coal does not need to be fully phased out and can account for a 3–5 per cent share in the primary energy mix in the net-zero year, except for the 2050 net-zero scenario, where the share is likely to be around 7 per cent in 2050 (due to persistence of capital stocks), but ultimately declines to levels similar to those (1-1.5 per cent) in all other net-zero scenarios by 2100. The share of oil also declines in net-zero decarbonisation pathways, but the share in net-zero year if CCS is available is relatively higher compared to without CCS sc and could range from 6 per cent to 14 per cent depending on the time path of net-zero year, reaching 6 per cent by the end of century across scenarios. In the case of gas, the share ranges from 8-9 per cent in the primary energy mix in the net-zero year, declining to 7 per cent by 2100 across scenarios.
Finally, the pace of transition across sectors is critically impacted by the combination of policy choices (peaking and net-zero-year targets) and the availability of CCSand hydrogen technologies. In the charts (Fig. 1 to 3), the upper range corresponds to the 2030 peak–2050 net-zero scenarios, and the lower end of the range represents the 2050 peak–2080 net-zero scenarios for variables that would be positively impacted by a transition towards a net-zero future, e.g. solar electricity (converse is true for variables that would be negatively impacted by this transition, e.g. share of fossil energy). The rapid increase in the upper end of the range for any variable of interest from 2030 onwards (e.g. see solar electricity capacity chart Fig. 1d) shows the growth in the variable as required from 2030 (peaking year) and stabilisation after 2050 (net-zero year) to achieve the most ambitious scenario. Similarly, the rapid increase in the lower end of the range from 2050 onwards shows a growth in the value of this variable as required from 2050 (peaking year) and stabilisation after 2080 (the net-zero year). The broad ranges for all the key variables of interest show the impact of alternative net-zero year targets as well as that of availability of CCS and hydrogen.
Figure 3 Pathways for transport and industrial sector under net-zero scenarios
Source: Authors' analysis
The pace of transition towards a net-zero future for India would be determined by the policy choice of a peaking and net-zero year. An earlier peaking and net-zero year indicates a much faster transition than a later year. While the timelines for key sectoral steps would be different across policy scenarios, we presentthese for the 2070 Net-Zero (NZ) scenario2 . We present the key steps as an illustration of what it would mean for India to peak in 2040 and achieve net-zero five decades from today, if CCS is unavailable but hydrogen is available commercially. The presented targets are the bare minimum requirement to remain in the 2070 NZ pathway. The following sectoral targets would need to be met in such a scenario:
One of the key contributions of this working paper is the analysis of alternative breakthrough technologies for India’s net-zero future. While the commercial availability of both CCS and hydrogen is expected to have important implications across sectors, the larger character of transition towards a net-zero future nevertheless remains the same. Electricity use and generation would have to be ramped up expeditiously, fossil use in primary energy would have to decline, fuel switching towards zero carbon fuels has to increase expeditiously across demand and supply sectors irrespective of the scenario. Apart from the electricity sector, CCS availability has important implications for the refinery sector, where negative emissions can be achieved through bio-CCS which allows slower phasing out of crude oil use in the economy. In the power generation sector, some CCS can be used as base load, but since it would increase the cost of power generation, it is less competitive compared to solar electricity even after including the integration cost associated with solar-based electricity. The commercial availability of hydrogen would lead to its usage in the industrial sector, particularly the hard-to-abate sectors such as steel making and the truck segment, while its technical superiority for long haul trucks would make it a preferred choice for this segment.
Coal is the most important energy resource that needs to be managed in India. Coal peaking in the electricity generation sector is closely aligned with the policy choice of peaking emissions. For example, if the peaking year is chosen as 2030, electricity sector coal use has to peak by 2030. Meanwhile, if the peaking year is chosen as 2050, coal use for electricity generation could increase till 2050, after which it has to decline. The same holds true for industrial coal use, which has a peak and decline in alignment with the peaking year chosen by policymakers. This strategy is different from crude oil or natural gas use in the economy, as the useof both these fuels in the economy can nevertheless increase even 10 years after the peaking year, while coal use has to necessarily decline. The bulk of coal use in India is in the power generation sector, which accounts for almost 90 per cent of India’s coal use. If coal use peaks in this sector, it by and large implies that India’s coal usage has peaked because even if industrial coal use continues to grow, it would never be as high as the electricity sector’s coal use, given that industrial energy use is expected to be more diversified with a higher penetration of gas in industrial energy use.
The role of distributed energy is important, and gridconnected distributed electricity can play an important role in this regard. While the Government of India has emphasised the role of rooftop solar and other gridconnected distributed sources of electricity, this sector has not witnessed rapid growth, in contrast to what has been observed in grid-connected large solar power plants. While our analysis does not explicitly model the role of rooftop solar, distributed sources of solar electricity would nonetheless have to play a critical role in a net-zero future. The installed capacity of solar electricity in the net-zero future would have to be around 7,500 GW. Achieving this high installed capacity implies that all the sources would have to be tapped. As solar electricity could have a massive land footprint, every available piece of land would be required to be judiciously used. India’s vast rooftop space would play an important role in achieving a significant penetration of solar electricity for a net-zero India.
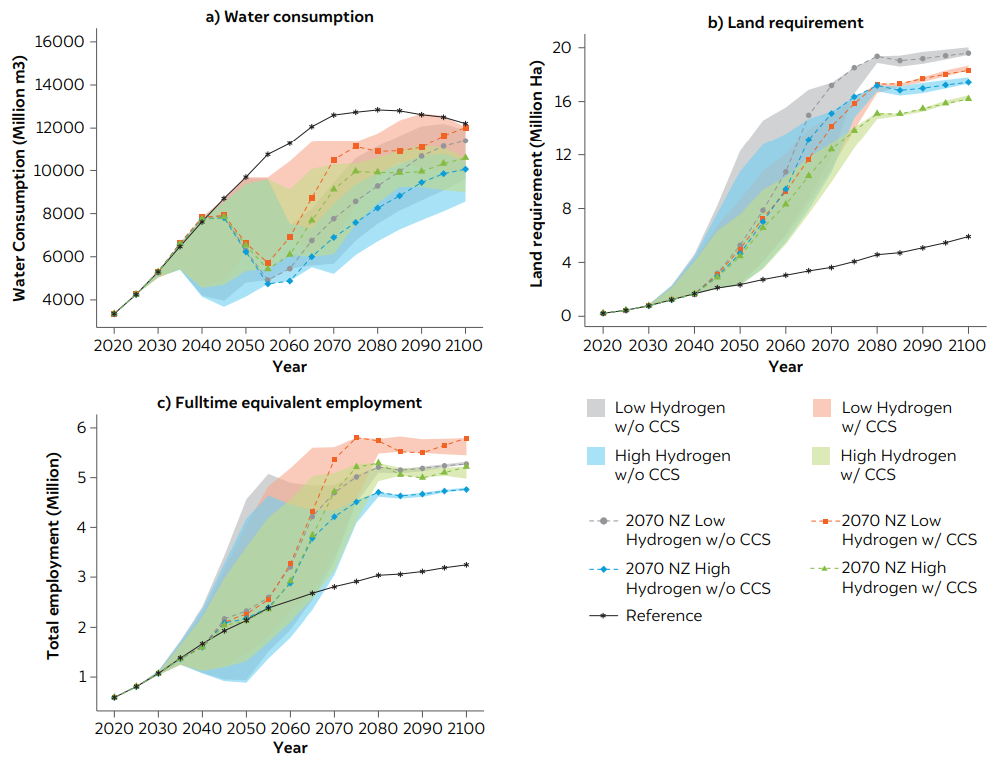
A high installed capacity of solar energy has important implications for land, water, and solar waste. A higher penetration of solar electricity not only implies lower water consumption (Fig. 5a) given the reduced water 3 The jobs estimation is for the power sector, and includes job losses across the coal value chain including mining as well as job creation potential in the solar value chain. However, this excludes the job creation potential in the non-power sectors, e.g. hydrogen. Estimating the job potential in the hydrogen value chain is not possible at this stage due to lack of information about this sector. coefficient of solar electricity in India (Chaturvedi et al. 2020), but also a high land footprint (Fig. 5b). Land requirement for India’s power generation assets could be as high as 3.74 per cent in 2050 under a 2050 netzero scenario, increasing to 4.92 – 6.09 per cent of India’s total land mass across all scenarios in 2100. Innovative approaches such as colocation strategies (Ravi et al., 2016) would have to be harnessed to minimise the land demand under a net-zero future, as land could emerge as a major constraint. A key concern that could emerge in the future is solar panel waste. The life of a solar panel on average is 8–10 years, after which it has to be discarded. The waste that would be generated from 7,500 GW of installed solar capacity is expected to be massive. This would also present an opportunity for the recycling industry to retrieve critical minerals and other metals from solar waste and achieve economies of scale in such a scenario.
The transition towards a net-zero future must adhere to the principles of transition. While the overall full-time equivalent jobs in the power sector would increase (Fig. 4c)3, there could be coal-dependent jobs that could be lost in the near term. No low wage-earning family should be negatively impacted in the transition, and no low-income household should be negatively impacted due to rising energy prices, as electricity prices are expected to increase in the path towards a net-zero future (Fig. 1d). This is absolutely critical for developing economies. A structured and time-bound plan has to be made to ensure that the transition towards a net-zero future is fair for Indians. In addition to transitions, there are many interesting aspects related to the political economy that must be anticipated and responded to in a strategic way. These include, among others, loss of fiscal resources for fossil-dependent states, loss of revenue for Indian Railways that earns a significant part of revenues from coal hauling, and elimination of cross subsidies in India’s electricity pricing structure, implying higher electricity charges for households and lower electricity charges for the industrial sector to incentivise electrification of industrial energy use. Dealing with entrenched interest groups and labour unions is expected to be a major political economy challenge that Indian policymakers would need to face for a net-zero transition.
Figure 5 Water consumption, land requirements, and jobs in the power sector
Source: Authors' analysis
Energy use across sectors becomes more efficient with time, even under the Ref sc. As highlighted earlier, the energy intensity of services across sectors must decline at a faster pace to achieve the transition to a net-zero future. It is imperative that there is a shift towards more efficient technologies across end-use sectors in netzero scenarios. Along with more efficient technologies, behaviour-change-induced demand reduction is also crucial. This could include interventions such as using a higher thermostat set point while running air conditioners or car-pooling. While we do not explicitly model behaviour change in our research, it would play a critical role in the net-zero future for India.
While this study presents the nature, pace, and magnitude of energy sector transition that would be required for alternative peaking and net-zero-year targets, there are other important considerations that would impact both the choice of the policy target, as well as the ease or difficulty in achieving it. Collectively, these would determine the feasibility of achieving the policy target and determine whether the chosen net zero year would be 2050, 2070, or later. Some of the key elements that would determine the feasibility of the transition and acceptance of a net-zero target year are: (i) per capita income that provides an indication of financial resources available to support the transition and communicates the state of development of an economy. Countries with higher per capita income would find it comparatively easier to accelerate the transition; (ii) the economic growth rate of a country has significant implications, since it implies that emissions are on an upward trajectory and hence have to be peaked and then reduced to move towards a net zero future. Mature economies that are already on a stable and lower economic growth path with declining emissions trajectory would find it comparatively easier to accelerate the transition to a net-zero future; (iii) availability and cost of mitigation technology suite is important to ensure that the transition cost is minimised. If the integration of solar energy in the grid and ensuring grid reliability makes solar-based electricity costlier, it would have a bearing on the pace of transition; (iv) the gap between the peaking and net-zero years is important as systemic transitions take time because of inertia and significant transaction costs involved in coordination between numerous moving parts of the system. A transition from peaking to netzero in 20 years for a growing economy might be much more challenging than a transition with a higher gap of probably 30 years, as it gives reasonable time for decision makers and systems to adjust ; (v) political economy aspects, for example, acceptance of deep structural reforms by labour unions and consumer representative groups, the position of various interest groups, would play an important role in the choice of a net-zero year target as well as the progress towards it; (vi) the presence of physical constraints such as land and water availability, and social constraints in the form of public acceptance or resistance to technologies like nuclear, hydro and even solar in case of negative impacts on fauna, would be critical. India is a waterscarce country, and there is an increasing demand for land availability. Any sectoral transition pathway needs to ensure that physical and social constraints do not limit the progress towards a net-zero target; (vii) low-cost finance, particularly for solar, is a major non-market impediment that needs to be addressed if the extent of solar deployment needed in a net-zero scenario is to be achieved; (viii) global climate politics, particularly clear and measurable demonstration of financial and technical support by developed countries as well as ambitious near-term actions, would have an important bearing on how early (and if) India announces a net-zero year target and at how close or far it would be.
The net-zero debate has found many takers across the globe, with many countries announcing their intent to take their economies towards an ambitious net-zero goal in the next few decades. While all the key emitters have announced net-zero targets, India is still in the process of exploring the implications of a net-zero future. To the best of our knowledge, there has been no Indiaspecific study that analysed sectoral strategies related to alternative net-zero targets for the country. Our study addresses this gap by laying out four alternative net zero policy choices ranging from the most ambitious (2030 peaking – 2050 net-zero sc) to the least ambitious (2050 peaking – 2080 net-zero). The analysis focuses on carbon dioxide emissions from India’s energy sector, which forms the bulk of total GHG emissions. Within each of the peaking and net-zero-year policy scenarios, we analyse four that reflect the commercial availability, or lack of it, of CCS and hydrogen technologies.
Undoubtedly, we find that the pace of transition towards a net-zero future for India would be significantly faster in the most ambitious scenario. We find that the availability of CCS allows for a much longer presence of fossil sources in India’s primary energy mix, although even in this case, the decline in fossil energy has to be drastic. The commercial availability of hydrogen technology reduces the near-complete dependence of the industrial and transport sectors on electrification under net-zero scenarios. Competitive and technologically mature hydrogen implies that the long haul truck segment and some important processes in the hard-to-abate sectors can rely on this fuel, reducing dependence on electricity. Our results make it clear that hydrogen, while critical, is no silver bullet for the net zero challenge.
Irrespective of the policy scenario, it is evident that the need for electrification of end-use sectors would lead to a massive increase in electricity generation, much higher than that in the Ref sc, and that most of this electricity would be powered by solar energy. Nuclear energy would also have to play a key role in electricity generation, as it is the only zero-carbon electricity source that can provide baseload electricity if there is no possibility of coal usage with CCS. Ultimately, the feasibility of structural changes needed for a net-zero future must be examined in detail.
Our modelling approach mainly represents the implications of economic choices, which are a critical factor in shaping the future. Along with economics, however, there are other elements that are equally important and need to be considered while arriving at a decision. While we have discussed many issues related to the political economy of transition, issues related to just transition, as well as constraints related to land and water, are beyond the scope of our analytical framework. This can be regarded as a limitation of our approach. Any final choice must consider such aspects as well.
The choice and progress towards a net-zero future implies deep structural economic transformations. The approach of harnessing opportunities as and when they present themselves would not suffice. Neither would co-benefits as a central theme. The framing needs to go beyond co-benefits towards a broader macroeconomic framing that shapes and creates opportunities rather than waiting for them to materialise. It is reasonable to expect that there will be economic losses if the mitigation technology suite is costlier than the technologies currently in use. However, sectoral strategies can focus on sectors where cost effective options are available and start creating institutional strategies and economic incentives to accelerate the pace of their deployment. Understanding of economic costs is critical not to avoid or delay deep decarbonisation, but to deploy smart strategies to minimise the cost and create an economy of the future in the process.
Net zero implies the bull is taken by the horn. Planning without realising the size of the bull and the speed at which it is charging, however, is imprudent. Our research seeks to shed light on the magnitude of challenge and the pace of transition required across sectors by analysing alternative formulations of peaking and net-zero policy and breakthrough technology availability. We hope that this will create a better understanding of the net-zero debate in India and motivate stakeholders to have an informed debate on this issue.
Tamil Nadu’s Greenhouse Gas Inventory and Pathways for Net-Zero Transition
The Emissions Divide: Inequity Across Countries and Income Classes

Implications of an Emissions Trading Scheme for India’s Net-zero Strategy

Demystifying Carbon Emission Trading System through Simulation Workshops in India