Council on Energy, Environment and Water Integrated | International | Independent
Suggested Citation: Soman, Abhinav, Harsimran Kaur, Himani Jain, and Karthik Ganesan. 2020. India’s Electric Vehicle Transition: Can Electric Mobility Support India’s Sustainable Economic Recovery Post COVID-19? New Delhi: Council on Energy, Environment and Water.
This report, supported by Shakti Sustainable Energy Foundation, explores the impact of India’s electric vehicle transition on India’s economic recovery. It examines the impact of a 30 per cent EV sales share in 2030 on domestic value-addition, jobs, crude oil imports, revenue generated from taxes, local pollution and greenhouse gas (GHG) emissions. In addition, the study quantifies these impacts in different mode-share scenarios - (i) high public transport scenario, (ii) high private vehicle scenario, and (iii) shared mobility scenario.
A 30% EV transition in 2030 will result in a slew of gains as well as trade-offs, the impacts of which can be staved off through prescient planning
Source: Authors' Analysis
Among the avenues for economic recovery and sustained growth after the COVID-19 pandemic dies down, paving the path with a transition to electric vehicles (EV) has immense potential for investment and rapid market growth. The 30 per cent EV transition in 2030 is likely to have a wide-ranging impact on the economy and we focus specifically on changes in oil import, value-addition, employment, impact on public finances, market size for EV components, and environmental gains from reduced local air pollutants and greenhouse gas (GHG) emissions.
We attempt at unpacking these issues by projecting the vehicle stock in 2030 in business-asusual (BAU) and a scenario with 30 per cent EV penetration. In addition, we explore three different mobility paradigms – (i) high public transport, (ii) high private vehicle and (iii) high shared mobility to gauge the range of impact of mode-share coupled with 30 per cent EV sales in 2030 on the industry, economy and environment. Our key findings and recommendations are summarised as follows.
By our estimates, we project the vehicle stock (passenger + freight) to increase by nearly 2.7 times between the base year 2016 and the projected year 2030. We explored the consequences of 30 per cent EV sales (35 per cent in e-two-wheelers [e-2Ws] and e-three-wheelers [e-3Ws]; 30 per cent in electric buses [e-buses]; 25 per cent in electric taxis [e-taxis]; and 13 per cent in electric cars [e-cars]) in in contrast to a business-as-usual (BAU) scenario.
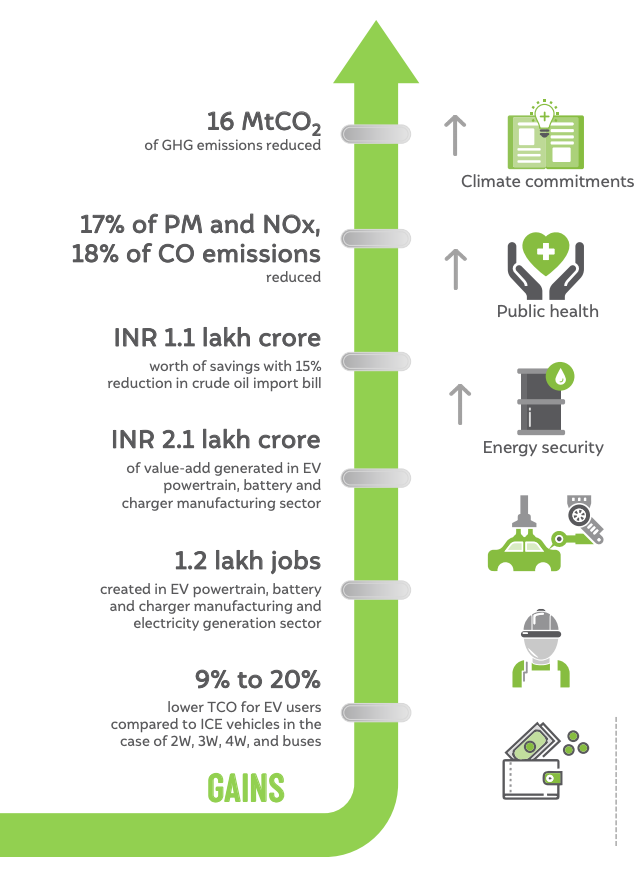
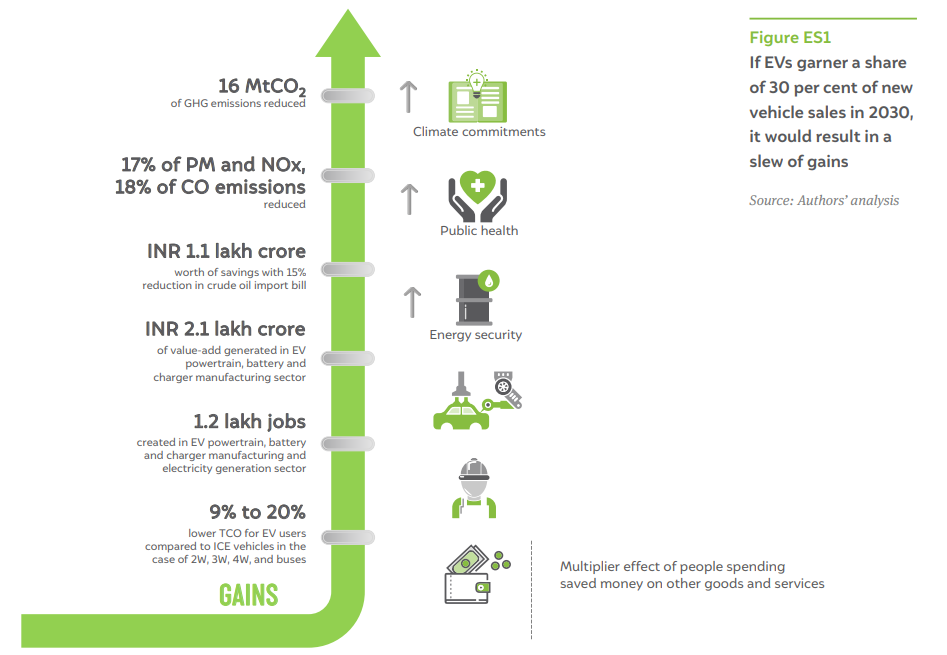
Figure ES1: If EVs garner a share of 30 per cent of new vehicles sales in 2030, it would result in a slew of gains
Source: Author's Analysis
In contrast to a BAU, the gains from 30 per cent electric vehicle (EV) sales in 2030 are hard to miss. With the reduction in oil demand from the passenger road transport sector, India will save on crude oil imports worth INR 1,07,566 crore (USD 14.1 billion). Further, a 17 per cent decrease in particulate matter and NOx emissions, 18 per cent reduction in CO emissions, and 4 per cent reduction in GHG emissions relative to BAU can be expected. In addition to aligning with India’s goals to reduce its oil imports and strengthening its forex reserves, the EV ecosystem presents a market size of INR 2,12,456 crore (USD 27.8 billion) for batteries, powertrains, and charging infrastructure in 2030. Under the right policy environment, supply-chain for EV manufacturing presents an attractive opportunity for future investments providing a much-needed stimulus to the economy. However, any major technological transition is fraught with losses and trade-offs. Figure ES2 highlights some of the major tradeoffs from an EV transition.
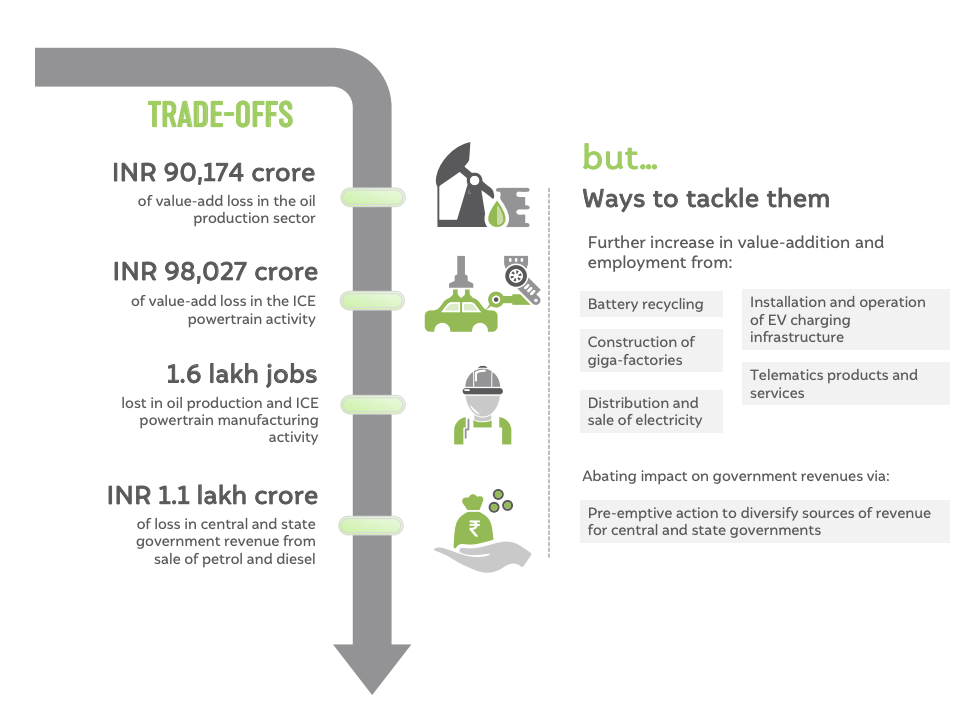
Figure ES2 EV transition includes trade-offs, the impacts of which can be staved off through prescient planning
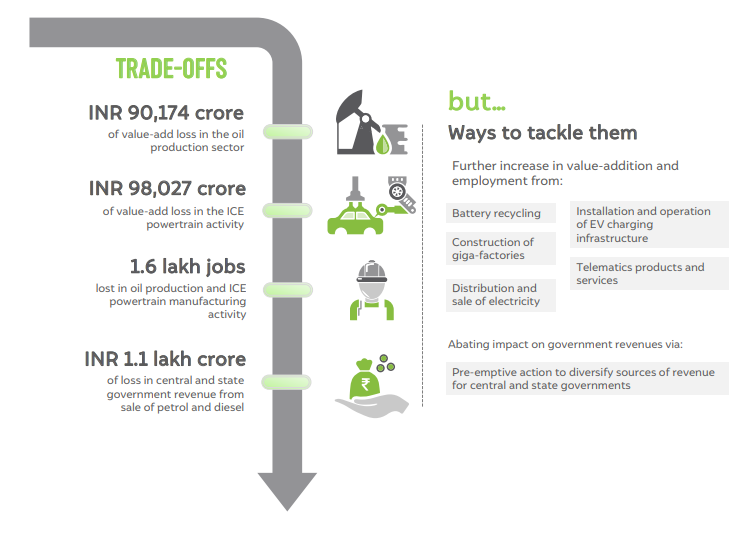
Source: Authors’ analysis
When comparing direct jobs created in manufacturing and energy production activities in the EV sector, we find there are fewer jobs in a scenario with EVs – a reduction of 19 per cent jobs in the oil sector and ICE vehicle manufacturing combined. An EV transition plan must lay equal emphasis on new economic activities such as battery recycling (urban mining) and other services associated with electric mobility, for job creation. The central and state governments must wean away from their dependence on revenues linked to petroleum consumption, in order to limit perverse incentives that sustain policy support for ICE vehicles, and help accelerating EV adoption in India. As is evident form Figure ES1 and ES2, the gains from the transition to electric mobility overshadow potential losses.
Policy interventions and behavioural changes can drive changes in passenger transport mode-share and this in turn can impact energy consumption, air quality, congestion, and road safety. Therefore, we further explored EV penetration under various mobility paradigms. Our projections show that a 30 per cent EV sales in future combined with a higher share of public transport would lead to a 31 per cent reduction in oil imports (worth INR 2,16,043 crore (USD 28.3 billion) relative to a BAU scenario. This would result in a concomitant reduction of 36 per cent in carbon monoxide (CO) emissions, 28 per cent in nitrogen oxide (NOx) emissions, 29 per cent in particulate matter (PM) emissions, and 20 per cent in GHG emissions, in the same scenario. On the flip side, the purported benefits of electrifying passenger transport are overturned in case of high private vehicle ownership, which would lead to an overall increase of 5 per cent in energy consumption compared to the BAU scenario. Therefore, to realise the benefits of an EV transition, policymakers must focus on shaping the evolution of passenger transport mode-share. A majority of trips and passenger travel demand must be met by public transport and non-motorised transport options such as walking and cycling.
In a post-COVID world, India needs to take a series of measures to propel economic growth and sustain it in the long term, focusing also on creating jobs. We turn our gaze to the auto-industry and pitch for a shift in manufacturing from internal combustion engine (ICE) vehicles to electric vehicles (EVs). We analyse the impact of this shift on India’s economic recovery: will it be beneficial or will it be detrimental?
The terrain we traverse to understand the impact of this shift is a two-fold scenario projection encompassing a 10-year horizon:
• Projecting vehicle stock and energy demand for road passenger transport in 2030.
• Mapping and quantifying the impact of the electric mobility transition on various sectors of the Indian economy under different mode-share scenarios. Our key comparative scenario assumes a 30 per cent sales share of EVs in 2030.
We specifically look at the impact of EV transition in terms of opportunities created in the form of reduction in oil import bill, jobs generated, new markets and industries created, improvement in air quality, and reduced greenhouse gas (GHG) emissions. Simultaneously, we foresee a loss in value-addition from some existing industries resulting in reduced jobs in specific activities and also a reduction in government revenues as a result of a drop in the collection of taxes arising from fossil fuel (petrol and diesel) consumption. Any major technology transition is fraught with losses and gains, some of which persist in the short term while others remain over the long term. Our goal in this study is to bring the major considerations to the forefront, for the attention of policymakers and the auto-industry when examining an EV future for India. If the EV sector turns out to be promising for economic recovery, the analysis we present can be used to draw a roadmap that curtails losses and leverages gains from the transition.
Our research is limited to an analysis of motorised road passenger vehicles, battery electric vehicles using lithium-ion battery technology, and conductive point charging unless otherwise specified.
India’s transition to electric mobility is guided by three main imperatives—energy security, curbing local air pollution, and curtailing GHG emissions from the transport sector. A major transition in transportation technology concerns not just the automotive industry in India but also other sectors with which it has forward and backward linkages: petroleum production, electricity generation, electronics manufacturing, and even public finances on account of change in oil import bill and fuel-tax revenue (ILO 2018). So far, there has been no clear policy mandate for EV penetration. But policymakers in India have set a goal of 30 per cent penetration of EV in new sales by 2030 (Clean Energy Ministerial 2017; PIB 2018). The range of impacts associated with increased deployment of EVs on the economy are captured in Figures 1 and 2.
Figure 1 EV transition rings in cumulative benefits on the economy.

Source: Authors’ adaptation from Cambridge Econometrics. 2015. “Fuelling Britain’s Future”
Figure 2 The energy sector is likely to see a paradigm shift due to EV transition.

Source: Authors’ adaptation from Cambridge Econometrics. 2015. “Fuelling Britain’s Future”
For constructing the future EV scenario, we start by projecting the travel demand expected in 2030 and the number of vehicles needed to cater to that demand. Then we factor in the number of EVs that could be part of the vehicle mix. Although the main objective of our study is to estimate the impact of an EV transition on the economy, we also gathered a diversity of views on what the mobility future will look like (shown later in Figure 9). In doing so, we undertook an independent bottom-up assessment of mobility demand in the future and state the assumptions driving this demand. Mobility demand in future years is driven to a large extent by the ‘mobility paradigm’ and how it is being served. Mobility paradigms are characterised by mode-shares, which can influence the energy footprint of the transport sector and have implications on congestion and road safety.
Reliable travel demand projections for India are often limited by the absence of disaggregated demand-side data for the transport sector. This includes data required to estimate passenger kilometres travelled (PKM), freight-tonne kilometres (TKM), and the share of vehicle fuel technology in transport, among others (Paladugula et al. 2018). PKM is typically derived from on-ground surveys to estimate the total distance travelled by various modes and load factors. The Census 2011 captured PKM for worker individuals, which could represent at best 35–42 per cent of passenger travel demand in the country.
Aggregated data throws up a bundle of contradictions. As per data from the Ministry of Statistics and Programme Implementation (MoSPI), the road-transport sector consumed about 31 million tonnes of oil equivalent (Mtoe; 12 per cent) of oil in FY18 out of the 262 Mtoe of oil supplied (domestic production + import) in that year (MoSPI 2019). However, using the fuel supply data of the Ministry of Petroleum and Natural Gas (MoPNG), we estimate the fuel consumption for road transport to be around 84 Mtoe (33 per cent) out of a total of 256 Mtoe supplied (MoPNG 2020; PPAC 2013).2 Here, we assume the MoPNG data to be more reliable since it is derived from actual fuel sales. We also compared road-transport fuel consumption estimates derived from the underlying PKM estimates available from the Ministry of Road Transport and Highways (MoRTH) for FY17 with supply-side data from MoPNG for FY17. Here we find that this estimate is significantly higher (approximately by 60 per cent) than roadtransport fuel consumption estimated based on the MoPNG fuel sales reports.
The total registered vehicles in India stood at 280 million as of 2017 going by the MoRTH statistics (MoRTH 2019). The actual number of on-road vehicles wouldn’t match this figure, as the transport departments in respective states don’t mandate a vehicle de-registration process. The estimates for privately owned on-road vehicles, therefore, tend to be inaccurate. Surveys have revealed that official statistics overestimate the number of in-use vehicles by as much as 120 per cent (Goel et al. 2016). Hence, historical data on vehicle stocks in India have to be discounted for retired vehicles. Out of three union ministries that could make available data for decision-making on the future of road transport, only one—MoPNG—provides reliable information but lacks the disaggregation needed for robust projections.
A total of 5,30,560 EVs (including electric two-wheelers [e-2W], electric three-wheelers [e-3W], electric rickshaws [e-rickshaws], electric cars [e-cars], and electric buses [e-buses]) were sold in India (CEEW - Centre for Energy Finance 2020). This remains far from the National Electric Mobility Mission Plan (NEMMP) 2020 target of 6-7 million EV and hybrid sales by 2020. However, there is a steady uptick in the sales of EVs since 2017 as shown in Figure 3. A number of high-voltage electric cars were launched towards the end of 2019 and many more models showcased at the Auto-Expo 2020 were being readied for launch, including Tata Altroz EV, Mahindra eKUV100, and MG Marvel X (Carandbike 2020). The unexpected outbreak of the COVID-19 pandemic and its fallout has disrupted the global supply chains for EV components, mainly power electronics, battery, and the minerals that are used in these components (Wood Mackenzie 2020). The supply chain disruption has cast its shadow over the entire auto-industry, not just the EV sector (ETAuto 2020). The blossoming EV industry in India stares at an unclear future, as experts are divided on how the EV sector will eventually emerge out of the present situation: some have forecast stagnation while others see a possibility of the Indian EV sector becoming a strong contender in the global electric mobility manufacturing space (Panday and Ghosh 2020; Inc42 2020). Policy directives such as Faster Adoption and Manufacturing of (Hybrid and) Electric Vehicles Phase II scheme (FAME II scheme) and Phased Manufacturing Plan have been issued with a clear intent to transition to EVs. But the economy-wide impacts and environmental benefits of an EV transition have not been sufficiently studied in depth. Barring a few policy announcements, the government has not come out with a clear roadmap. A comprehensive policy roadmap and target for EV sales leading up to 2030 is found wanting.
Figure 3 EV sales in India have grown by at least nine times in four years.

Source: Sharma, Yogima. 2019. “Your Electric Vehicle Dream May Get a Rs 50,000 Jump-Start”; Overdrive. 2016. “Electric Vehicle Sales Reach 22,000 in India in FY 2015–16”; Frangoul, Anmar. 2020. “Electric Vehicle Sales in India Jump, with TwoWheeled Scooters Driving Growth”
For our projections, we explore three ‘marker’ scenarios compared to a business-as-usual (BAU) situation by 2030. These three scenarios we assume have (i) high public transport share, (ii) high private vehicle share, (iii) and high shared mobility. While a change in mode-share is partially influenced by economic growth (and associated paradigms), in our scenarios, we assume that it is mainly the outcome of mobility policy and behaviour change interventions. We characterise these marker scenarios by keeping overall passenger travel demand and the gross domestic product (GDP) constant between scenarios. We have taken a cue from a few studies that explore such scenarios, although keeping these two variables constant is a limitation of our research. To exercise control over the combination of underlying assumptions and to create the aforementioned scenarios, we developed a vehicle stock model. Based on outputs from our vehicle stock model, we further estimate fuel consumption in these three scenarios.
Using the projected vehicle stock in 2030, we estimate passenger and vehicle kilometres travelled (PKM and VKT) under various future scenarios for mobility in India. Our core focus though lies in the comparison between a BAU and a 30 per cent EV sales scenario (EV30), retaining mode-shares as BAU but involving a change in the fuel mix. We also contrast scenarios where a 30 per cent EV penetration is achieved under different mode-shares in serving the projected passenger travel demand, against the BAU. However, we assume occupancy ratio, vehicle ownership vs usage and average trip lengths to be constant, in the absence of robust data. This being another limitation to the study and hence estimates in all three scenarios remain conservative.
A range of methodologies, such as time-series analysis, the Gompertz function, artificial neural-network, and log-linear analysis, have been employed for vehicle stock modelling in the literature. Given the limited transport data available in India and the requirement of our study, we have employed a Gompertz function-based projection for 2030.
Further, due to limitations of the available PKM estimates, we have used vehicle ownership in the Gompertz function as the input as opposed to PKM. We have gathered segment-wise vehicle sales data from the Society of Indian Automobile Manufacturers (SIAM) between 1961 and 2016 to be applied in our projections. We arrive at historical in-use vehicles between 1985 and 2016 by using survival function as derived from on-ground surveys and historical vehicle sales data available from SIAM, as vehicle registration data is not a reliable indicator of vehicles on road (because retired vehicles are not accounted for, as mentioned earlier). See Figure 4 for a depiction of the vehicle stock model.
Figure 4 Outline of the vehicle stock model

Source: Authors’ analysis
The Gompertz function was then applied to project vehicle ownership until 2030. We do not distinguish between urban and rural segmentation of the vehicle population. Owing to the popularity of two-wheelers in the Indian market and their characteristics, they were modelled separately, and other vehicles such as cars, jeeps, three-wheelers, buses, and freight vehicles were pooled together for the model. We use a saturation level of 250 vehicles per 1,000 people for two-wheelers and 150 vehicles per 1,000 people for other vehicles. We assume a 1.9 per cent year-on-year GDP growth between 2019 and 2020 and 7.4 per cent between 2020 and 2021 based on the post-COVID-19 forecast by the IMF (International Monetary Fund 2020). Further, we assume a GDP growth of 6.4 per cent between 2021 and 2030, based on the compound annual growth rate (CAGR) between 2012 and 2021. The detailed methodology is discussed in the Annexure I.
We draw a comparison between EV sales of 4 per cent in a BAU scenario and a scenario with 30 per cent EV sales by 2030. It’s worth noting that the National Institution for Transforming India (NITI) Aayog and Rocky Mountain Institute (NITI–RMI) study projects a much higher share of EV penetration (NITI Aayog and Rocky Mountain Institute 2019). However, we keep the EV penetration at 30 per cent as India is part of EV30@30 campaign and as the country has committed to achieving that target (Clean Energy Ministerial 2017). See Figure 5 for a fuel mix we have projected for 2030 from our model.
Figure 5 In the fuel mix of new sales by 2030, between BAU and EV30 scenarios, twowheelers and threewheelers are likely to have a higher proportion of EVs.

Source: Authors’ analysis; NITI Aayog and Rocky Mountain Institute. 2019. “India’s Electric Mobility Transformation: Progress to Date and Future Opportunities”
The overall vehicle stock can be projected based on the Gompertz function, as described above, but the evolution of mode-share in future cannot be sufficiently represented by a single projection. Therefore, we project mobility paradigms based on three additional scenarios that could emerge by 2030 and explore the consequences of EV penetration in these scenarios as well. These are widely different mobility paradigms compared to the BAU: (i) a high public transport scenario (High PT) with significantly higher share of travel demand met by buses; (ii) a high private vehicles scenario (High PV) with substantial increase in the share of cars and two-wheelers (2W) in 2030; and (iii) a high shared mobility scenario (Shared) with higher share of shared-car trips and limited car ownership (see the flow chart in Figure 6). We are aware that various fuel technologies could also evolve along different pathways by 2030, but we only explore a future with significant penetration of EVs achieved via a supportive policy environment and investment in the EV industry. Therefore, we assume a 30 per cent EV penetration in new sales in 2030, allowing other fuel technologies to evolve as per historical trends in the remaining share of vehicles (see Table 1).
Figure 6 A flow chart depicting our vehicle stock and fuel consumption projections in three mobility paradigm scenarios.

As noted earlier, mode-share scenarios evolve along different typologies depending upon economic growth rates, which further has an impact on the passenger travel demand. To avoid too many variables complicating our calculations, we assume GDP growth rates and PKM to be constant across the scenarios. We further treat the annual vehicle distance travelled per mode the same across different scenarios. Similarly, the load factor is assumed to be the same in BAU, high PT, and high PV scenarios except for shared mobility, where we assume a load factor of 3 for both taxis and three-wheelers (3Ws). A detailed list of assumptions with sources are tabulated in Tables A2 and A3 in Annexure I.
Table 1 Description of scenarios explored in the study

Source: Authors’ analysis

In this section, we lay out our results on vehicle stock projection and energy demand under our assumed scenarios. We then go on to elaborate using data the impact of the projected EV transition on oil imports, government revenues, employment, environment and climate, as well as the market opportunity. We assume a 30 per cent EV sales by 2030 in accordance with the government’s target. Our main comparisons in this section are between the BAU and EV30 scenarios unless otherwise specified.
We estimate vehicle ownership in India to reach 80 per 1,000 people for all vehicles (passenger + freight) excluding 2Ws as per the vehicle stock model. Inclusive of 2Ws, the vehicle ownership will be at 259 vehicles per 1,000 people. As per our projections, even in 2030, vehicle ownership levels in India would be much lower compared to the rest of the world. For instance, in 2016, vehicle ownership in Brazil stood at 330 per 1,000 people and that in South Korea at 424 per 1,000 people as per available data (MoRTH 2018).

Figure 7 Two-wheeler ownership is projected to increase by about 2.2 times and vehicle ownership for all other road vehicles by 2.9 times in 2030 compared to 2016

Figure 7 cont...Two-wheeler ownership is projected to increase by about 2.2 times and vehicle ownership for all other road vehicles by 2.9 times in 2030 compared to 2016

The total stock of vehicles (passenger + freight) goes up by 165 per cent compared to 2016 (base year), driven by growth in GDP per capita and population. We derive the total passenger demand in billion passenger kilometres (BPKM) in 2030 from the vehicle stock (Figure 8). This requires us to assume a certain change in mode-share based on the methodology described in Annexure I.
Figure 8 Passenger travel demand is estimated to increase by about 1.9 times between 2020 and 2030

Source: Authors’ analysis
We compared the PKM, energy demand, and stock estimates against the existing projections (Figure 9 and 10). We find our estimates to be more closer to estimates from the recent studies such as those from The Energy and Resources Institute (TERI) and NITI–RMI (Spencer and Awasthy 2018; NITI Aayog and Rocky Mountain Institute 2017a). Differences in modelling paradigms and exclusion of taxis among road transport vehicles in the case of the CEEWGCAM (global change assessment model) estimate for instance contributes to the variation from our estimates.
Figure 9 A comparison of projected passenger travel demand and energy demand in 2030 by various models with our estimate.

Source: Authors’ compilation and analysis
Figure 10 Comparison of stock projections for 2030 between NITI-RMI and this study’s estimate.

Source: Authors’ compilation and analysis
We also carried out sensitivity analysis for vehicle ownership projection and energy demand estimation separately (Figure 11). Since 3Ws include a significant share of petrol, diesel as well as compressed natural gas (CNG) vehicles in the stock, we carried out sensitivity analysis for estimating energy demand for only 3Ws based on our assumptions. The sensitivity of mode-shares and EV penetration to energy demand is already captured in the scenarios explored in our study. Assumptions around saturation levels have a major influence on the estimated vehicle ownership whereas assumptions impacting load factor can lead to substantial variation in estimated energy demand.
Figure 11 Vehicle ownership projections in 2030 are sensitive to the saturation level assumption.

Source: Authors’ analysis
We further apportioned the total travel demand into mode-share under various scenarios relative to the BAU as shown in Table 1. The multiple mode-share scenarios that may evolve in future are assumed to be a consequence of policies, investments, and behavioural change interventions that prioritise specific modes over others to meet the same travel demand. These mode-shares, in turn, lead to various levels of fuel consumption by the transport sector as presented in Figure 12. As is evident, a high public transport scenario results in the lowest fuel consumption among all the scenarios and about 17 per cent lower than the BAU. At the other end of the spectrum, a high private vehicle scenario results in 17 per cent more fuel consumption compared to BAU.

Figure 12 A high public transport scenario has about 17 per cent lower fuel consumption compared to BAU in 2030

Source: Authors’ analysis
The different mode-shares result in changes to the overall vehicle stock number (see Figure 13). The change in the number of vehicles for a particular scenario is directly attributed to the effect of substitution. For example, the PKM demand met by one additional bus is equivalent to PKM demand otherwise fulfilled by 269 motorbikes. Thus, we observe a 57 per cent reduction in the total number of passenger vehicles in a high public transport scenario compared to a high private vehicle scenario.3 This has important implications beyond the auto-industry, on traffic congestion, air pollution, and parking issues.
Figure 13 On-road stock in a high public transport scenario would be about 57 per cent lower compared to a high private vehicle scenario in 2030

We then explored the outcomes of 30 per cent EV sales under each of the assumed scenarios as shown in Figure 14. Unsurprisingly, we find that energy consumption is highly reduced under high public transport and high shared mobility scenarios (27 per cent and 20 per cent respectively). While fuel consumption benefits are comparable for both these scenarios, but in case of a high public transport scenario, there would be 24 per cent fewer passenger vehicles on road compared to a high shared mobility scenario in 2030. Considering the benefits of better road-space use, lower parking space requirements, and reduced traffic congestion, a high public transport scenario is the preferred mobility scenario for India by 2030.
Figure 14 Energy demand is about 12 per cent lower in case of 30 per cent EV penetration compared to a BAU scenario in 2030

Source: Authors’ analysis
Among the many measures to revive the economy in the aftermath of COVID-19, electric mobility should be prioritised as a key sector for India’s economic recovery and sustainable growth. In an EV30 scenario, the domestic value-add generated in manufacturing, reduction in oil import bill, and environmental and health benefits far outweigh the loss in valueaddition from the petroleum and automotive sectors as shown in Figure 15.


When comparing direct jobs, there are more jobs lost than created in the transition. However, assessment of job creation only considers direct manufacturing jobs associated with EV powertrain, batteries, and charging infrastructure and jobs in the electricity sector. Direct jobs from activities such as installation and operations, charging infrastructure, battery recycling, telematics, and other service-related jobs and indirect jobs have not been taken into account. But we suggest that the EV roadmap for India should identify activities beyond manufacturing within the EV value chain for job creation.
If EVs garner 30 per cent of vehicle sales by 2030, the central and state governments are set to lose revenue from petrol and diesel taxes by 15 per cent compared to BAU. When pushing for EV transition, the government’s plans should also include diversification of revenue sources.
Figure 16 A 30 per cent EV transition by 2030 will come with its own set of trade-offs.

Source: Authors’ analysis
In FY19, the oil consumption from road transport stood at 91 Mtoe, with diesel making up 66 per cent of this consumption. Petroleum imports constituted nearly one-third of India’s total imports in value terms and the country imported 87 per cent of its domestic consumption of crude oil according to provisional estimates (MoPNG 2020). The government has therefore set a target of reducing oil import by 10 per cent by 2022 (PIB 2020). Electric mobility and limiting private vehicle ownership hold key to achieving this target.
Oil import bill (INR crore) Reduction in oil import bill
The total savings in oil import bill under assumed scenarios range from INR 1,07,566 crore (USD 14.1 billion in 2020 prices) to INR 2,16,043 crore (USD 28.3 billion) as presented in Figure 16.4,5 For comparison, India’s trade deficit in FY20 stood at INR 11,57,108 crore (USD 153 billion) (Suneja 2020).
It is worth noting that, in an EV30 scenario, the oil import bill drops by 15 per cent compared to BAU, while in the case of High PV–EV30 (high private vehicle ownership and 30 per cent EV penetration) scenario, the oil import bill exceeds BAU by 4 per cent. Lower private vehicle ownership, coupled with promotion of electric mobility, would effectively bring down passenger transport energy demand. We find that, in our analysis, the biggest savings in oil imports can be realised from scenarios that combine higher shares of public transport and shared mobility with a penetration of electric vehicles.
Figure 17 Oil import bill to the exchequer is the about 31 per cent lower in a scenario with high public transport modeshare and 30 per cent EVs in 2030.

Source: Authors’ analysis
Reduction the petroleum tax revenue of central and state governments
While the intent is to bring down the consumption of petrol and diesel through changes in mode-share and fuel mix (Figure 18), it also has to be borne in mind that the petroleum sector is a significant contributor to revenues for the centre and states in the form of taxes and dividend income. The total revenue realised from taxes on petrol and diesel was INR 5,76,000 crore in FY19, with 60 per cent of these revenues going to the centre and the remaining to the states (PPAC 2020). Tax on fuel constitutes 15–20 per cent of tax revenue for the majority of the states (RBI 2019). Hence, we explored how changing petrol and diesel consumption levels could impact central and state government revenues in 2030.
Figure 18 The consumption of petrol and diesel is highest in the high private vehicle mobility scenario and lowest in the high public transport mobility scenario.

Source: Authors’ analysis
The central government would lose 15–31 per cent of potential petroleum tax revenues (otherwise obtained in a BAU scenario) in 2030 in multiple scenarios we assume for 2030 (Figure 18). The combined state government revenues from petroleum tax could dip by 15–33 per cent under various scenarios compared to BAU. On the other hand, in a high private vehicle scenario, the central and state governments, respectively, gain a revenue of 4 and 8 per cent in the form of fuel taxes. The loss or gain in fuel tax revenue, which is a reflection of consumer spend on petrol and diesel, should be viewed from a larger macroeconomic context. The consumer spending less on fuel is left with a higher disposable income, which, in turn, is expected to increase the consumption of other goods and services in the economy (Cambridge Econometrics 2015).
Figure 19 Central and state governments would incur a loss of 15 per cent in revenue from the sale of petrol and diesel in an EV30 scenario relative to BAU.

Source: Authors’ analysis
Assuming current electricity duty rates, revenues generated from increased electricity consumption from EVs will be limited, as shown in Figure 20.7 While pushing for penetration of electric vehicles, both central and state governments need to devise strategies to reduce its impact on their own revenues and wean away from excessive dependence on revenues linked to petroleum consumption.
Figure 20 Electricity duty revenue increases manifold in various EV30 scenarios compared to BAU.

Source: Authors’ analysis
Figure 21 The total cost of ownership of electric vehicles is expected to decrease by 9-20 per cent compared to their ICEV counterparts in 20308

Source: Authors’ analysis
In the course of transition to electric mobility, new high-skilled jobs in the manufacturing of batteries, EV powertrain, and charging infrastructure are likely to be created. Additional consumption of electricity will drive job creation in the power sector. Simultaneously, reduced consumption of oil would lead to a reduction in jobs created in the petroleum sector and in internal combustion engine (ICE) vehicle manufacturing. However, it’s important to factor in the job intensity of each of these activities in the economy (see Figure 22). The petroleum value chain (refining, processing, wholesale, and retail) creates the least number of jobs per INR 1 crore of output value-added.
Figure 22 Job intensity is the lowest in oil production and highest in ICE car powertrain manufacturing.

Source: Authors’ analysis
In a 30 per cent EV scenario, around 1,21,422 jobs would be created across the EV value chain in 2030 (Figure 23). This figure includes jobs created in battery, powertrain, and charging infrastructure manufacturing as well as jobs in the electricity sector11 due to increased electricity consumption by EVs.
Figure 23 About 1.2 lakh jobs in the EV12 value chain are expected to be created in an EV30 scenario.

Source: Authors’ analysis
If the EV transition at EV30 is realised by 2030, it is likely to result in a reduction of 19 per cent of jobs (1,57,448) in the petroleum13 and automotive (ICE vehicle) sectors as shown in Figure 24. We do not tally the net jobs created, as the current analysis only accounts for direct jobs. We don’t factor in jobs that are likely to be created in battery recycling, installation, and operation of charging infrastructure, and other EV-related services. It is relevant to note that macroeconomic modelling studies accounting for both direct and indirect jobs conducted in countries such as Italy, Britain, and Spain (economies with oil-import dependencies) have concluded that there is a net job creation from a transition to EVs on account higher domestic value-addition and investments as against BAU (Cambridge Econometrics 2015, 2018b, 2018a).
Figure 24 In multiple EV30 scenarios, 19–49 per cent of jobs are likely to be lost in the petroleum sector and ICE vehicle manufacturing activities compared to BAU.

Source: Authors’ analysis
The EV transition dynamics also portend bleak prospects for the traditional ICE vehicle-based automotive and petroleum value chain. Jobs will be lost in this value chain irrespective of whether net jobs are created. It is not clear, however, whether the current capacity expansion plans in automotive and petroleum sectors factor in the impacts of EV penetration scenario which could reduce economic utility and jobs that the two sectors would support in future (with the risk of assets being stranded). As the EV sector scales up, the new jobs created in the EV value chain would require imparting training and skilling to create a workforce that can cater to the needs of EV manufacturing as a prerequisite to meet any anticipated demand for EVs. So, a sound transition plan to identify sectors and activities where fewer jobs would be created in future to abate the adverse impacts and train the existing workforce for new jobs that would be created is very essential for the EV sector to thrive.
We further explored the market opportunity created by a demand for EVs in various scenarios that could infuse additional investments into the economy. Specifically, we looked at market size14 for batteries, powertrain, and charging infrastructure.
We estimate that the market size for batteries (for e-2Ws, e-3Ws, e-cars, and e-buses combined) in an EV30 scenario would be INR 53,632 crore (USD 7 billion)15 while that for charging infrastructure would be about INR 13,372 crore (USD 1.8 billion) in 2030. For e-2Ws, e-3Ws, e-cars, and e-buses, the combined market size for electric powertrain amounts to INR 1,45,452 crore (USD 19.1 billion)16 in 2030. In 2019, the market size of the Indian appliance and consumer electronics stood at INR 76,400 crore (USD 10 billion) and is expected to reach INR 1.48 lakh crore (USD 21.8 billion) by 2025 (IBEF 2020). The market size for batteries, powertrain, and charging infrastructure (components with significant share of value-add from electronics) taken together is likely to match the scale of consumer electronics market by 2030 (Figure 25 and 26). Domestic manufacturing of these high value-add components holds the key to capitalising on the market opportunity created.
Figure 25 A 30 per cent EV sales scenario is likely to create a market opportunity of more than INR 2 lakh crore (USD 26 billion) for EV powertrain and batteries in 2030

Source: Authors’ analysis
Figure 26 A 30 per cent EV sales in 2030 is likely to create a market size of about INR 13,372 crore (USD 1.8 billion) for public charging infrastructure.

Source: Authors’ analysis

Although a high personal vehicle scenario by 2030 brings in additional fuel tax revenue to the government and generates employment, a large presence of vehicles on road leads to higher local air pollution in Indian cities. We projected the levels of particulate matter (PM2.5), carbon monoxide (CO), nitrogen oxide (NOx), and greenhouse gas (GHG) emissions in 2030 to gauge the impact of change in mode-share and EVs (Figure 27).
As expected, a high personal vehicle mobility scenario spikes up local air pollutants, with a 25 per cent increase in CO emissions, 14 per cent higher NOx emissions, and 18 per cent higher PM emissions compared to BAU.17 This scenario also results in a 17 per cent higher GHG emissions compared to BAU.18 In contrast, in an EV30 scenario, the GHG emissions go down by 4 per cent, PM and NOx emissions reduce by 17 per cent, and CO emissions shrink by 18 per cent. The largest reduction in GHG emissions (20 per cent) is achieved in a scenario that combines 30 per cent EV sales with a higher mode-share of public transport. Further, major cities in India are already choked by congestion. According to a Boston Consulting Group (BCG) study, the total social cost of congestion from four large cities—Bengaluru, Mumbai, Delhi, and Kolkata—alone amounted to INR 1.68 lakh crore (USD 22 billion) (BCG 2018). India has the highest number of road accident deaths as per the 2018 World Road Statistics report, which compared 199 countries and about 1.5 lakh lives in India were lost in 2018 alone (MoRTH 2018). A predominantly private motor vehicle scenario, apart from polluting the environment in India, also exacerbates costs to the society in the form of congestion and road safety issues.
Figure 27 Higher private vehicle ownership pollutes the environment in Indian cities while shared mobility and high public transport usage lower the emissions of pollutants.

Source: Authors’ analysis
The world is currently reeling under the adverse impact of the COVID-19 pandemic, which has put brakes on economic growth as well. When India emerges out of the pandemic, the priority for policymakers would be reviving economic growth and creating jobs. We strongly feel that stoking the development of domestic EV manufacturing and creating a market for electric mobility in road passenger transport are promising interventions that foster economic growth and ensure sustainability. We therefore call upon policymakers and industry to collaborate on a transition plan for electric mobility that capitalises on the opportunities created in the form of improvement in balance of payments, new markets, and jobs generated at the same time taking adequate counter-measures to offset the impact on government’s revenues, oil sector, and ICE vehicle manufacturing.
We estimate an 165 per cent increase in vehicular population in the country between 2016 and 2030 to meet India’s growing travel demand. In an EV30 scenario, up to 12 per cent of reduction of oil consumption from passenger transport can be achieved. This strategy corroborates with India’s targeted goals of reducing oil import to improve trade balance and energy security. However, due to reduced fossil fuel consumption, as a result of dwindling share of ICE vehicles in the vehicular population in the country, central and state governments together are likely to incur a loss of revenue of about INR 1.1 lakh crore. This situation requires the government to come up with suitable strategies to wean away from dependence of petroleum tax revenues, which should be pursued in parallel to the promotion of electric mobility.
Importantly, EV penetration presents a tremendous market growth opportunity. The market for high value-add components in a scenario with the projected 30 per cent EV penetration amounts to about INR 2.1 lakh crore (USD 27.8 billion) in 2030 for batteries, electric powertrain, and charging infrastructure. These activities represent parts of the EV supply chain that can generate a significant stimulus for new investments in a favourable policy environment. The new manufacturing activities and increase in electricity consumption are expected to further generate close to 1.2 lakh jobs in 2030. A 30 per cent EV sales scenario is certainly not ambitious given that it can be met via sales of just e-2Ws and e-3Ws, which will have achieved cost competitiveness, both in terms of upfront cost and total cost of ownership by 2030. So, we strongly recommend that the EV roadmap for India should target a significantly higher share of EV penetration.
Merely catalysing electric mobility through policy and financial stimulus (subsidies) is not sufficient. For sustainable mobility, decongesting roads and improving road safety also should form part of plans chalked by policymakers. We recommend shaping and shifting mode-choice of citizens towards public and shared mobility to reduce traffic congestion and enhance road safety. For achieving the mode-share of choice, the central and state governments need to focus on decreasing motorisation through several strategies including incentivising public and shared modes of transport. Apart from widespread EV adoption, scenario in which public transport takes precedence over others has the potential to reduce oil imports by up to 31 per cent (compared to a BAU scenario). If citizens favour public transport and shared mobility, when combined with their shift to electric mobility, it can drastically bring down the level of PM, CO and NOx emissions, thereby having a positive impact on public health in India. Another positive externality in an EV-driven mobility, supplemented by public and shared mobility modes, whose economic costs have not been assessed in this study, is reduced congestion.
Future studies assessing the impact of EV transition on jobs could consider installation and operations jobs associated with charging infrastructure and differentiate between point charging and battery swapping. Further, indirect jobs and job creation in activities beyond vehicle manufacturing such as battery recycling and other services in the EV ecosystem were not assessed in the current study, which can be explored in future work.
Scaling Battery Swapping for India’s EV Ambitions
How States can Build Capacity for Urban Mobility Officials:
Can Indian Highways Support Zero-Emission Trucking?
India On The Move:Stories of people driving the bus sector