Council on Energy, Environment and Water Integrated | International | Independent
Suggested citation: Rahman, Anas and Abhishek Jain. 2021. How is India using its solar pumps for irrigation? Insights from Solar Pump Remote Monitoring Data in Chhattisgarh. New Delhi: Council on Energy, Environment and Water.
This study uses data from Remote Monitoring Systems (RMS) of 1131 pumps installed in the state of Chhattisgarh, under the state subsidy scheme, to understand the patterns of utilisation of typical solar pumps in India. As many as 674 pumps were installed in 2016-17 and the remaining during 2017-18. The study uses the daily utilisation data of these pumps available in the RMS portal.
The overall pump usage follows a pattern of two distinct irrigation periods in a year

Source: Authors’ analysis
Note: The top line of the chart represents the average sunlight hours available on that particular day. The seasonality of sunlight hours is clearly visible. The blue portion represents the average number of hours of usage, and the green portion represents the number of hours for which an average pump was unutilised on a given day.

Source: Authors’ analysis
Assuming the findings are not due to any systematic data errors, the study recommends that:
The Government of India has been aggressively promoting solar pumps for irrigation in recent years. On the back of significant government subsidies, about 300,000 off-grid solar pumps have been deployed in the country so far. While the technology is green, it is important to understand its on-ground usage after deployment. A few past studies have relied on primary surveys of farmers in different parts of the country, to assess pump utilisation. However, since most of these solar pumps have a RMS, one can use the RMS data to assess their utilisation. In this brief, we analyse the RMS data from the Saur Sujala Yojana (SSY), a solar pump promotion scheme by Chhattisgarh—the leading state in the deployment of solar pumps.
According to the Chhattisgarh State Renewable Energy Development Agency (CREDA), more than 80,000 pumps have been installed so far under the scheme, since 2016. RMS data from these pumps reside in seven different web portals set up by the respective controller manufacturers. More details about these portals and the RMS data are available in another brief, Making Remote Monitoring of Solar Pumps Work for States. We analysed the daily data usage (hours of usage and power generated) from one such portal.
The portal contains the RMS data of 1,131 solar pumps installed. Out of these:
The SSY is a rolling scheme, and its targets and specifications are revised every financial year. Correspondingly, the performance standards and device quality may vary from year to year. We see this aspect playing out in two ways in the dataset:
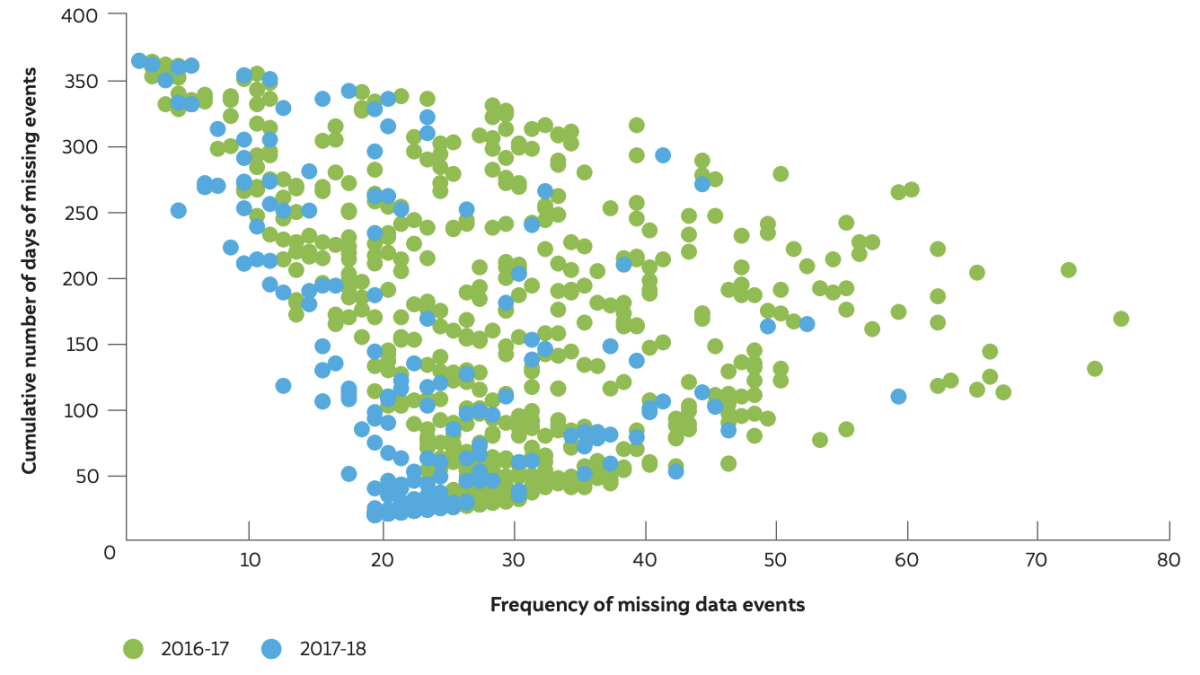
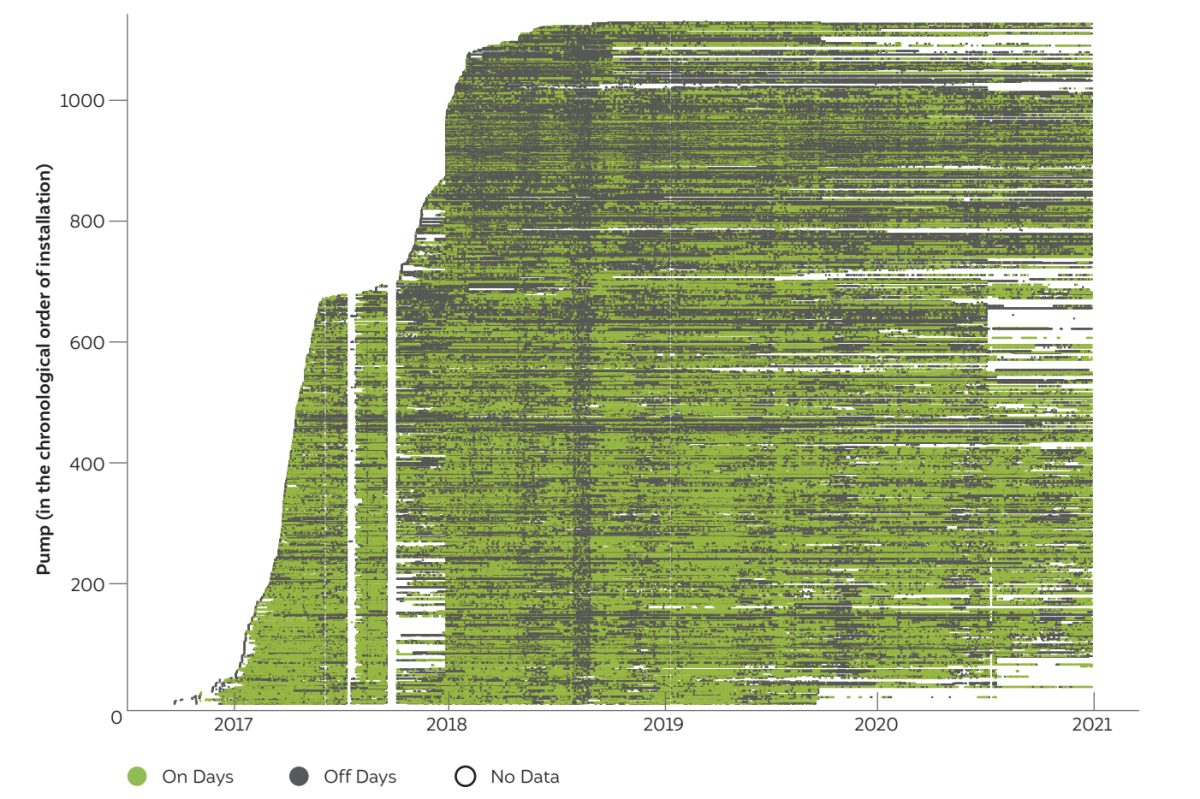
1. Data loss: Compared to SSY Phase-II, the SSY Phase-I pumps have a higher rate of data loss. Figure 1 compares the data loss for the two categories of pumps in the year 2018. The difference is likely due to the higher failure rate in the communication devices installed in Phase-I. Further, due to some system error, a significant part of the data in the second half of 2017 is missing from the database (Figure 2).
2. Difference in pump usage: We see a significant difference in the usage patterns of pumps sanctioned under different years. Figure 2 provides a high-level view of days for which a pump was switched on at least once (indicated by the colour green). Pumps installed before 2018 show a higher level of usage compared to the pumps installed since 2018.
Figure 1 Pumps installed in 2016-17 face a higher data loss than those installed in 2017-18
Source: Authors’ analysis
Note: The data is from the year 2018. Each dot corresponds to one pump.
Figure 2 There is a significant difference between the utilisation pattern of pumps sanctioned in different years
 Source: Authors’ analysis
Note: The pump number corresponds to the chronological order of their installation. Earlier the installation, lower is the pump number.
Due to these data limitations, we offer an analysis for the pumps installed in the first and second years separately, wherever necessary.
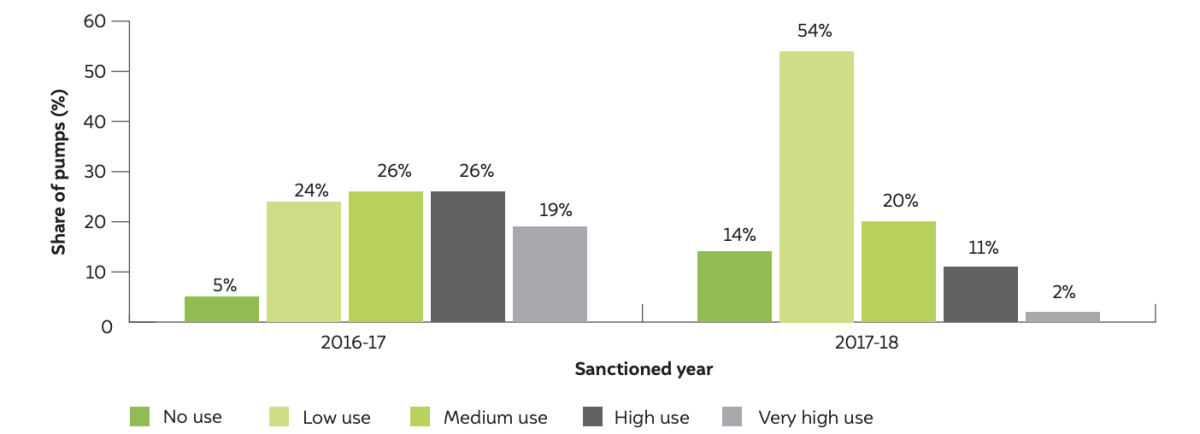
We classify the solar pump users based on their average annual hours of pump usage. Figure 3 shows the distribution of pumps in the five-fold classification mentioned below.
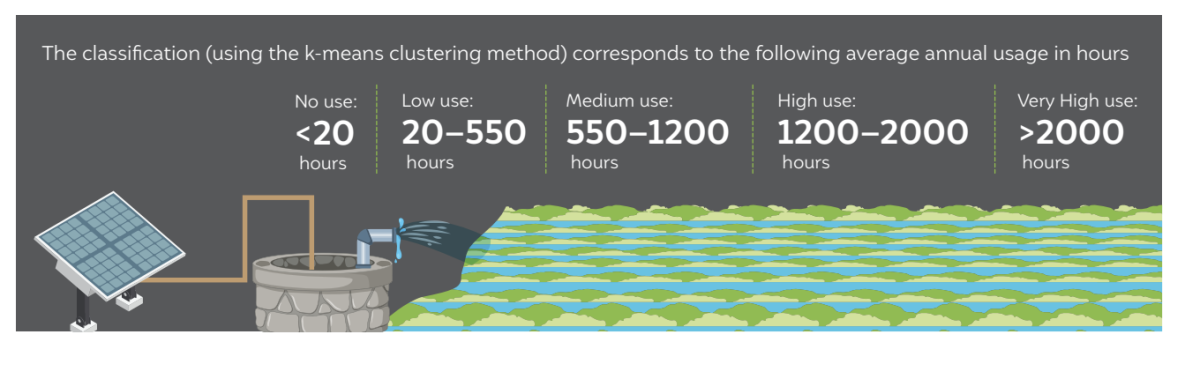
We have used the term ‘medium’ for the bracket in which the average pump use in hours has been observed in past studies, although there is quite a bit of variance in the average value (Mukherji, Shah, and Verma 2010; MERC 2020; Energy Management Centre Kerala 2018). We have used the remaining terms relative to the medium usage.
As discussed earlier, the pumps sanctioned in the two years follow very different distribution patterns of utilisation (Figure 3). The shares of ‘high’ and ‘very high’ use are quite large for the pumps sanctioned in 2016-17. In contrast, the shares of ‘no use’ and ‘low use’ are pretty high in the pumps sanctioned in 2017-18. The variation exists despite the geographically similar distribution of pumps (confirmed by the address data in the portal) and no change in the beneficiary selection criteria across the two sanctioned years. Other possible reasons could be faulty devices installed in one year, the difference in target beneficiaries in different years due to some unknown factors played out in those years, etc. A survey of the users can help us understand this better.
Figure 3 Pumps sanctioned in the separate years display diverse distribution patterns of pump use
Source: Authors’ analysis
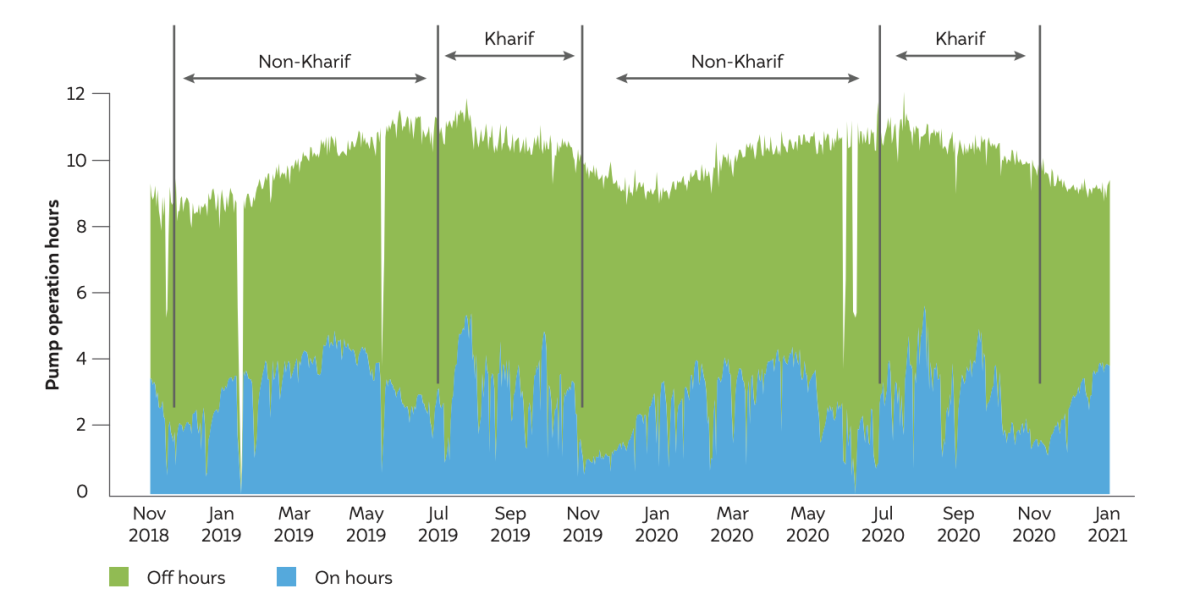
Figure 4 shows the average hours of pump operation on any given day between November 2018 and January 2021.
The pump utilisation data displays two distinct periods of usage in the state:
Figure 4 The overall pump usage follows a pattern of two distinct irrigation periods in a year
Source: Authors’ analysis
Note: The top line of the chart represents the average sunlight hours available on that particular day. The seasonality of sunlight hours is clearly visible. The blue portion represents the average number of hours of usage, and the green portion represents the number of hours for which an average pump was unutilised on a given day
We cannot identify the precise reason for the nondistinction between the Rabi and summer seasons, from the data. But the most likely reason is that farmers use solar pumps predominantly for vegetables or such other crops continuously during the non-Kharif season.
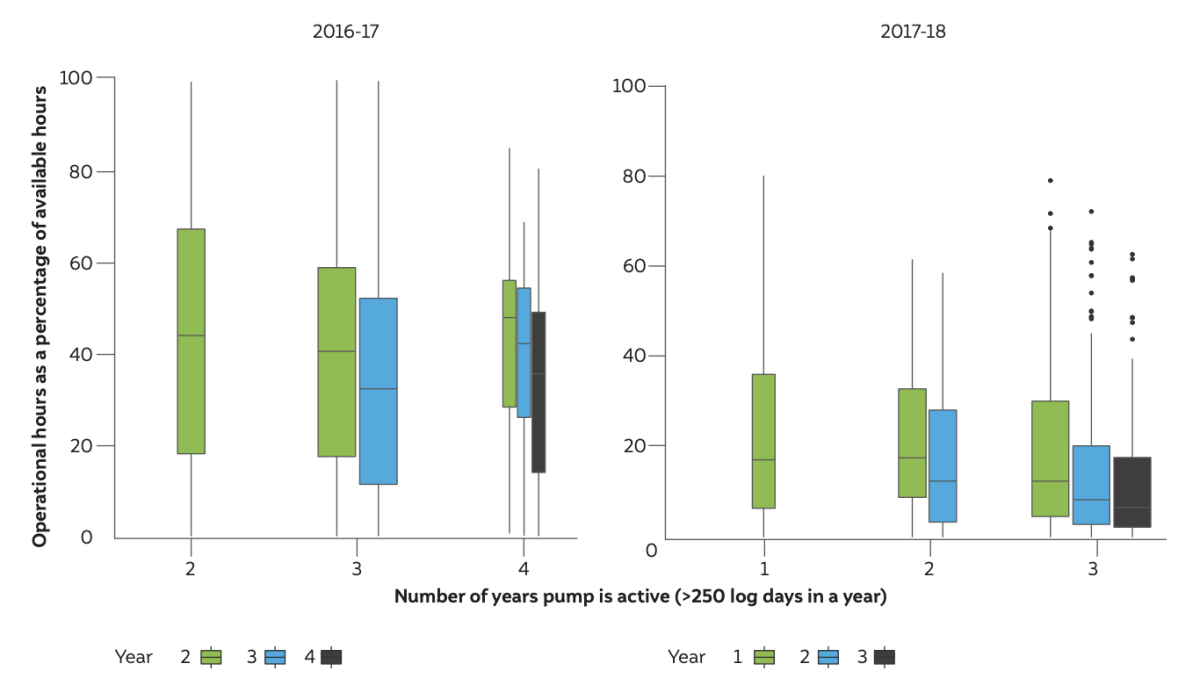
We analysed the change in the pump utilisation pattern over the years. Since there are significant data losses both at the individual pump and system level, we categorised pumps based on the number of years that they were active (at least 250 log days of data in the year and all preceding years). Additionally, due to the significant loss in the first year for pumps installed in 2016-17, we have not used their first year data for comparison. Figure 5 shows the pump usage data for pumps installed in 2016-17 and 2017-18 separately.
Figure 5 The annual operational hours of pumps is decreasing over the years
 Source: Authors’ analysis
Note: Since there are significant data gaps with many pumps, we have taken the operational hours as a percentage of the total hours of data available for each pump.
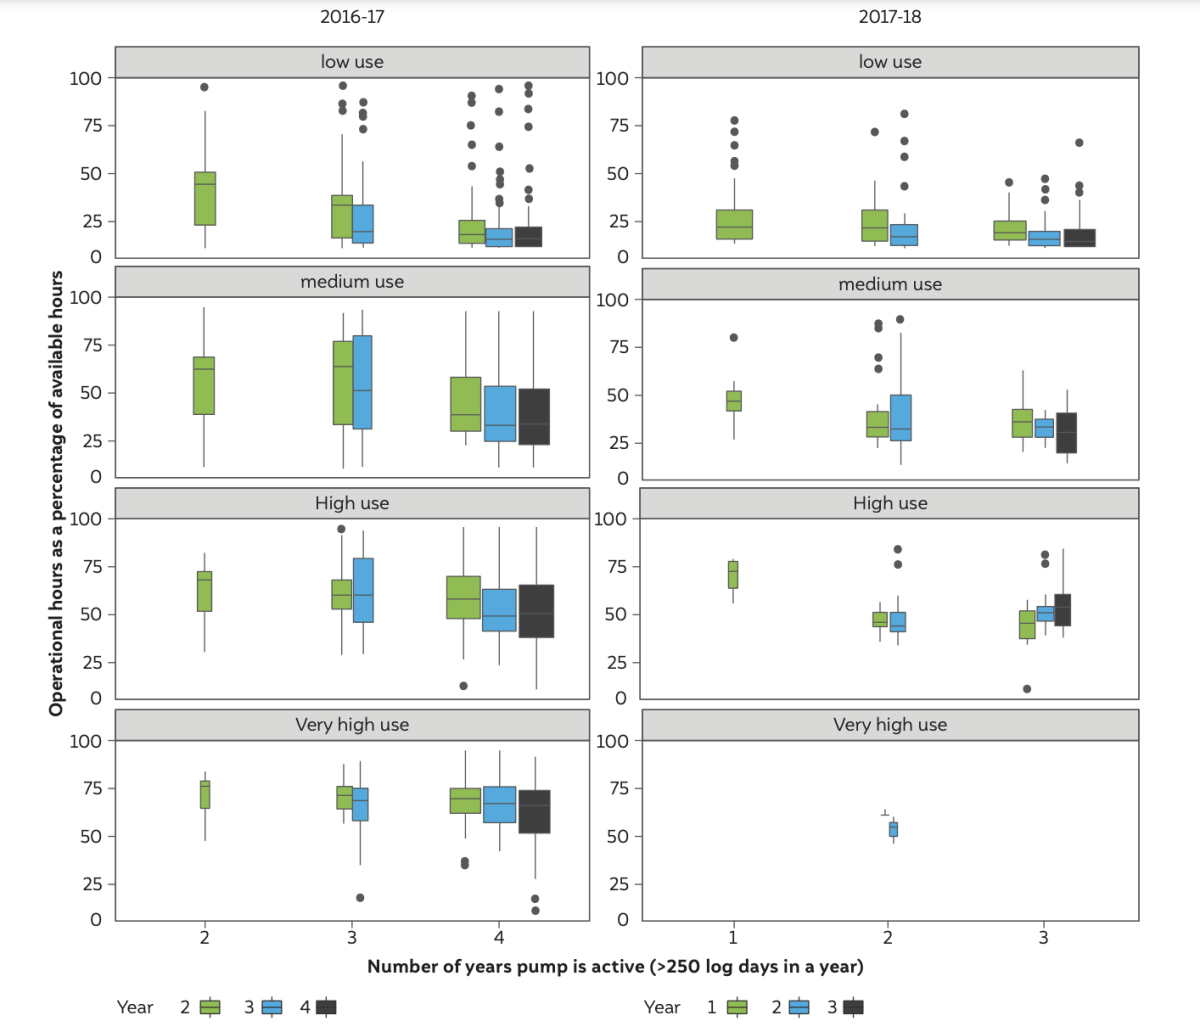
Although, as discussed earlier, both sets of pumps differ in actual usage, the average use is decreasing over the years for both sets. This decreasing trend is visible among all groups of pump users (Figure 6).
There could be multiple reasons for this trend of decreasing usage, such as:
The second reason stated above is unlikely, as no major studies on solar pumps so far, have reported such a significant shift in cropping patterns in the past. Typically, studies have found the farmers maintaining similar cropping patterns before and after solar pump installation (Goel, S et al., forthcoming). Studies have also shown that solar pump breakdowns occur at a much lower rate and are unlikely to explain the drop in utilisation rates as observed in the data. On an average, the frequency of pump breakdowns are less than once a year in the first 5–6 years of solar pump operation (Goel, S et al., forthcoming.; KPMG & GIZ, forthcoming.). A farmer survey can help us understand the actual underlying reasons for declining usage over the years.
Figure 6 The decreasing trend of operational hours is pertinent across all categories of users
Source: Authors’ analysis
We can test the possibility of farmers shifting their operations to peak sunshine hours (reason one, as listed above) by analysing the pump energy consumption data. If the reduction in usage is due to farmers shifting the time of irrigation, the energy consumed should at least remain more or less the same. The challenge in testing this hypothesis is that there are two categories of the pumps in the scheme— 3HP and 5HP, with corresponding PV arrays of 3 kW and 4.7 kW, respectively. But the details of the pump capacity of most of the pumps are not available on the portal.
In the absence of pump capacity data on the portal, we did a clustering analysis to differentiate the pumps into the 3HP and 5HP categories. Based on this categorisation, we plotted the energy generati on over the years (Figure 7). Considering data loss, we have only considered those pumps with more than 250 log days in a year and normalised the annual energy generation with data of the number of hours that were logged for a particular pump in the year. We also analysed whether there is a seasonal pattern in data loss (which can skew the above metrics). We discovered that while there are variations throughout the year, there is no systematic trend that can be observed in days of data loss.
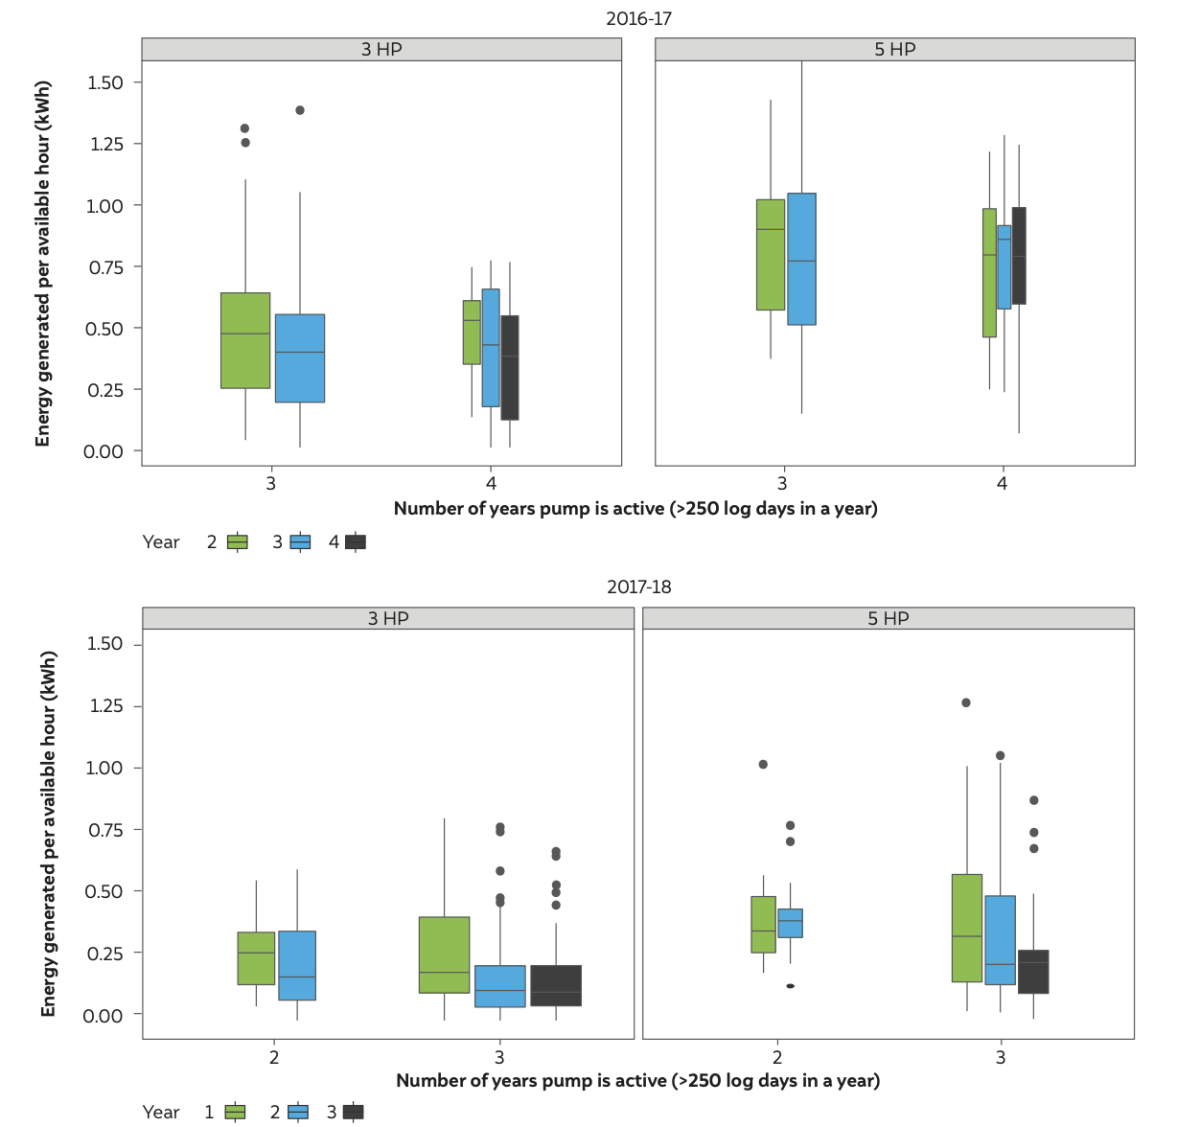
Source: Authors’ analysis
The trend in decreasing utilisation is also reflected in the energy generated, indicating a definite reduction in the overall utilisation of pumps. The decline in hours of usage is not due to the shift in irrigation to peak sunshine hours. The other possible reasons for decreasing utilisation can only be investigated through a well-designed survey of the farmers using these pumps.
The actual energy generated from solar panels varies, based on hours of usage, irradiation conditions and panel maintenance (e.g. cleaning). We estimated the energy generated as a percentage of the maximum energy generation potential, to understand the actual utilisation. We assumed a 16 per cent capacity utilisation factor (CUF) for estimating the maximum energy generation potential. We find that, on average, about 27 per cent of the energy generation potential is utilised. There is ample scope for using the remaining 73 per cent for other purposes, including livelihood applications.
This study aimed at analysing the broad utilisation pattern of solar pumps, using Chhattisgarh as a case study. The following are the key insights from the study:
Maximising Rooftop Solar Performance by Enabling a Robust O&M Ecosystem
What Drives Rooftop Solar Installation Decisions in Indian Homes?

Building a People-centric Energy Future:

Roadmap of the methodology to assess the climate co-benefits of the SUP ban in Tamil Nadu