Council on Energy, Environment and Water Integrated | International | Independent
Suggested citation: Agrawal, Shalu, Bharat Sharma, et.al. 2026. Anatomy of Distribution Losses in India’s Power Sector: Findings from a Feeder-level Study in Uttar Pradesh. New Delhi: Council on Energy, Environment and Water.
India’s clean energy transition hinges on the financial health of its power distribution companies (discoms). Over the past decade, aggregate technical and commercial (AT&C) losses of public discoms in India have declined by a third to 16.37 per cent in FY2024. However, achieving a closer alignment with the global average (~6 per cent) requires a deeper understanding of the local and systemic factors underpinning distribution losses. Distribution losses, defined as the share of electrical energy served but not billed, are a key contributor to discoms’ revenue shortfalls and financial losses in India.
This policy report sheds light on the composition and drivers of electricity distribution losses in a specific high-loss electricity feeder in Uttar Pradesh (UP). Conducted in collaboration with the Uttar Pradesh Power Corporation Limited (UPPCL), the study involved granular energy accounting of the feeder based on asset mapping, consumer surveys, and immersive research conducted in 2022.
The findings illustrate how targeted efforts can address local challenges, but structural reforms and innovative solutions are required to overcome systemic issues in the state’s distribution sector. The report offers evidence-based recommendations to leverage the Revamped Distribution Sector Scheme (RDSS) to address prevalent structural problems through the strategic deployment of smart meters and supporting infrastructure.
India’s power sector transition relies on financially healthy and digitally smart power distribution companies (discoms). Since 2015, public discoms in India have made notable progress in reducing their aggregate technical and commercial (AT&C) losses by one-third – to 16.37 per cent in FY2024 (PFC 2020, 2025). Discoms need to sustain this momentum to further reduce losses and move closer to the world average of 6 per cent.
Several policies, financial interventions, and technological interventions have powered discom reforms in India in the past. Yet discoms’ finances have often worsened after short recovery periods (A et al. 2020; Verma et al. 2020). The recent decline in losses is mainly due to improved revenue recovery, as state governments made timely payments of electricity subsidies to discoms (IEA 2025). The future wave of reforms would require a significant reduction in distribution losses, defined as the share of energy served but not billed.
The national Revamped Distribution Sector Scheme (RDSS) aims to reduce discoms’ AT&C losses to 12–15% by March 2028 (Ministry of Power 2025). As Indian discoms march ahead to invest in smart metering infrastructure and network upgrades, their deployment must be informed by the existing on-ground challenges and factors driving distribution losses.
We aim to investigate the factors and mechanisms that underpin distribution losses in the electricity sector and inform future reform and smart metering strategies. We adopted a mixed-methods approach for an immersive, research-cum-intervention pilot in a specific highloss electricity feeder at a public discom in Uttar Pradesh (UP). We answer four questions:
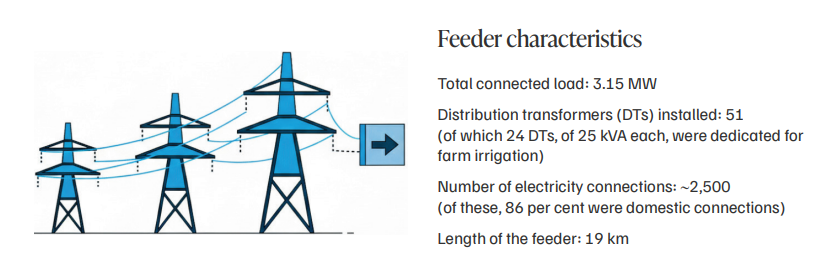
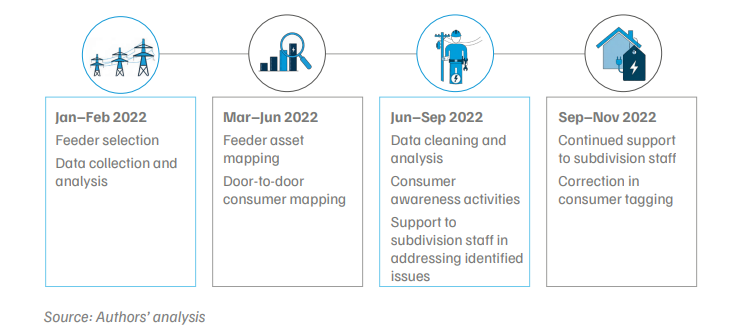
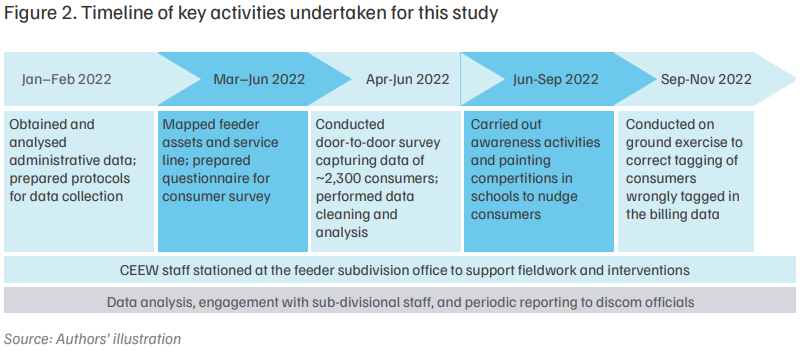
Table ES1 describes the study design and approach. Figure ES1 gives the timeline of the activities we carried out between January and November 2022.
Table ES1. Study design and approach
| Activity category | Key actions undertaken |
|---|---|
| Data collection |
|
| Engagement with the Subdivision staff |
|
| Consumer engagement and awareness drives |
|
| Senior leadership engagement |
Provided periodic updates on field challenges and support needs of the ground staff and sought feedback on emerging insights |
Source: Authors’ analysis
Figure ES1. Timeline of key activities undertaken for this study
Composition and drivers of distribution losses in the feeder
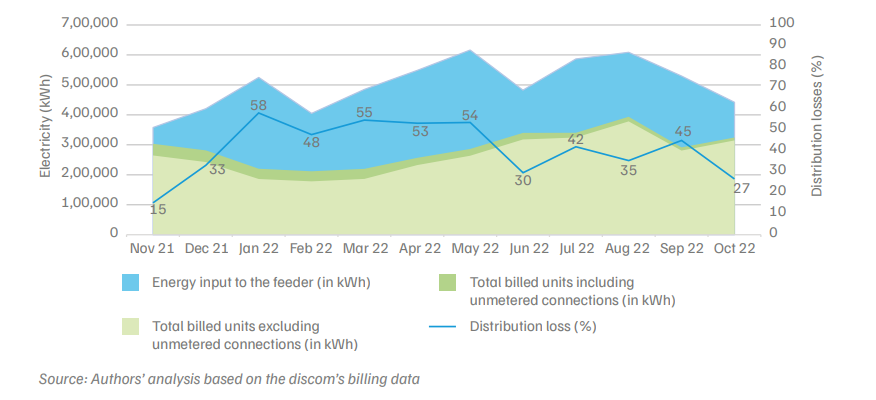
Using the discom’s administrative data and the primary data we collected through consumer surveys, distribution asset mapping, and field observations, we estimate distribution losses of 42 per cent in the feeder during the study period – thrice the normative losses allowed by the regulators. The monthly variation in distribution losses ranged from 15 to 58 per cent, with higher losses during the high-demand months (Figure ES2).
Figure ES2. 4 out of 10 units supplied to the feeder were not billed, with high losses during the high-demand months
Commercial losses account for two-thirds of the feeder’s distribution losses due to gaps in metering, under-billing, and electricity theft (Figure ES3). Technical losses at the high-tension (HT) and low-tension (LT) network accounted for the remaining one-third of losses. Table ES2 illustrates the local and systemic issues underpinning the observed distribution losses in the concerned feeder.
Figure ES3. Commercial losses comprise two-thirds of the feeder distribution losses
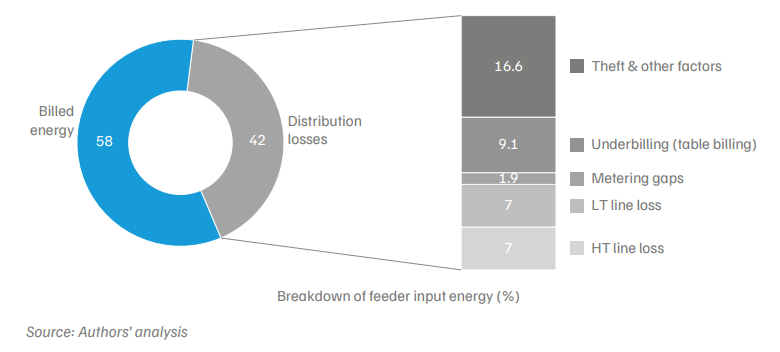
Table ES2. Local and systemic factors behind feeder-level distribution losses
| Category of losses | Local issues | Systemic issues |
|---|---|---|
| Commercial losses |
Inaccurate consumer indexing: 8 per cent of consumers were tagged to the wrong feeder/ subdivision/division; contact details of 31 per cent of consumers were outdated Metering gaps: 14 per cent of consumers had no meters or burnt/damaged ones Billing gaps: Nearly half the bills were generated without actual meter readings (we observed systematic under-billing in bills generated by unassigned meter readers); 2 per cent of consumers had never received any bills Electricity theft: 3 per cent of consumers were found using hooks for electricity theft and bypassing their meters |
Lack of robust consumer indexing and gaps in master data, including deviation from the ground reality on metering and billing status Design gaps in the billing application and protocol for assigning consumers to meter readers Presence of bare conductors that can be easily accessed for illegal tapping by willing consumers |
| Technical losses |
Feeder typology: We found lengthy feeders with ageing conductors, radial lines, and low HT/LT line length ratios Overloading and load unbalance on DTs: Two-thirds of DTs were unbalanced, and four overloaded during the peak demand month Presence of large inductive loads: We counted 48 farm tube wells, one flour mill, and over 35 ACs |
Lack of a robust real-time metering and network monitoring system that could assist the discom staff to record, update, analyse, and address emerging local issues Unused capacitor banks |
Source: Authors’ analysis
We jointly addressed many of the local issues contributing to commercial losses during June– December 2022. Our field and research teams worked closely with the subdivision office to identify and resolve issues such as gaps in metering, feeder tagging, and the lack of updated mobile details (see Section 2.6). We also conducted extensive consumer engagement drives on the importance of timely payment of bills and supported subdivision staff in addressing consumers’ billing issues. As a result, the average distribution losses during June–October 2022 were nearly a third lower than the average observed during January–May 2022. However, the losses were still higher than normative levels due to several systemic issues and technical constraints.
The feeder had a high collection efficiency of 97 per cent in 2022 but was reeling with the issues of delayed payments and a high build-up of arrears. On average, just 3 out of 10 consumers paid their bills every month, while most paid sporadically, often waiting for biannual collection drives, such as the One Time Settlement scheme, citing cash flow issues. Further, just 7 per cent of consumers accounted for 70 per cent of the pending arrears, of which the majority were in the domestic category.
We provide a granular analysis of electricity distribution losses in a high-loss feeder in UP. We found that the feeder had high collection efficiency (97 per cent) but very poor billing efficiency (58 per cent), indicating that high distribution losses are a major concern in the feeder.
Several local and systemic factors have contributed to the feeder’s commercial and technical losses. The discom staff addressed many of the local issues during the study period but could not solve the systemic issues, which stem from broader, discom-wide challenges and require coordinated state-level innovative and scalable solutions. The RDSS presents an important opportunity to address some of these structural problems through the strategic deployment of smart meters and supporting infrastructure.
We recommend five key approaches for UP discoms to address the systemic issues underlying the state’s distribution losses.
With the right mix of technology, institutional reform, and community engagement, Uttar Pradesh’s discoms can turn high-loss feeders into models of efficient, consumer-centric power delivery. This study shows that addressing systemic gaps — through smart metering, dynamic consumer indexing, network upgrades, and digitally enabled field staff — can enhance billing efficiency and improve the financial sustainability of discoms in the state. The RDSS scheme offers a timely platform to accelerate this transition and should be fully leveraged for operational efficiency, stronger service delivery, and future-readiness.
We also hope discoms in other Indian states will find these insights useful as they design their own loss-reduction and smart-metering strategies. Looking ahead, future research could examine the long-term impacts of smart metering on discoms’ financial health, consumer satisfaction, and innovative business models that use advanced smart-metering infrastructure to strengthen power-sector resilience and progress towards universal energy access.
In India, power distribution companies (discoms) play the crucial role of providing last-mile connectivity and power supply to consumers. However, they are also the weakest link in the electricity supply chain due to their poor financial health (Garg 2020). Discoms’ financial turnaround is fundamental to achieving multiple policy objectives, including the provision of uninterrupted 24×7 electricity supply to all consumers and the country’s clean energy transition (PIB 2024).
The aggregate technical and commercial (AT&C) losses in public discoms in India declined from 25.21 per cent in FY 2014–15 to 16.37 per cent in FY 2023–24 (PFC 2025).2 This followed several policy reforms and infrastructure upgrades. Yet only Kerala and Gujarat have discom losses closer to the world average of ~6 per cent, indicating significant scope for continued improvement across discoms in all states (Figure 1) (IEA 2025).

Despite previous policy interventions, discoms’ finances have often worsened after short recovery periods (A et al. 2020; Verma et al. 2020). Even after the Financial Restructuring Plan (2012) and Ujwal DISCOM Assurance Yojana (2016–20), the accumulated losses of the public discoms increased by ~50 per cent from INR 4.1 lakh crore (USD 49.5 billion) to INR 7.1 lakh crore (USD 85.3 billion) between FY 2014–15 and FY 2023–24, highlighting structural inefficiencies that remain unresolved (PFC 2018, 2025).3 These inefficiencies – such as outdated and inefficient infrastructure, poor billing quality and electricity theft, rising operational cost with reduced revenue generation, the inability to invest in infrastructure upgradation, and low technology adoption – contribute to persistently high distribution losses (FOR 2025). These losses lead to revenue shortfalls and mounting financial losses for public discoms in India (Agrawal et al. 2023; Swain 2016).
To address these gaps, in 2021, the Government of India introduced the Revamped Distribution Sector Scheme (RDSS) with the goal of reducing discoms’ AT&C losses to 12–15% by 2024–25. The scheme period has recently been extended to March 2028 (Ministry of Power 2025). The scheme has a provision for an outlay of INR 3 lakh crore (USD 34 billion) – a mix of grants and debt – with a significant contribution towards smart metering consumer connections, besides the metering of distribution assets (transformers and feeders) (PIB 2023). As of June 2025, 224 million smart meters have been sanctioned and 32 million installed across India (NSGM n.d.). As the state and its discoms begin to make large investments in the sector, India requires new strategies to address the existing on-ground challenges and the diverse factors affecting distribution losses.
We undertook this study to investigate the factors and mechanisms that underpin distribution losses in the electricity sector and to generate insights on systemic measures that can help discoms plug their energy and revenue leakages. We adopted a mixed-methods approach for an immersive research-cum-intervention pilot in a specific high-loss electricity feeder of a public discom in Uttar Pradesh (UP). We carried out an energy auditing exercise in the specific feeder and explored the following questions:
This approach allowed us to develop a deep understanding of the local and systemic factors responsible for the concerned feeder’s inefficiencies, which we draw on to suggest specific and systemic measures to plug these gaps. Most of the study insights are specific to the chosen feeder, as no single feeder can represent a discom or state’s entire distribution sector. So, we apply inductive reasoning to generalise our observations and suggest interventions for discoms across states that are facing similar challenges.
The financial viability of discoms in India has been a frequent subject of policy discourse and research. Past researchers have examined discom losses and reforms through an operational and financial lens (Aggarwal, Ganesan, and Narayanaswamy 2020; Das and Srikanth 2020), a political economy lens (Balani, Sharma, and Agrawal 2025; Dubash, Kale, and Bharvirkar 2018), and a consumer behaviour and rights lens (Burgess et al. 2020; Wong et al. 2021).
The novelty of this study lies in its bottom-up and mixed-methods approach. It is based on immersive research, which involves first understanding the problems and then devising and implementing context-specific actions in partnership with a public discom to assess and reduce losses within a high-loss feeder.
State and feeder selection
We conducted this study in UP, the most populous state in India, with 31 million electricity consumers and the country’s second-largest electricity consumption (Niti Aayog n.d.). UP presents an interesting case of a state where public discoms achieved one of the highest loss reductions (Figure 1) while also doubling their consumer base during 2014–2024.
In UP, discom losses plummeted two-thirds from 46 per cent in FY 2014–15 to 16.30 per cent in FY 2023–24, effectively converging with the national average. However, UP discoms’ accumulated losses increased from approximately INR 65,000 crore (USD 7.5 billion) in FY 2014 to around INR 90,000 crore (USD 10.3 billion) in FY 2024 (PFC 2016, PFC 2025).5 Additionally, the five discoms in UP showed varying trends, with DVVNL and PuVVNL discoms incurring higher losses than the others.
We chose to do this study in UP due to its high potential for power distribution reforms and the continued momentum in advancing them in the state, as well as the opportunity to do collaborative research with the state’s discoms. We partnered with the Uttar Pradesh Power Corporation Limited, the holding company for the five discoms in the state.
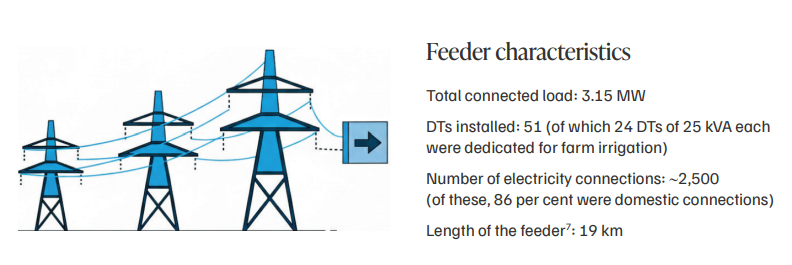
For this study, we selected a high-loss Integrated Power Development Scheme (IPDS) feeder serving a small town of approximately 15,000 residents, whose predominant source of income is labour (farm and non-farm) and agriculture. The following factors guided our selection of the feeder:
Data collection and other key activities
We undertook the following activities in the selected feeder in collaboration with the discom.
Data collection
Engagement with field officials
Consumer engagement
Senior leadership engagement: Provided periodic updates on field challenges and support needed by the ground staff
Employing a mixed-methods approach, we collected both quantitative and qualitative data, as described in Table 1. The data collection for this study took place during the calendar year 2022.
Table 1. Sources of quantitative and qualitative data used for feeder-level energy accounting
| Quantitative data sources | Qualitative data sources |
|---|---|
|
|
Source: Authors’ compilation
In line with the immersive nature of this research, a researcher from CEEW was stationed at the feeder’s subdivision office for the study period. The researcher was responsible for liaising with the field teams, obtaining consumer feedback, validating emerging research findings, and supporting the sub-division office in implementing interventions and ensuring timely action based on insights. The sequence and timeline of data collection and other activities undertaken for the study are shown in Figure 2.
Feeder asset mapping
Energy accounting is a standard tool to assess energy flows and detect leakages within a distribution network. To conduct energy accounting in this feeder, our first step was to map all distribution assets and index the consumers to them. An assessment of existing datasets indicated some inconsistencies (for example, only about 60 per cent of consumers were mapped to DTs) and the absence of a digital repository or service line diagram of distribution assets. Through discussions with the discom staff, we identified the need for a fresh asset and consumer indexing approach.
We developed a mobile application to map the feeder assets and service lines from the consumers’ premises. The following data were captured during the mapping exercise (Table 2):
Table 2. Data captured during mapping of feeder assets and service lines
| At the distribution transformer (DT) level | At the low-tension (LT) pole level |
|---|---|
| DT capacity, GPS coordinates, and image | GPS coordinates and image of the pole |
| DT meter number and its reading | Number of single- and three-phase consumers connected to each pole |
| Number of single- and three-phase consumers connected to each DT | Presence of bare conductor/AB cable |
| Number of circuits and high-tension/low-tension (HT/LT) poles | Any cases of electricity theft (hooked wires and meter bypass)8 |
Source: Authors’ compilation
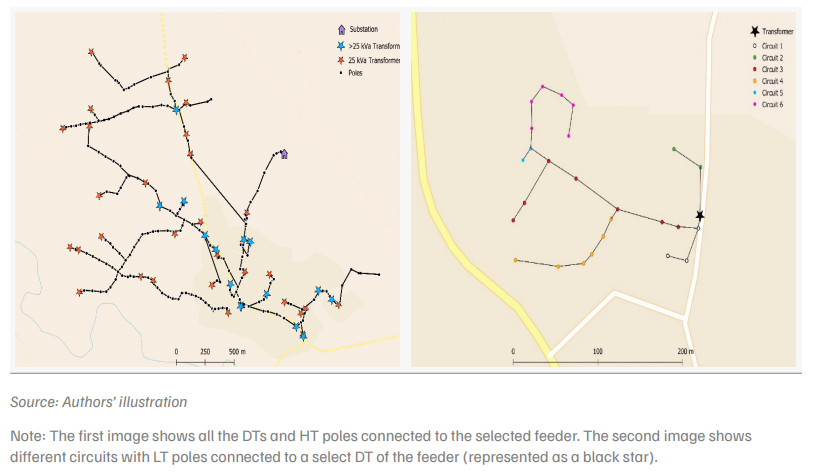
Next, we created a digital map of the feeder using Google My Maps and other geographic information system (GIS) platforms (Figure 3).9 This digital map was made available to the division and sub-division level staff. The intention behind this digital repository was to create a verifiable and validated database of assets that the discom field staff could use to remotely monitor the network, map consumers to the assets, conduct proper energy accounting to identify points of pilferage, and ensure that new staff are acquainted with the geography of the feeder. Due to the limited digital skills of the sub division staff, their use of the application during the project was primarily focused on correcting consumer indexing errors across feeders.
Figure 3. Digital maps of feeders and distribution transformers (DTs) are crucial for energy accounting
Consumer indexing
After completing the asset mapping, we conducted a detailed door-to-door consumer survey. The objective of the exercise was two-fold:
For this purpose, we used a separate digital survey form to capture the required consumer-level data. For each DT, we covered all households using the digital path created during the feeder asset mapping. Table 3 provides a detailed list of the parameters captured during the survey.
Table 3. List of parameters captured during the door-to-door survey
| Data collected | Parameters |
|---|---|
| Consumer details |
|
| Electricity connection details |
|
| Billing-related details |
|
| Consumer complaints |
|
| Bill payment status |
|
| Socio-economic profile |
|
Comparison of data from the discom and our field surveys
Before the consumer survey, we established a baseline using the discom’s April 2022 billing data, which listed 2,523 consumers on the feeder. However, our feeder asset mapping exercise initially indicated 2,328 consumers (using unique service lines) connected to the poles. Through our door-to-door consumer survey and first verification round, the enumerators mapped 2,336 premises.10 Out of these, the enumerators could initially survey respondents in only 2,109 premises. Around 95 per cent of these premises had an electricity connection.11 Of these, only 1,945 respondents furnished identification details, such as account number, meter number, or phone number. Of these 1,945 consumers, we could locate 1,881 in the discom’s billing data, and 1,812 were found to be correctly tagged to the feeder. Several consumers were still left to be mapped to the feeder, including around 230 surveyed consumers with invalid identification details; 185 consumers whose premises were locked or who refused to participate; and 36 consumers with new connections provided after the survey.
Given these gaps, we conducted additional field verifications, made telephone calls to consumers, and sought support from the meter readers and linesmen to map the remaining consumers. After these efforts, we mapped 694 additional consumers.
By October 2022, we had mapped all 2,575 consumers receiving electricity supply from the feeder. Figure 4 illustrates the overlapping and gaps between the data from the discom and the findings of our field surveys, highlighting the complexity of any consumer indexing exercise. It also includes the 36 new connections made in September–October 2022.
Through this consumer indexing exercise, we realised the challenges inherent in consumer indexing and learnt three crucial lessons:
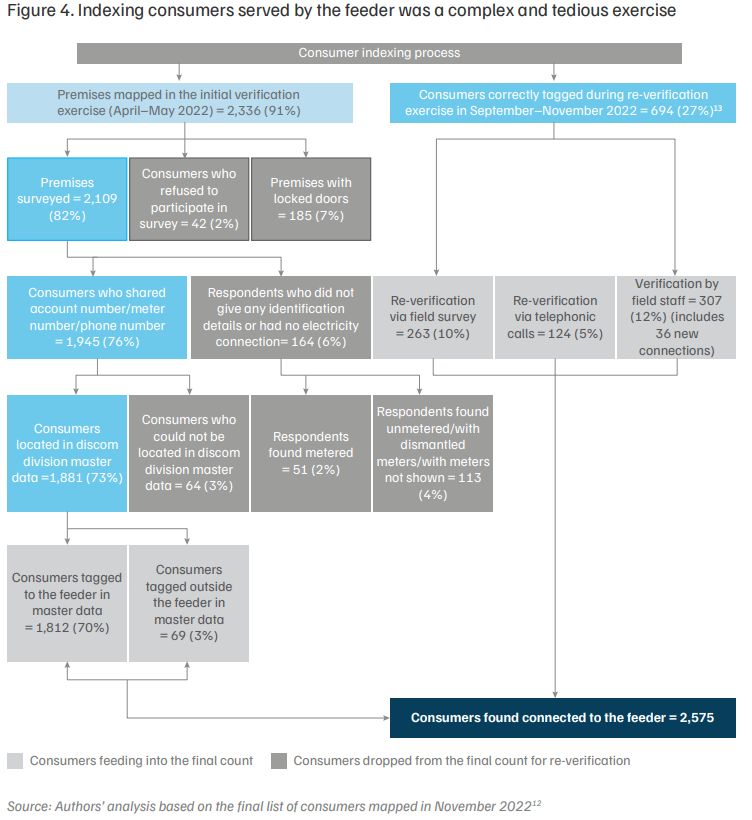
Note: The figure illustrates a comparison of the discom’s billing data and consumer survey data. Percentage values in brackets indicate share of the final count of consumers found connected to the feeder.
Socio-economic profile of consumers
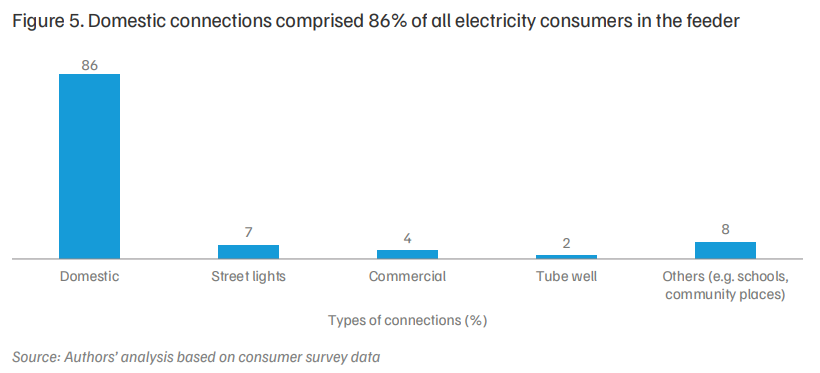
The selected electricity feeder supplies power to a small town. During the study period, 95 per cent of the premises visited were connected to the electricity grid. The remaining premises had their electricity disconnected, used off-grid electricity, or had no electricity at all. Around 1.2 per cent of all premises, primarily small commercial shops, relied solely on an off-grid solar panel with a battery. Another 2 per cent reported using solar systems along with a grid connection. Of the consumers connected to the grid, the majority (86 per cent) were residential, followed by commercial, institutional, and agricultural consumers (Figure 5).
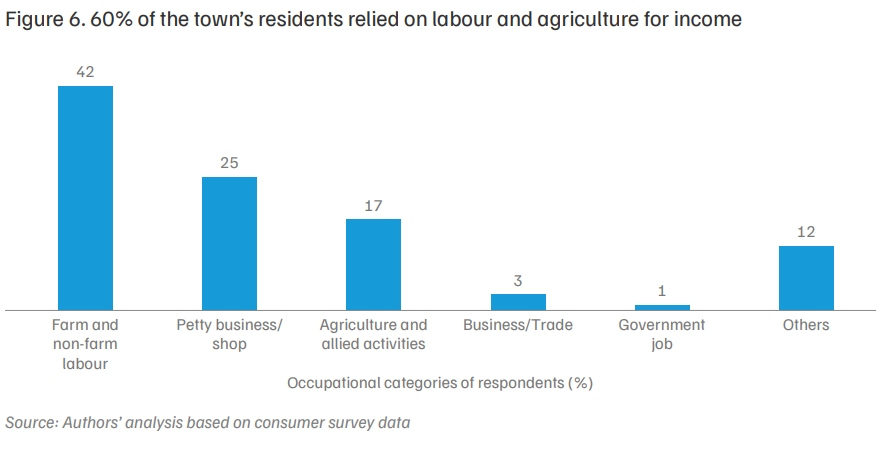
Approximately 60 per cent of the town’s residents relied on labour (farm and non-farm) and agriculture as their primary source of income. Another 25 per cent were self-employed and engaged in activities such as taxi driving, tailoring, running food stalls, and so on (Figure 6). Thus, a vast majority of the town’s residents relied on economic activities that may not offer a stable income.
To further assess the economic profile of the surveyed households, we employed K-means clustering, which categorised households into three clusters.13 Table 4 shows the variation in asset ownership (considered a proxy for income levels) across the three clusters. It can be seen that a majority (45 per cent) of the assessed households fall in the low-income cluster and use electricity typically for lights and fans. Another 44 per cent of the households fall in the middle-income cluster and typically possess appliances such as televisions, refrigerators, and water pumps. A minority (12 per cent) belong to the high-income cluster and possess energy-intensive appliances for space cooling and heating.
Table 4. Most (88%) of the domestic consumers in the feeder fell in low-middle income cluster
| Features | Upper-income cluster | Middle-income cluster | Lower-income cluster |
|---|---|---|---|
| Plot area (sq. ft) | 1,047 | 823 | 612 |
| No. of bedrooms | 4 | 2 | 2 |
| No. of toilets and bathrooms | 2 | 2 | 1 |
| No. of compact fluorescent lamps | 9 | 4 | 3 |
| No. of ceiling and table fans | 4 | 2 | 1 |
| Water pump ownership (%) | 74 | 62 | 8 |
| TV ownership (%) | 88 | 79 | 30 |
| Refrigerator ownership (%) | 94 | 78 | 18 |
| Room heater ownership (%) | 17 | 1 | 1 |
| Air cooler ownership (%) | 64 | 26 | 7 |
| AC ownership (%) | 13 | 0 | 0 |
| No. of consumers | 170 | 639 | 660 |
Source: Authors’ analysis based on consumer survey data
Note: The number of consumers analysed for clustering (1,469) is less than the total number of electricity consumers, because clustering was done only for domestic consumers and those who participated in the surveys.
Among the commercial establishments served by the feeder, more than two-fifths were small repair, welding, hardware, and electrical shops. Grocery, clothing, and common service centres also had a similar share. The rest were clinics, medical shops, and restaurants.
Around 16 per cent of the residents who primarily depend on agriculture (excluding agricultural labour) had private tube well connections. More than half of them participated in the survey and reported an average land holding size of 4 hectares. Around 60 per cent of the surveyed farmers used tube wells to irrigate mango and other plantation crops, while approximately 50 per cent shared their irrigation facilities with neighbouring farmers in exchange for some payment. Farmers cultivating plantation crops reported that their land needs to be irrigated more than three times, for three days under each irrigation cycle, and requires eight hours of watering daily. The remaining farmers mainly cultivated paddy, wheat, and seasonal vegetables, such as potatoes, during their respective cropping months.
Key issues identified and resolved
One of our objectives was to work closely with the discom to identify on-ground challenges, understand their causes, and co-develop ways to address them. We triangulated data from consumer surveys with feeder mapping and the discom’s billing data to identify gaps in metering, billing, and consumer tagging. Table 5 summarises the major issues identified.
Table 5. We worked with the subdivision office to identify and resolve several issues, including gaps in metering, feeder tagging, and consumer contact details
| Issues identified through consumer surveys | Number of instances/share of consumers (out of total) who reported issues | Status of resolution as of December 2022 |
|---|---|---|
| Lack of updated consumer mobile numbers in the master billing data14 | 799 (31%) | Mobile numbers of consumers captured during the consumer survey were included in the master billing data. |
| Unmetered consumers | 282 (11%) | Sixty-six per cent of unmetered consumers received meters, but the rest remained unmetered due to meter shortages and, in some instances, consumer resistance. |
| Consumers in the feeder incorrectly tagged to other feeders/subdivisions/divisions | 208 (8%) | All consumers were correctly tagged. |
| Consumers who had never received electricity bills | 49 (2%) | Discom dispatched first bills to 100% of consumers who reported never having received an electricity bill. |
| Consumers with dismantled/burnt/damaged/unclear display meters | 75 (3%) | Nearly all these consumer meters were replaced, except for a few, as some users declined meter replacement. |
| Consumers with meters outside the premises and inaccessible for reading | 34 (1.3%) | The discom planned to release a separate tender to resolve this issue through a third party. |
| Consumers using katiya | 70 (3%) | The action against theft was under progress. |
Source: Authors’ analysis of the discom’s billing data and primary data collected during the feeder asset mapping and consumer surveys
Notes: This table shows a subset of consumers in the feeder. Some consumers reported multiple issues, while many did not report any issues. 2. Katiya refers to the wire hooked to a bare and live conductor on the low-voltage side of the electricity distribution network to receive illegal electricity supply. It is a form of electricity theft.
To enable resolution of the various problems, we shared detailed, issue-wise lists of affected consumers with the subdivision office in June 2022. During July–September 2022, the subdivision office prioritised and resolved most of them, as Table 5 shows. We also periodically apprised the discom management of the emerging insights from the assessments and received guidance and support for addressing the issues identified in the feeder
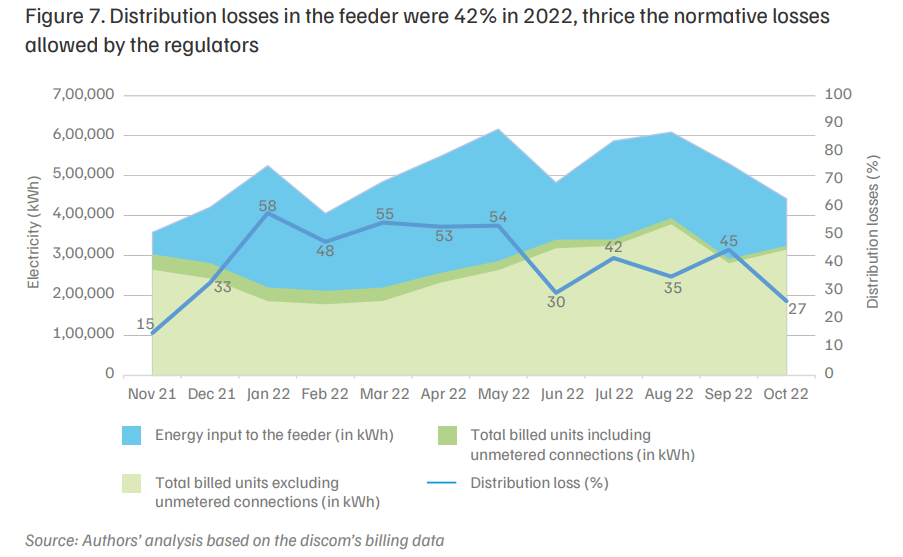
Distribution loss in an electricity feeder reflects the amount of energy supplied that is not billed.15 Our analysis indicates an average monthly distribution loss of 2.25 lakh units (42 per cent) in the feeder between November 2021 and October 2022 (Figure 7). Thus, four out of every ten units supplied to the feeder were a lost commercial opportunity. The feeder has around three times the normative distribution losses of 12–15 per cent targeted under the RDSS.
Notes:
The monthly variation in distribution losses was in the range of 15–58 per cent, with higher losses during higher-demand months. When we began this study in January 2022, monthly distribution losses were 53 per cent, and they remained above 48 per cent until May 2022.17 However, average distribution losses during June–October 2022 were 35 per cent, nearly a third lower than the average observed during January–May 2022. This can be partly attributed to the discom’s efforts to address the metering and billing problems identified during the study (discussed in Section 2.6).
In the next subsection, we discuss the composition of the distribution losses in the feeder and examine specific issues that directly or indirectly affect the feeder’s losses and their accurate estimation.
Technical losses
Using the feeder and DT meter data, we estimate technical losses of ~7 per cent (of the feeder input energy) at HT levels (11 kV) or in the primary distribution network. 18,19 This is significantly higher than the 1.5–2.5 per cent prescribed by the Central Electricity Authority (CEA 2023). These high technical losses are due to ageing conductors, the longer length of the feeder (~21 km)20, the presence of agricultural, that is, high inductive loads, and the overloading of DTs and lines during the high-demand months. A low ratio between the lengths of the HT and LT lines also results in low operating voltages and high technical losses. The feeder’s estimated HT–LT line length ratio is 0.63.21 This is close to the all-India HT–LT line length ratio, which was 0.62 in March 2022, but is much lower than the prescribed unity plus levels—that is, where HT line length is at least equal to or greater than LT line length (Aggarwal 2024; CEA 2023).
Further, technical losses in the LT network are typically higher than HT line losses, implying total technical losses of at least 14 per cent in the feeder. Technical losses in the LT network (below 11 kV) are typically higher than in HT lines of the feeder due to factors such as lower voltage levels, longer network length, inadequate conductor sizes, the presence of overloaded DTs and lines, single-phase LT lines, and imbalanced three-phase loading.
In the concerned feeder, we observed the following contributors to high technical losses:
In the absence of time-block-wise data on DT loading, we could not assess the specific times of the day when DTs were overloaded and the source of the excess loads.
Non-technical (commercial) losses
Computed as the difference between total distribution and technical losses, about 28 per cent of the energy supplied to the feeder during April–May 2022 was lost to inefficiencies in metering and billing as well as electricity theft. The notable presence of non-technical distribution losses is illustrated in Figure 7, where the seasonality in feeder energy input is not reflected in the overall billed units. This was particularly true in the pre-intervention peak-demand months of January and May 2022. Unpacking these non-technical losses is an important step in addressing them.
In the feeder, as in the rest of the state, the meter reading is contracted out to third-party billing agencies that hire members of the local community as meter readers to conduct monthly spot billing.24 Meter readers are critical agents in ensuring timely and correct billing for consumers, as well as in highlighting and addressing any metering issues. We observed several gaps in metering and billing in the feeder.
Metering gaps
As per the physical verification by the survey team, around 360 consumers (14 per cent) served by the feeder were unmetered or had dysfunctional meters. While the discom’s billing data for April 2022 recorded only 39 unmetered consumers, our survey identified 282 unmetered connections, 96 per cent of which were for domestic consumers.25 Additionally, 75 consumers reported dysfunctional meters. Metering gaps directly feed into billing inefficiencies.
Our field staff highlighted several reasons for this discrepancy and the presence of unmetered and dysfunctional meters.
Billing inefficiencies
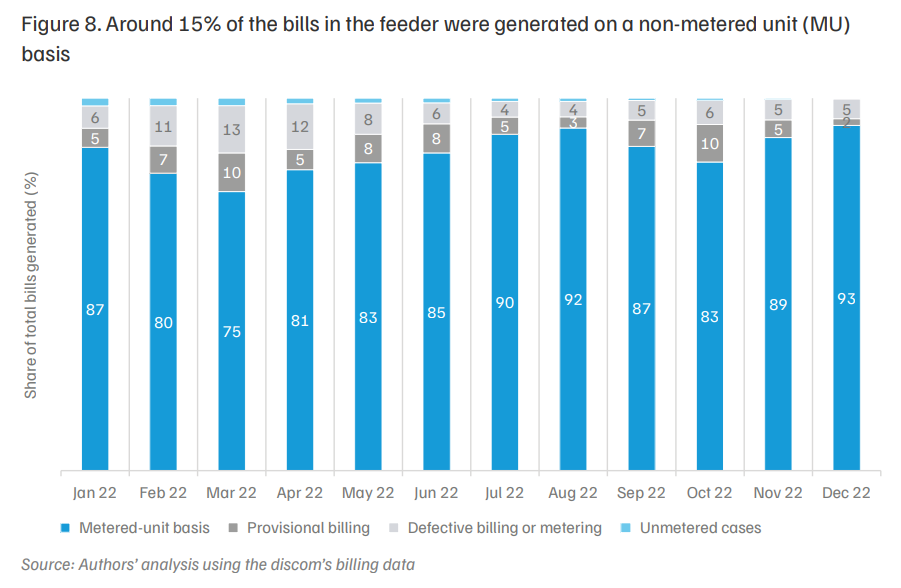
We observed several gaps in billing in the billing data. These included a significant number of cases of provisional billing26 or billing for defective and unmetered connections (Figure 8). Consequently, billing based on actual consumption data, or MU billing, was typically low, averaging 85 per cent in 2022.
We estimate that 4.7 per cent of distribution losses (or 7.1 per cent of non-technical losses) could be attributed to metering gaps (Table 6).
Table 6. Around 5% of the distribution losses were due to metering gaps
| Month | Distribution losses (kWh) | Unmetered consumers or those with defective metering | Average billed units for consumers with functional meters (kWh) | Losses due to metering gaps (kWh) | Imputed share of metering gaps in distribution losses | |
|---|---|---|---|---|---|---|
| A | Count (B) | Avg Billed Units (C) | D | E = (D-C) * B | F = E/A | |
| Apr 22 | 2,91,630 | 205 | 50 | 113 | 12,915 | 4% |
| May 22 | 3,29,988 | 155 | 43 | 162 | 18,445 | 6% |
| Jun 22 | 1,42,625 | 113 | 92 | 170 | 8,857 | 6% |
| Jul 22 | 2,46,135 | 101 | 47 | 148 | 10,155 | 4% |
| Aug 22 | 2,15,119 | 106 | 53 | 163 | 11,685 | 5% |
| Sep 22 | 2,37,970 | 99 | 55 | 115 | 5,951 | 3% |
| Oct 22 | 1,17,500 | 98 | 62 | 124 | 6,121 | 5% |
| Monthly average | 2,25,852 | 125 | 57 | 142 | 10,626 | 4.7% |
Source: Authors’ analysis based on the discom’s billing data
Note: For this analysis, we used the master data for the count of metering gaps, which is significantly lower than the number of such cases as per the survey data. These estimates are therefore somewhat conservative.
Our field work revealed further gaps in billing; we found that meter readers play a key role in table-billing and under-billing. Table billing happens when meter readers generate consumers’ bills without visiting their premises to record the actual meter readings. With a monthly target of billing 2,500 consumers within 15 days, meter readers face considerable pressure. As their commission is based on the number of consumers billed, this creates incentives to either reduce costs or maximise their income.
In the feeder, only ~60 per cent of consumers’ bills were generated by meter readers who were officially allotted the feeder for billing purposes. The remaining 40 per cent of consumers were being billed by meter readers from outside the feeder, implying that bills were generated without physical visits to their premises. Table 7 shows that this trend is highest in May and June (the peak summer months) and in August (the peak monsoon month). This could happen because all meter readers in a sub division had full access to the consumer list (billing book) in the sub division. At the same time, the discoms’ billing data from this period shows that ~80 per cent of such bills were recorded as generated on MU basis. This indicates a lack of adequate checks and balances in the billing software and billing application used by the meter readers, which would have otherwise prevented such faulty billing on such a large scale.
Table 7 also shows the difference in average units between the consumers billed by the feeder meter readers and those billed by outside readers.28 We estimate average under-billing of ~49 MWh per month in the feeder. This is equivalent to 22 per cent of the feeder’s distribution losses and around one-third of the non-technical losses. The under-billing estimates are highest for May and June 2022 and lowest in September 2022. Across months, ~90 per cent of the consumers billed by meter readers from outside the feeder were domestic, highlighting that under-billing is disproportionately prominent in this category.
Table 7. Consumers billed by meter readers from outside the feeder had lower electricity bills than those billed by officially assigned readers
| Month | Total consumers billed | Share of consumers billed on MU basis (%) | Share of consumers billed by meter readers from outside the feeder (%) | Average units billed by meter readers from the feeder (kWh) | Average units billed by meter readers from outside the feeder (kWh) | Potential under-billing (kWh) |
|---|---|---|---|---|---|---|
| A | B | C | D | E | E = (D – E) * A * C | |
| Apr 22 | 2,314 | 82 | 45 | 113 | 87 | 27,118 |
| May 22 | 2,382 | 83 | 57 | 162 | 76 | 1,17,648 |
| Jun 22 | 2,412 | 86 | 46 | 170 | 78 | 1,02,168 |
| Jul 22 | 2,425 | 91 | 27 | 148 | 85 | 40,279 |
| Aug 22 | 2,435 | 92 | 46 | 163 | 145 | 20,463 |
| Sep 22 | 2,436 | 88 | 34 | 115 | 97 | 14,993 |
| Oct 22 | 2,534 | 84 | 32 | 124 | 78 | 37,721 |
| Monthly average | 2,420 | 87 | 41 | 142 | 92 | 49,411 |
Consumer survey data on billing frequency in the year prior to the survey also validate these observations. Only ~40 per cent of consumers in the feeder reported having received bills every month; 45 per cent reported receiving bills irregularly or a few times during the year; and ~8 per cent mentioned never having received an electricity bill the previous year. The share of table billing declines slightly after June (barring the rainy month of August). This could be partly attributed to better weather and increased vigilance by discom staff, who were apprised of this issue in June 2022, after which they took action.
However, table billing was not limited to meter readers residing outside the feeder. After our on-ground interactions, we found that the meter readers who were formally allotted for billing may have also been practising table billing. There are two modes for spot bill generation. One is the online mode, where the bill generated is directly communicated and updated in the billing system. The other is the offline mode, used to avoid billing disruptions due to the unavailability of mobile networks. However, the meter readers were allegedly misusing the offline mode to carry out table billing. In some instances, consumers also colluded with the meter readers to generate lower unit bills in exchange for facilitation fees. From the discom data, we found that the cases of offline billing of consumers increased from 7–12 per cent during April–July 2022 to 32 per cent in August and ~70 per cent in October 2022. Still, it is challenging to distinguish genuine offline billing cases from table billing. The high incidence of offline billing raises valid concerns about potential revenue loss.
Presence of electricity theft/unauthorised connections and a poor distribution network
While conducting a door-to-door consumer survey, our enumerators noted about 70 cases of electricity theft in broad daylight through katiya and meter bypassing. The discom staff mentioned that such cases of electricity theft surge during night-time. Such a high prevalence of electricity theft (by ~3 per cent of consumers) is aided by the presence of bare conductors near consumer premises. The subdivision officials also shared that neighbourhoods with low aerial bunched (AB) cabling had a high prevalence of theft, and that the discom is undertaking several measures, including ramping up vigilance drives, to curb electricity theft in these localities. During the consumer surveys, our team also found instances of connections that were disconnected on a temporary or a permanent basis in past vigilance exercises.
Factor-wise contribution to feeder’s losses
Based on our empirical research, we conclude that commercial factors, such as gaps in metering, under-billing, and electricity theft, are the predominant drivers of high distribution losses in the concerned feeder. Table 8 shows our estimated break-up of distribution losses across key technical and commercial factors, as well as their share as feeder input energy. Due to the lack of robust, end-to-end metering data, our estimates rely on several assumptions (as discussed earlier) and should be used as broad indicators of key issues requiring the discom’s attention.
Table 8. Commercial factors emerged as the key drivers of distribution losses in the feeder
| Factors | As a share of distribution losses (%) | As a share of feeder input energy (%) |
|---|---|---|
| Technical losses | ||
| HT line loss | 16.9 | 7.0 |
| LT line loss | 16.9 | 7.0 |
| Commercial losses | ||
| Metering gaps | 4.7 | 1.9 |
| Under-billing (table billing) | 21.9 | 9.1 |
| Theft and other factors | 40.0 | 16.6 |
| Total | 100 | 41.6 |
The discom’s recovery of electricity bills is critical to the financial health of the entire power sector value chain. Low collection efficiency combined with high distribution losses can force discoms to seek short-term credit (which is expensive) to finance their working capital requirements. In this section, we discuss the gaps in revenue recovery from consumers served by the feeder, the reasons thereof, and the impact of our immersive study and the activities we conducted with the subdivision office.
Status of revenue recovery and arrears in the feeder
The delayed and sporadic payment of electricity bills emerged as a major challenge in the feeder. Although the feeder had a high collection efficiency of 95 per cent in 2021, it had a very low turn-up rate – the share of total billed consumers paying their bills in a given month – of 23 per cent. This implies that while most consumers eventually paid their bills, they paid sporadically or made cumulative payments, instead of paying every month. Figure 9 shows the feeder’s turn-up rate and collection efficiency during the April–December period for 2021 and 2022. We note that the turn-up rate was consistently very low but notably higher in 2022 than in 2021. This could be attributed to the on-site grievance redressal of billing issues, the increased instances of disconnections for non-payment, and the consumer engagement activities we conducted as part of this study.
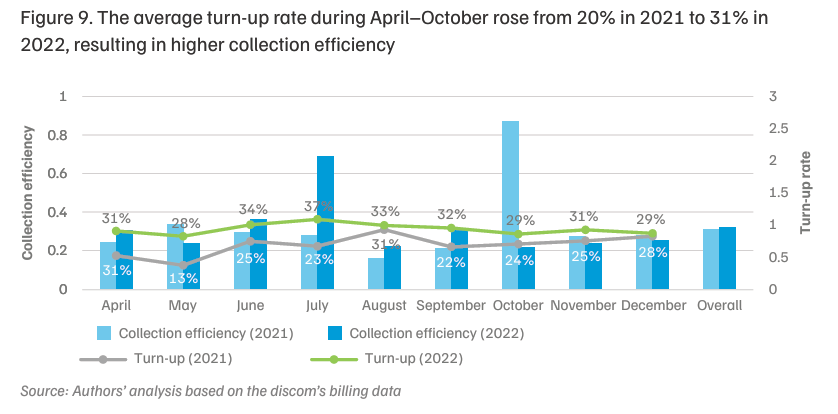
Average collection efficiency during this period was marginally higher, at 96 per cent in 2022. Collection efficiency exceeded 100 per cent in July 2022 and October 2021 due to the recovery of pending arrears during the state government’s One Time Settlement (OTS) scheme (Figure 9). Under the OTS, domestic, agricultural, and other designated consumers can pay their dues in instalments, after which the applicable surcharge is waived.
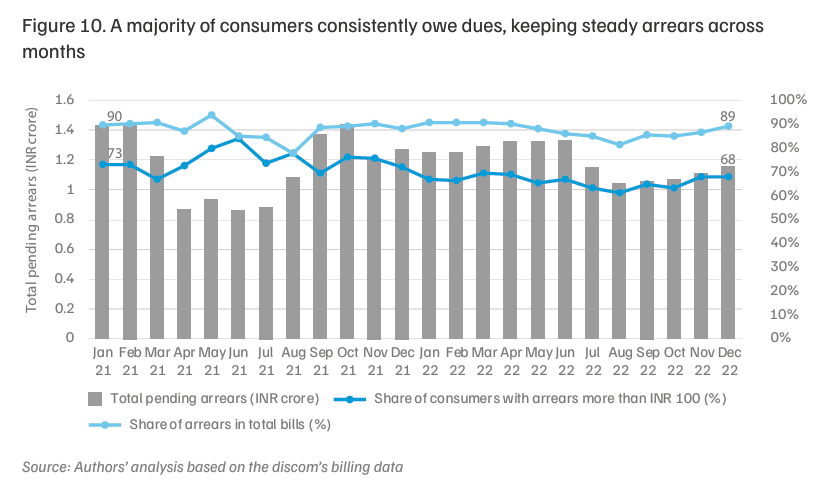
Despite the OTS, pending arrears are still a concern in the context of the feeder. Irregular bill payments from the feeder’s consumers had led to the build-up of arrears of over INR 1 crore (USD 0.11 million). Despite the marginal reduction in pending arrears between January 2021 and December 2022 from INR 1.4 crore (USD 0.16 million) to INR 1.2 crore (USD 0.14 million), the share of arrears consistently remained higher than 85 per cent of the total amount to be recovered from consumers each month (Figure 10). Sporadic efforts by the discom and schemes such as the OTS led to a decline in arrears (and their share) between March–July 2021 and July–September 2022. Nevertheless, the arrears rebounded after the OTS period.
Among the various consumer categories, domestic consumers contributed nearly two-thirds to the total dues of INR 1.2 crore (USD 0.14 million) in December 2022. Interestingly, public waterworks, under local body control, also contributed 13 per cent, that is, INR 16 lakhs (USD 0.018 million), to the total dues, with the highest dues on a per-connection basis (Table 9).
Table 9. Domestic consumers accounted for two-thirds of the total arrears in December 2022 but had the lowest average per connection
| Consumer category | Total arrears in December 2022 (INR lakh) | Category-wise contribution to total arrears (%) | Average arrears per connection (INR) | Number of consumers with arrears >10,000 |
|---|---|---|---|---|
| Domestic | 76.6 | 66 | 3,232 | 145 |
| Public waterworks | 15.6 | 13 | 5,19,993 | 2 |
| Commercial | 7.3 | 6 | 4,633 | 10 |
| Private tube wells | 6.8 | 6 | 13,078 | 14 |
| Others | 10.2 | 9 | 1,45,259 | 4 |
| Total | 116.5 | 100 | 4,497 | 175 |
Notes: “Others” includes public and private institutions, street lamps, and small and medium industries. 2. The 175 consumers also include 66 consumers with temporary disconnections.
In January 2022, 11 per cent (292) of consumers had arrears above INR 10,000 (USD 113) and contributed 77 per cent to the total arrears in January 2022. By December 2022, the share of consumers with larger arrears dropped to 7 per cent, which accounted for 69 per cent of the feeder’s total arrears. This underscores the need for targeted efforts to recover revenues from consumers with large pending arrears across consumer categories.
According to the UP-State Electricity Supply Code, 15 days after receiving the bill, consumers are to be temporarily disconnected if they have not paid. They will be permanently disconnected if they are temporarily disconnected (for not paying bills) for six consecutive months (UPERC 2005). However, in the feeder, 103 live consumers in December 2022 had arrears above INR 10,000, and the supply for more than half of them was not disconnected even once between July and December 2022, despite their not having paid a single bill.29 One reason for this is that the linemen and the other contractual staff are generally part of the same community as these consumers and want to avoid antagonising them. In a few instances, local socio-political dynamics may also influence the discom staff’s morale and ability to take timely action for revenue recovery (Balani, Sharma, and Agrawal 2025).
The discom has tried to facilitate the payment of dues in instalments through the OTS, but this scheme is a double-edged sword, as consumers are aware of it and therefore prioritise other household expenses over electricity bill payments. The lack of timely grievance redressal and punitive action by discoms, such as disconnection, reinforces such behaviour.
Consumer perspective on delayed payments and unpaid arrears
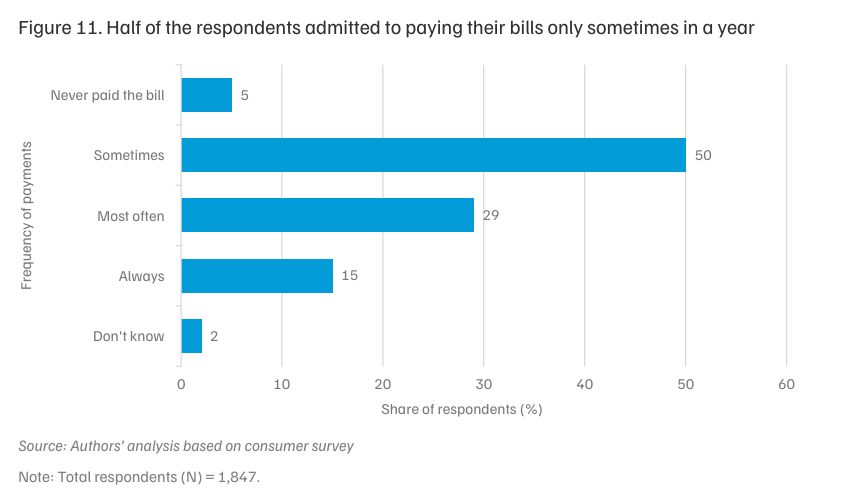
When asked about the frequency of their payments in a year, 44 per cent of the consumers shared that they paid regularly or most of the time. Half the consumers admitted to paying only a few times a year, while around 5 per cent said they have never paid their bills (Figure 11).
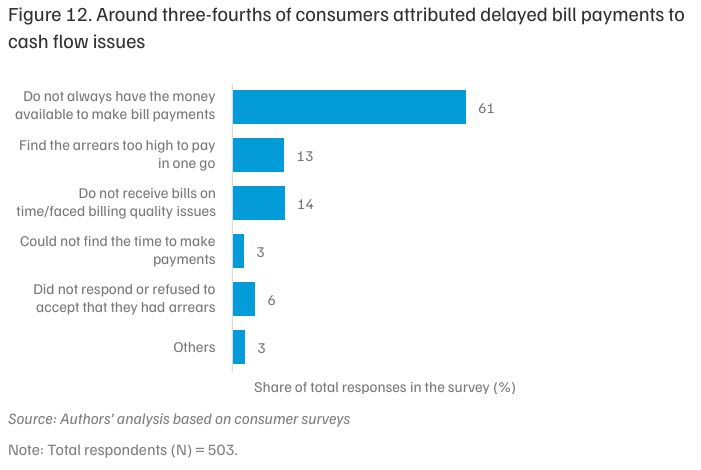
We asked consumers with arrears of more than INR 1,000 (USD 11.3) in the billing data why they did not pay on time. More than two-thirds of the respondents said they do not always have adequate money to pay their electricity bills.30 Around 60 per cent of the respondents rely on labour and farm activities and do not have a stable income source. Another 13 per cent said that their pending dues made it difficult for them to pay their bills in one go. Moreover, 14 per cent of the respondents mentioned not receiving their electricity bills from the discoms on time or raised concerns about the correctness of the bill amount (Figure 12).
We asked whether they plan to clear their pending dues, and almost all consumers responded positively, with 78 per cent waiting for a waiver and the flexibility to clear their bills in part payments over a few months. Interestingly, when we asked consumers if they would prefer an alternative billing cycle, which would allow them flexibility in payments, almost all consumers unanimously supported continuation of the current monthly billing cycle.
Using the discom’s administrative data and primary data from the surveys and field observations, we attempt to explain the composition of distribution losses in a specific high-loss feeder in UP. Technical and non-technical losses comprised around one-third and two-thirds of the feeder losses, respectively, on account of diverse network-related planning, execution, governance, and socio-political issues.
At 42 per cent in 2022, the distribution losses in the studied feeder are considerably higher than the state-wide distribution losses in UP, which are at 16.39 per cent (FY 2023–24). Yet our findings offer several learnings for the state discoms. Most of the local problems contributing to non-technical losses were resolved during the study period (see Section 2.6), but many of the aggravating factors are systemic issues. These include gaps in consumer indexing and feeder tagging; the metering status not being fully reflected in the master billing data; design gaps in the billing application and assignment of consumers to meter readers; and the lack of a robust real-time metering and network monitoring system.
Systemic issues require innovative and scalable solutions. The ongoing smart metering drives under the RDSS present a significant opportunity for discoms in UP and other states to reduce their losses. Smart prepaid meters, with good infrastructure to support them, can help improve billing efficiency and ensure timely revenue collection (Agrawal, Mani, Ganesan, et al. 2020; Agrawal, Mani, Kalra, et al. 2023). Following our assessments, the discom initiated smart metering in the concerned feeder. As of 31 August 2025, nearly half the consumers served by the feeder have smart meters installed.
However, the success of smart metering initiatives will depend on conducting robust consumer indexing, judiciously deploying strategies with frequent consumer engagement, enhancing the capacity of discom staff across levels, and upgrading the distribution network. In the next subsection, we present our recommendations for discoms to address the key factors underpinning distribution losses in UP and other states.
Ensure robust consumer indexing and energy auditing across all feeders
The Bureau of Energy Efficiency (Manner and Intervals for Conduct of Energy Audit in Electricity Distribution Companies) Regulations, 2021 mandate discoms to submit both quarterly and annual energy audit reports. However, very few audit reports are publicly available. Further, the audit report from a UP discom highlights gaps in consumer indexing as a systemic challenge underpinning the high losses across many feeders (MVVNL 2024).
Consumer indexing before smart meter installation is also mandatory under the RDSS, and must be pursued diligently to ensure the success of smart meters. However, our immersive research shows that correct consumer indexing requires the direct involvement of field staff and a system to periodically update the indexing. Discoms must leverage digital tools (instead of manual registers) and third-party audits to maintain a reliable and updated record of their consumers. Further, end-to-end and time-bound consumer and DT metering in every feeder is critical to enable energy auditing and accounting. Additionally, as the audit report suggests, there is a need to build the capacity of the audit cell and the IT team to allow for accurate, division-wise energy audits (MVVNL 2024).
Prioritise smart metering in feeders and subdivisions with high distribution losses
Commercial factors accounted for most of the losses in the studied feeder. Despite the efforts of the sub division staff, meter readers continued to generate bills without visiting the consumer’s premises; the reasons for this were flexibility of the billing software, limited ground-level vigilance, and socio-political factors. Technological interventions such as smart metering is essential in such circumstances. Discoms should prioritise smart metering in high loss areas, as they can help ensure timely and accurate billing, early redressal of metering issues, and targeted detection of electricity pilferage. This approach would help discoms reduce losses in a targeted manner and ensure short payback periods on initial smart meter investments. This, in turn, would bolster the confidence of discom staff and regulators in this new technology and facilitate a rapid scale-up.
Educate consumers about the benefits of smart meters and timely bill payment
Areas with high provisional billing or under-billing are likely to witness consumer resistance to smart metering drives. When consumers with lower bill amounts due to under-billing switch to smart meters (which will accurately record their consumption levels), they will experience a rise in electricity dues. This would create a negative perception among consumers about smart meters. Discoms must pre-empt such issues by raising consumer awareness and rolling out engagement drives well before deploying smart meters. Discoms could also retain the old meters along with smart meters for a few months to instil confidence in consumers about the technology.
Enhance the capacity of discom staff in technology use and data analytics
With the ongoing smart meter rollout, discoms have the opportunity to use technology and digital portals for system monitoring, vigilance drives, and quick grievance resolution. The discom management should ensure that all discom officials, particularly the field staff, get intensive and frequent training in the new technology; this is needed for the competent use of digital tools and portals, such as smart meter dashboards, GIS tools, and portals for DT-level data. The discom should also develop adequate institutional capabilities in data analytics to utilise the smart meter data efficiently and generate actionable field insights. Discoms can use budgets available for training under the RDSS to build such capabilities.
Invest in network upgrades to reduce energy losses and detect pilferage
Our assessment attributes one-third of the distribution losses to technical factors, including low HT–LT ratio, ageing conductors, overloaded transformers, and large inductive loads. A state-wide assessment of such issues is needed to plan, procure, and deploy asset and network upgrades. The UP discoms’ proposed project for replacing bare and aged conductors with AB cables has already been approved under the RDSS. Discoms must also prioritise feeder segregation for effective management of agricultural loads and deploy adequate capacitor banks and other innovative strategies for reactive power management during peak periods of agricultural demand.
Our study findings are highly relevant to other discoms in the region, or in other geographies, facing similar challenges. We emphasise that no single intervention can resolve all the challenges faced by the sector. Instead, a comprehensive approach combining policy reforms, technology adoption, and capacity building at the ground level is essential to ensure the operational turnaround of the feeder.
Discoms are the central link in the electricity supply chain. Their financial turnaround is fundamental to achieving the policy objective of providing uninterrupted 24×7 electricity supply to all consumers. A financially healthy utility is better positioned to invest in infrastructure upgrades and support India's clean energy transition. Furthermore, improving financial viability reduces the need for expensive short-term credit to cover revenue shortfalls, which is crucial for maintaining affordable power for consumers.
Smart meters are essential for plugging energy leakages caused by inaccurate billing, which the study identified as a major driver of losses. By automating data collection, smart meters ensure timely and accurate billing, eliminating the issue of human interference in the billing process. They also enable the targeted detection of electricity pilferage and allow for early redressal of metering issues. Prioritising smart meters in high-loss areas can help discoms accrue quick returns on investment and improve overall billing efficiency.
The financial health and operational stability of a distribution company (discom) are intrinsically linked to consumer payment behaviour. Consistent, timely bill payments ensure a steady revenue stream, which is vital for power procurement, managing daily operations, and funding network maintenance—all necessary fora reliable, 24x7 electricity supply. Conversely, irregular payments and accumulated arrears severely strain a discom's working capital. This results in the utility incurring Late Payment Surcharges for delayed payments to generators, which can directly compromise supply reliability. To cover these shortfalls, discoms are often forced to secure high-interest loans, increasing the cost of power supply and hindering their ability to maintain quality service.
How can India Create a Demand Flexibility Market?
Contracts for Difference for Flexible and Affordable Clean Power
Enabling Corporate India's Clean Energy Transition
Scaling Solar Power for Irrigation in India: