Council on Energy, Environment and Water Integrated | International | Independent


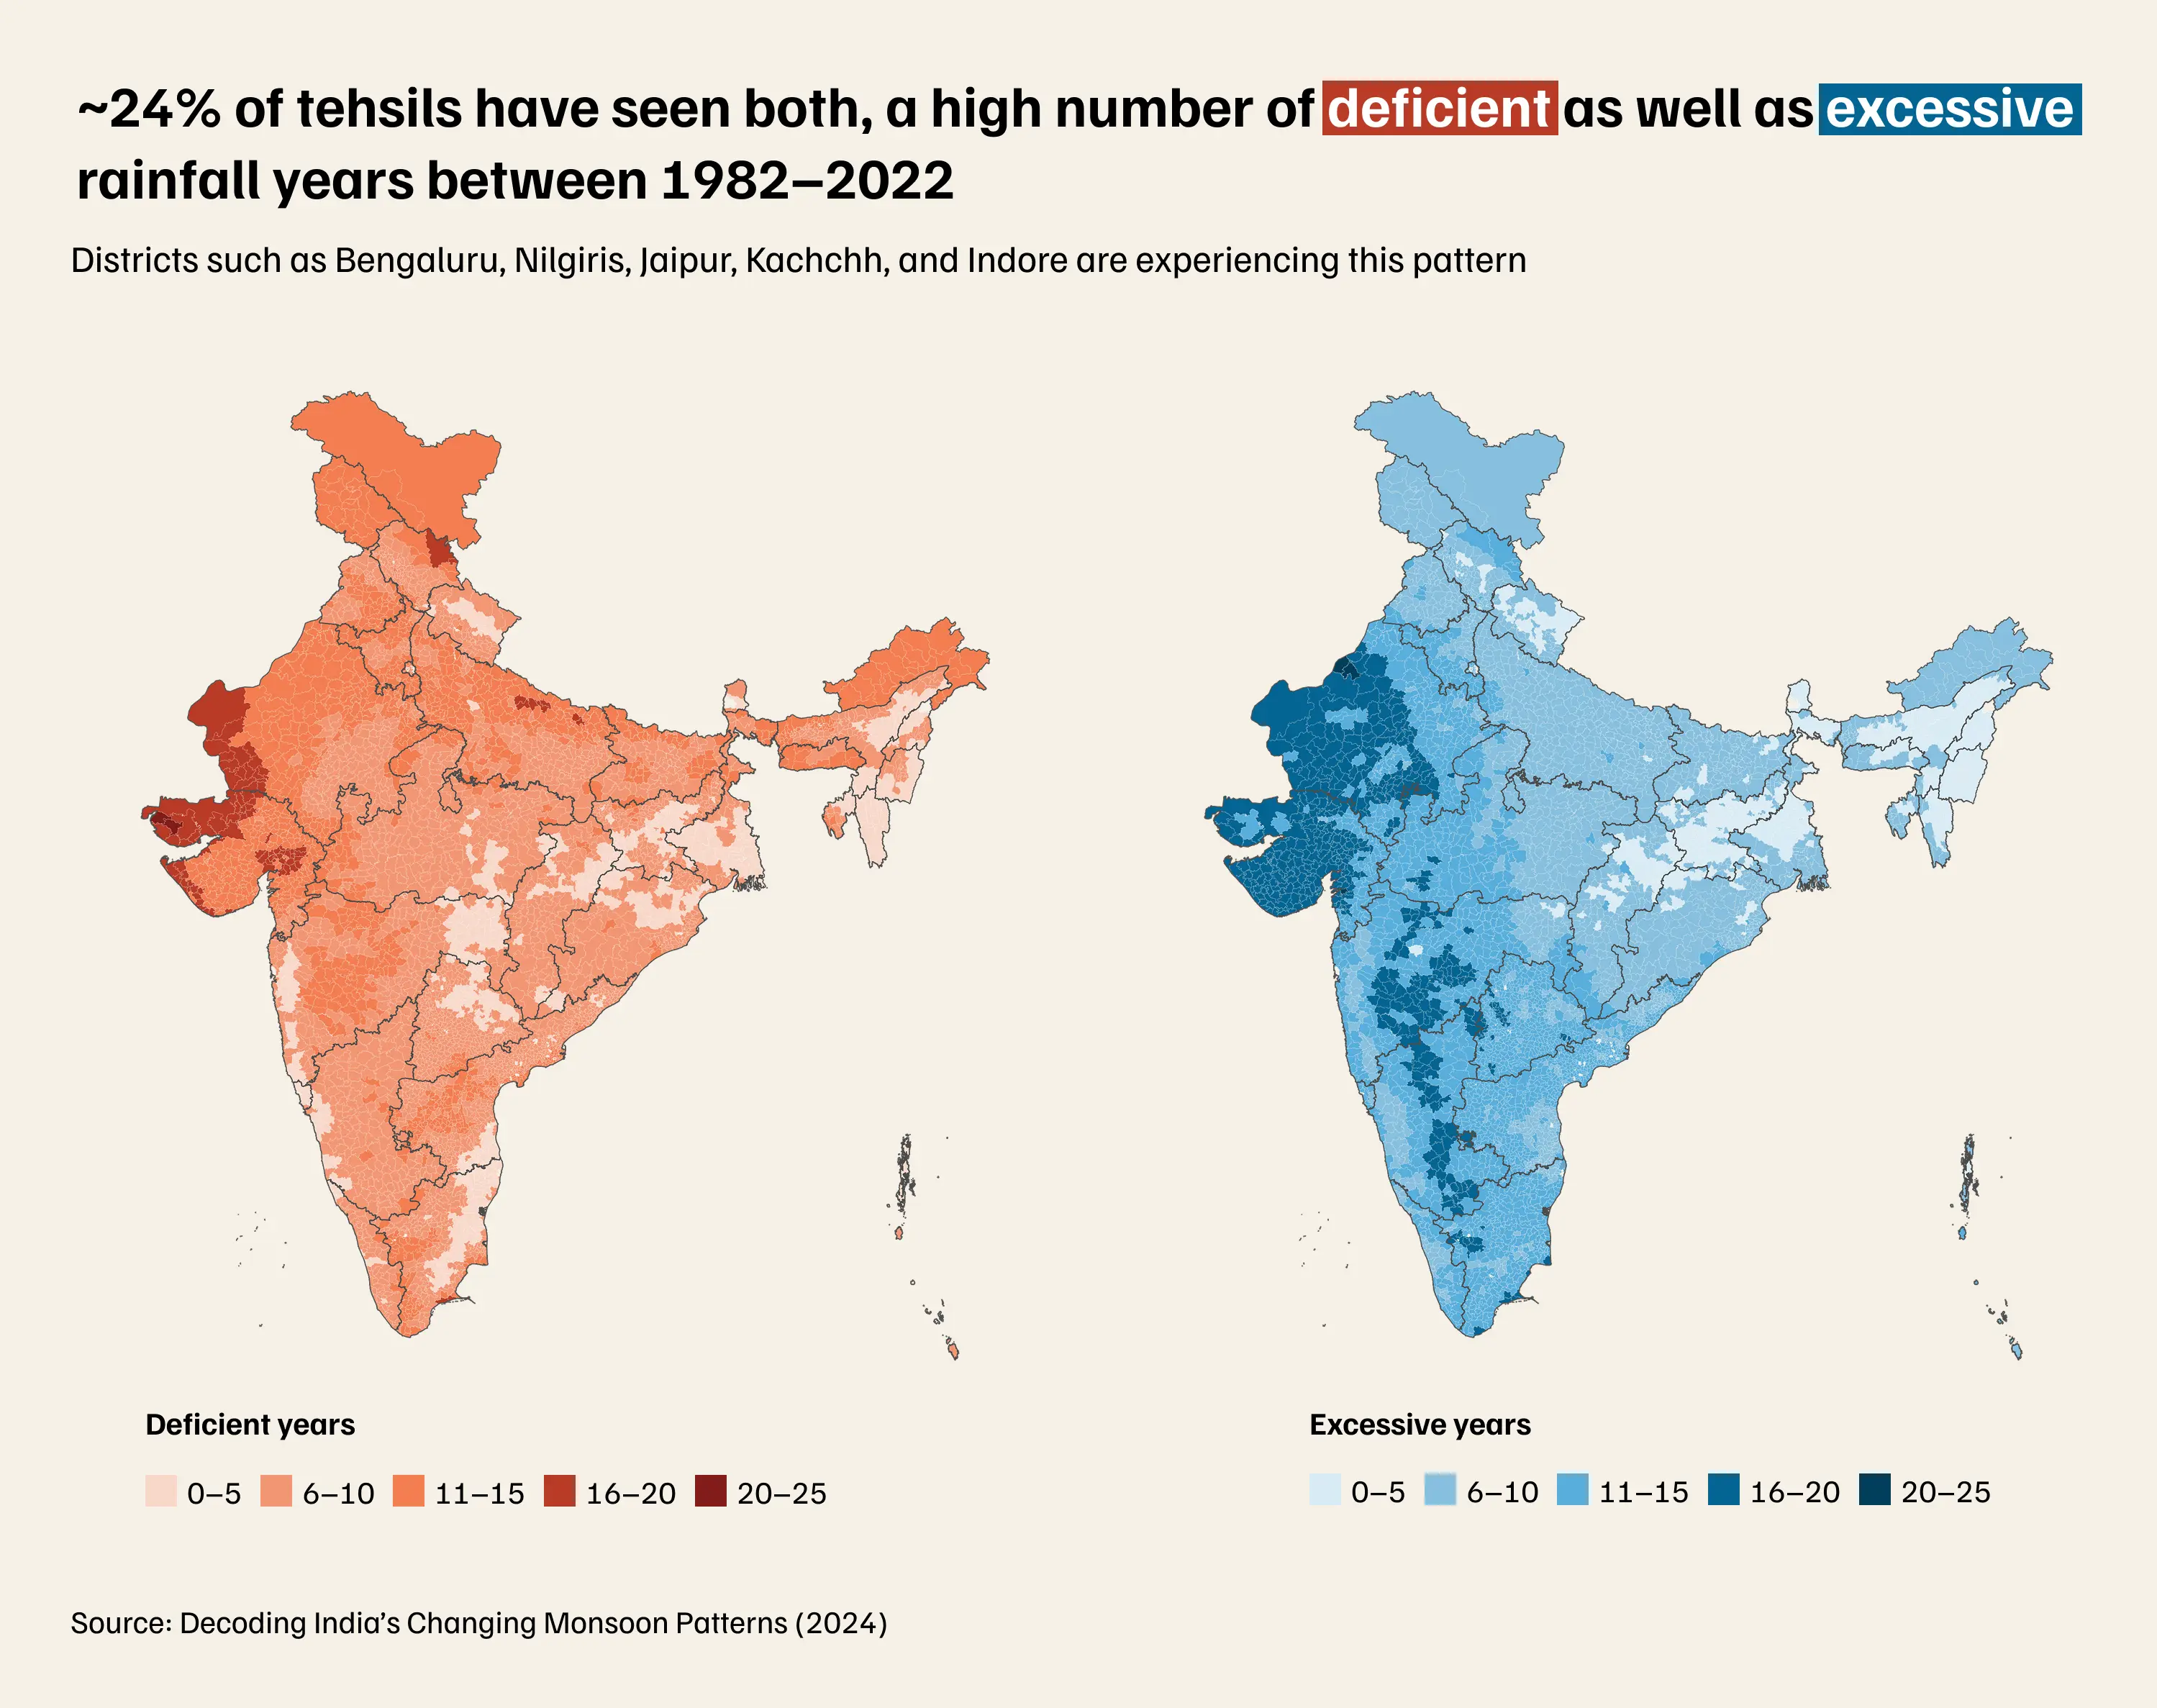
24%: of India's tehsils (sub-districts) have swung between deficient and excessive rainfall years between 1982-2012
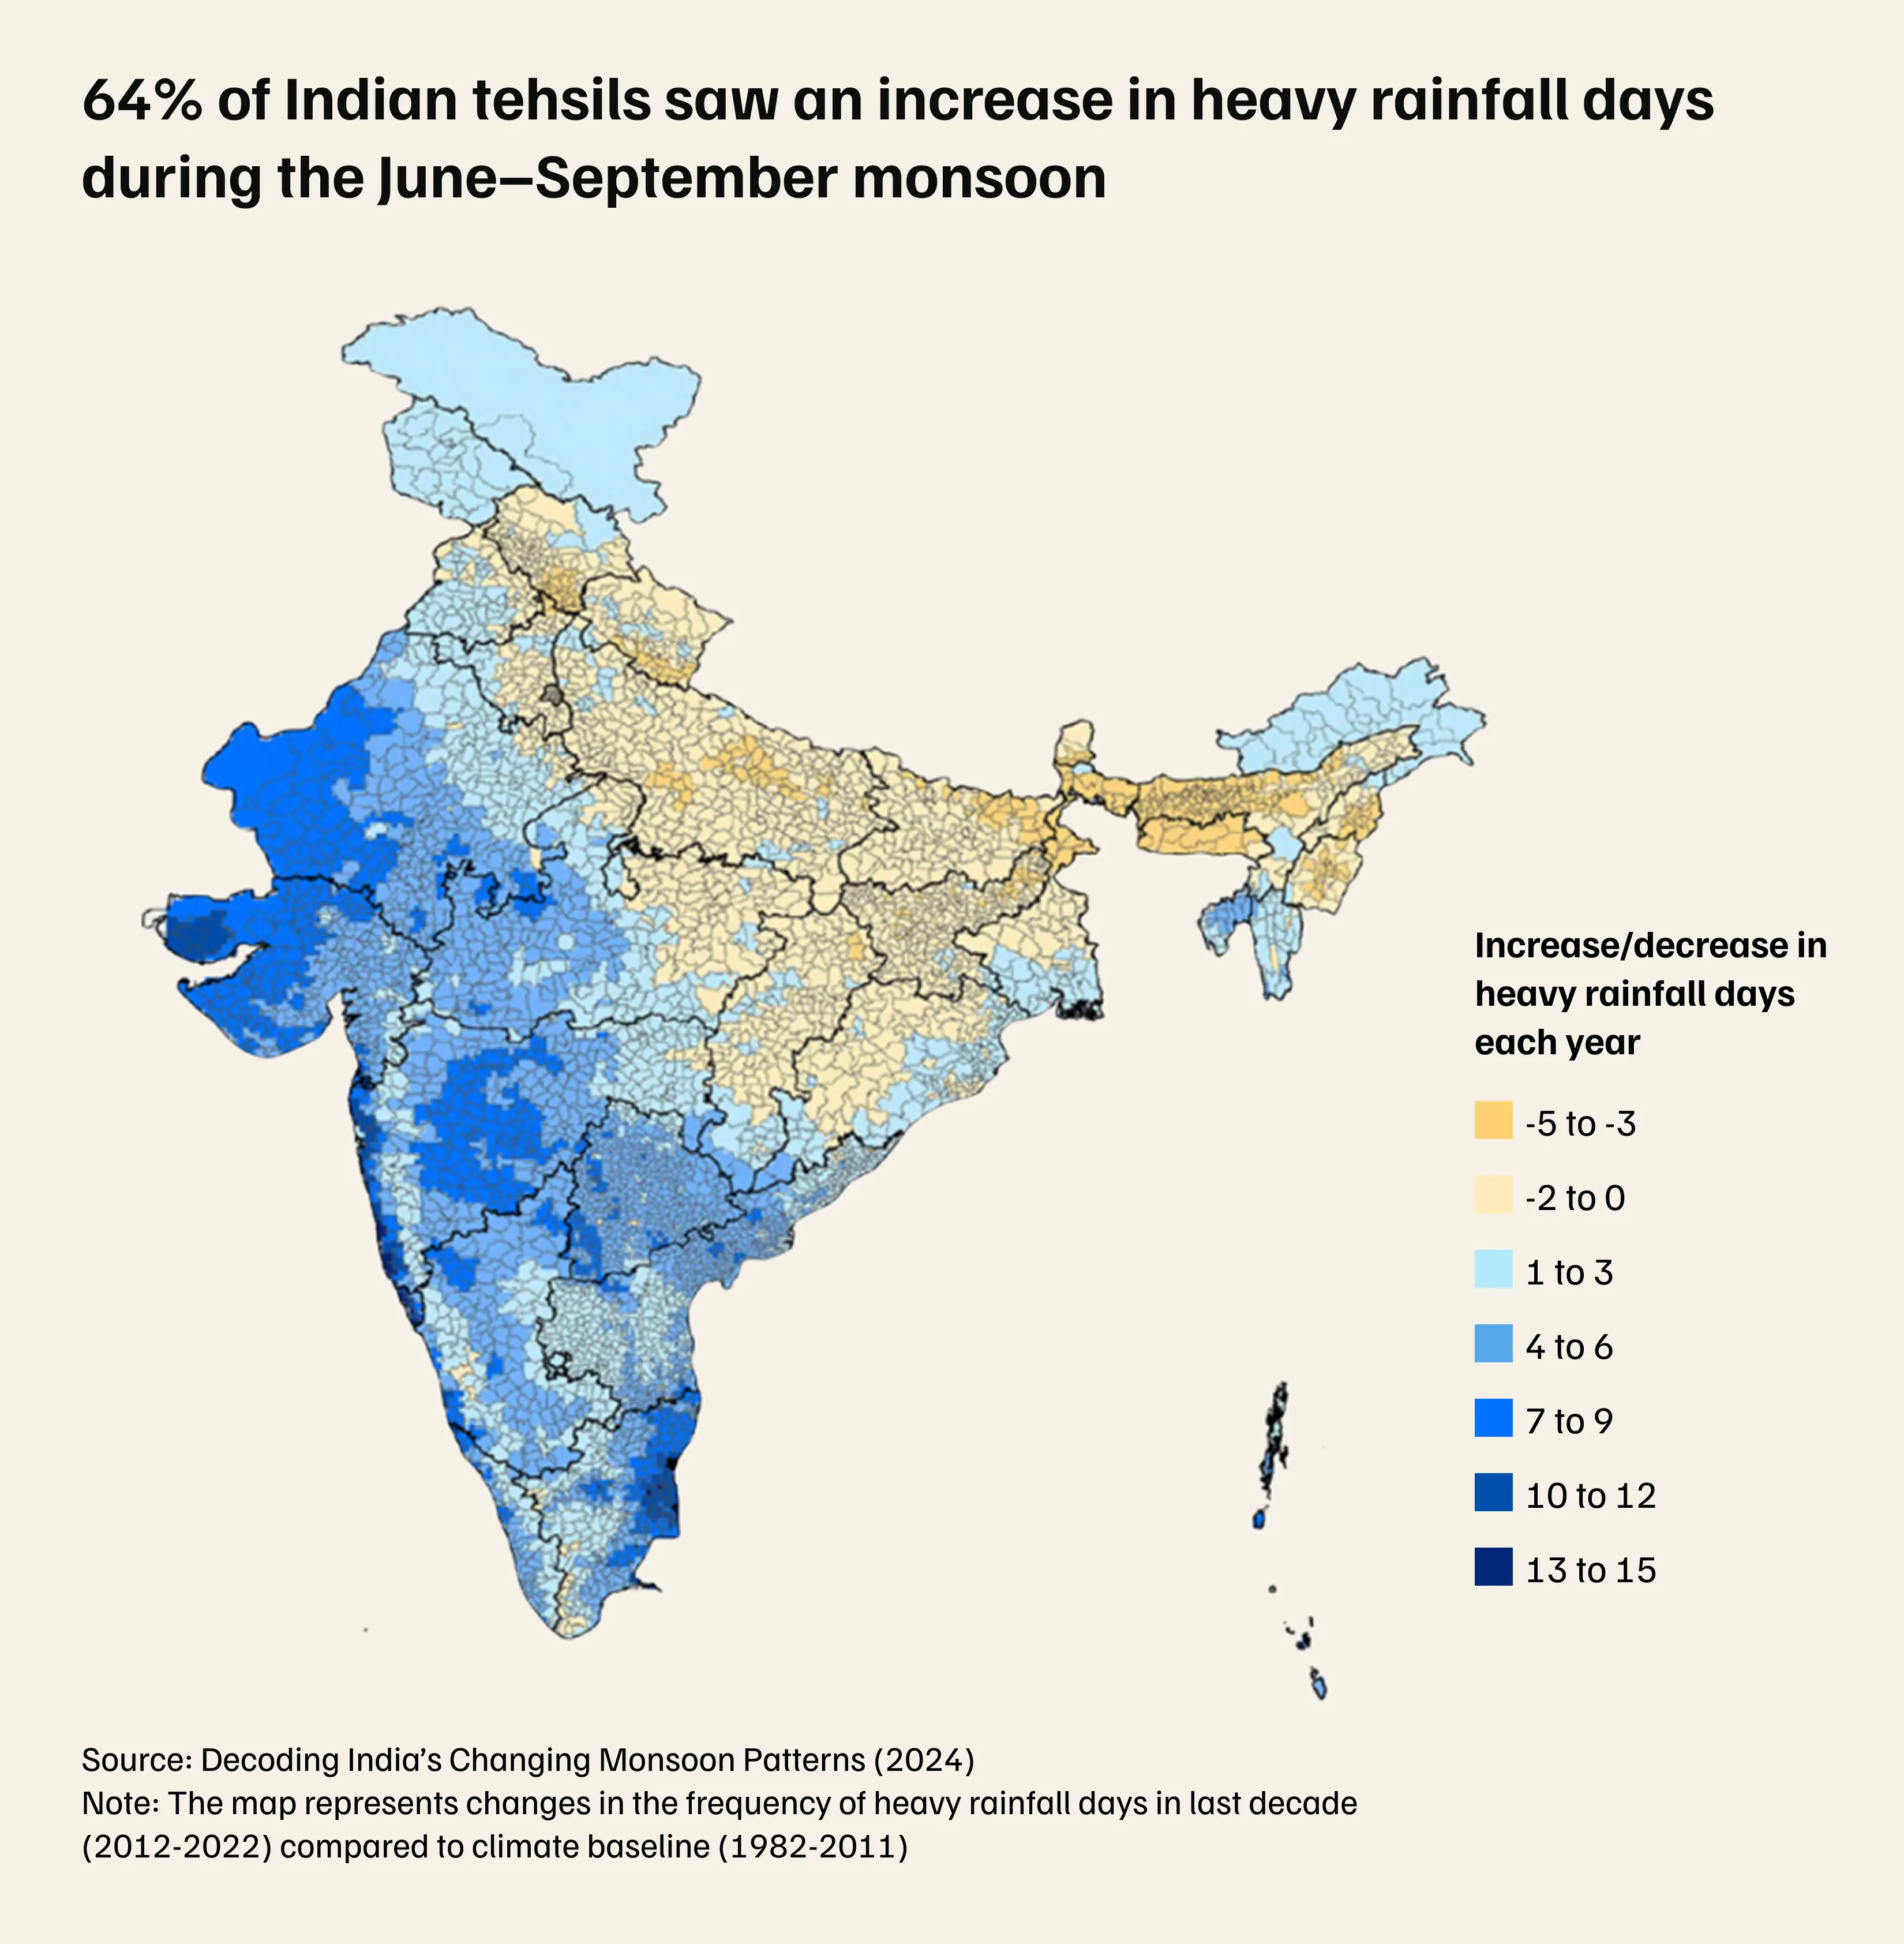
64%: of tehsils are logging more heavy-rain days every monsoon—most of the extra rain is arriving in short, intense bursts
41: Indian cities have either completed or are in the process of preparing their own City Climate Action Plans as of December 2024
Since 1982, India’s monsoon rainfall has gone up by 3mm a year. Nationally, that’s the number everyone quotes. It's also an average of ~4,500 tehsils, so it can't tell you a thing about any one of them.
So we did a tehsil-level assessment, and found that 24 per cent of them (compared to the climatic baseline of 1982–2011, per IMD data) have spent the last 40 years swinging between dry and wet years: a run of deficient years, then a run of excess-rainfall years, then back again. Marathwada, Rajasthan and Gujarat show it worst, where the same district can be under water-rationing one year and pumping floodwater out a few years later.
This is a monsoon that's stopped being predictable, and for a district planning its next harvest, unpredictable is worse than either extreme on its own.
The bigger change isn't how much rain falls each season, but its shape: rain that once spread across the monsoon season is increasingly arriving in short-duration, heavy bursts. Nearly 64% of Indian tehsils have experienced 1 to 15 additional heavy-rainfall days per year between 2012-2022. This can be attributed to the accelerating rate of climate change.
Most cities are still running on drainage systems designed decades ago, for a different frequency and intensity of rainfall—usually 12-20 mm of rain per hour. Delhi relied heavily on a drainage blueprint drafted in 1976, until the new Delhi Drainage Master Plan was launched in September last year. Mumbai’s underground stormwater drainage system dates back to the British era, designed to handle just 25 mm of rain per hour. Brihanmumbai Municipal Corporation has announced an integrated flood mitigation master plan to handle up to 120mm of rain per hour, in the ongoing Assembly session.
A majority were not built to carry the volume that now falls in a few hours. That mismatch is exactly what turns a heavy monsoon day into a flooded street, and why urban flood risk is something every city needs to plan for.
As of December 2024, around 41 Indian cities had either completed or were preparing their own City Climate Action Plans under the National Mission on Sustainable Habitat—an attempt to do at the city scale what the tehsil data above is demanding everywhere: stop trusting the average, and start mapping the ground.
Coastal cities are especially vulnerable to sudden and extreme storms and floods, as they are mostly located in low lying areas, and storm events combined with high tides make water evacuation difficult. Navsari in Gujarat is one such coastal city that regularly experiences recurrent floods. In July 2024, a single storm put nearly a fifth of the city underwater. Navsari Municipal Corporation and CEEW mapped the city’s flood risk ward by ward using 55 years of daily rainfall data, and indicators on hazard, exposure, and vulnerability. We found the danger was not evenly spread. Some wards could take an ordinary monsoon in their stride; others, a few streets away, could not.
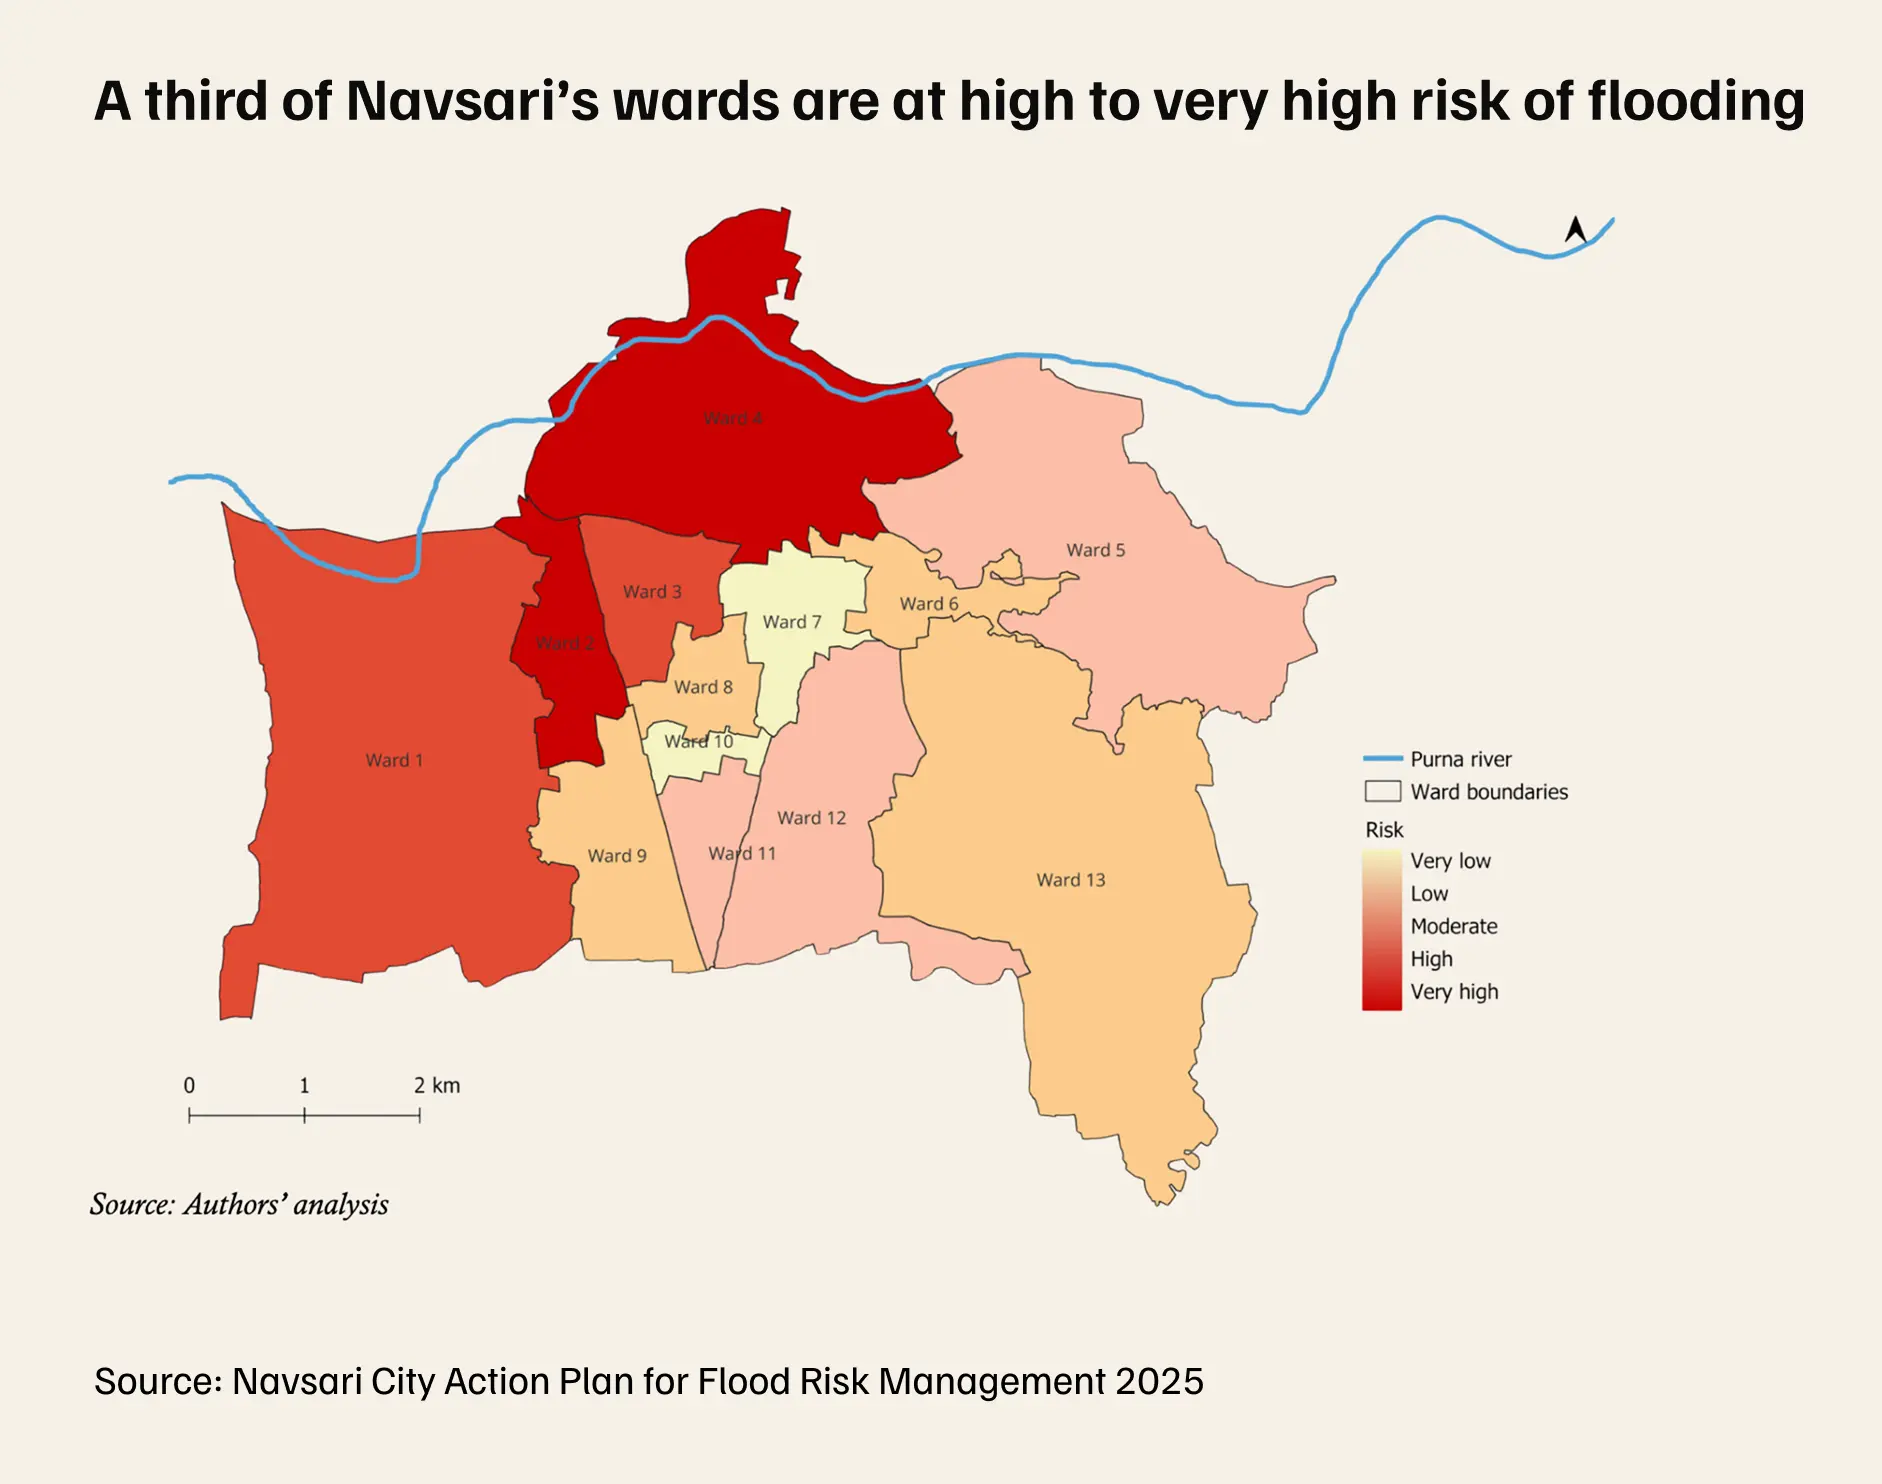
This map is now the starting point of the city's new plan: fix the worst-off wards first, rather than spread a fixed budget evenly across a risk that was never even to begin with. We’re now extending the same approach to Ahmedabad and further examining urban flooding patterns in Delhi, Gurugram, Bengaluru, and Cuttack.
It's the same lesson at every scale, from the country down to a single ward: the average is comforting, and it's the wrong place to plan from. Local data is what makes a city's preparedness real.
Has your city's monsoon flooding gotten worse in your lifetime?
Written by: Shreya Kapoor
Research by: Vishwas Chitale, Shravan Prabhu, Nitin Bassi, Karthikey Chaturvedi, Pratha Mishra
Charts by: Poojil Tiwari
Scroll into UpChart, our data-focused LinkedIn emailer that connects dots










Add new comment