Council on Energy, Environment and Water Integrated | International | Independent
Construction and demolition waste (C&D waste) recycling is the recovery of materials from the waste consisting of building materials, debris, and rubble, resulting from the construction, re-modeling, repair, and demolition of any civil structures (CPCB 2016). The state of Odisha generated 455 tonnes per day (TPD) of C&D waste in 2022-23 (OSPCB 2023). Odisha has limited C&D waste recycling facilities (Forest, Environment & Climate Change Department 2023); most of the C&D waste is either used for filling low-lying areas or disposed of in solid waste dumpsites (OSPCB 2023), leading to no resource recovery. Recycling C&D waste is critical to recovering recyclable materials, thereby reducing the burden on and demand for virgin construction materials.
Jobs overview
● A total of 2,000 direct full-time equivalent jobs can be generated through recycling 3,000 kilo tonnes of cumulative C&D waste generated in Odisha during 2024-2030. These estimates are based on an ambitious scenario, which assumes that Odisha will reach a C&D waste recycling rate of 100 per cent by 2030.
Market Opportunity
● 10 million USD is the revenue potential for Odisha from recycling 1,000 4 kilo tonnes of C&D waste in 2030 in the ambitious scenario.
Investment Opportunity
● 10 million USD is the investment potential 5 (capital expenditure except the cost of land) to set up the recycling capacities of 1,000 kilo tonnes per annum in Odisha under the ambitious scenario.
Annexure I contains the detailed methodology.
● Reduced dependency on virgin materials: The annual consumption of construction materials in India, such as stone aggregates, is estimated at 2 billion tonnes and 750 million tonnes of sand (Niti Aayog 2018). It is projected that the demand for sand will be 1,567 million tonnes by 2025 (Prakash Chandar and Loganathan 2022). Sand is the second most exploited natural resource in the world, after water (European Commission 2023). It faces issues of supply and prices due to the ban on mining river sand during specific periods (PIB 2023) and the hike in prices of manufactured sand (Jaisankar 2023). Sand was also being imported to the country earlier to meet the demand (Roychowdhury, Somvanshi, and Verma 2020). In this context, recycled C&D waste materials, such as sand, recycled aggregates, and concrete, could reduce reliance on virgin materials and minimise the related ecological impact due to their extraction and mining. With policies such as the Odisha Rural-Urban Transition Policy being notified, where Odisha plans to provide amenities and infrastructure to the fast-growing rural and peri-urban areas, a part of the demand for construction materials can be met through recycled materials.
● Avoiding greenhouse gas emissions (GHG) and environmental degradation: Some studies suggest that recycled coarse aggregates produced from C&D waste generate up to 65 per cent less GHG emissions compared to natural coarse aggregates (Hossain et al. 2016). Further, the use of recycled materials, when produced closer to construction sites for consumption, reduces the carbon footprint of transporting natural aggregates and related costs. Proper C&D waste management will also help mitigate air pollution by abating the usual generation of dust particles from unmanaged or dumped C&D waste, which is one of the major sources of local air pollution (CPCB 2017).
● Improving land availability: C&D waste is bulky in nature and is generally deposited on identified sites or dumped in low-lying areas or roadside or in landfills. Land is a scarce resource needed for practically all plausible activities. Proper C&D waste management will allow land parcels to be used for necessary purposes and improve local aesthetics (Purchase et al. 2021). Additionally, landfills in India are already operating at or exceeding their capacity. Recycling C&D waste will divert it from landfills and free the area for disposing of solid inert waste from which no resources can be recovered (Jain, Singhal, and Kumar Jain 2019).
New Delhi’s C&D waste recycling plant 7 Burari, which was India's largest plant, had a processing capacity of 2,000 TPD (Roychowdhury, Somvanshi, and Verma 2020). It was a public-private partnership between the North Delhi Municipal Corporation (NDMC) and Indo Enviro Integrated Solutions Private Limited (IEISL). NDMC provided the land while IEISL was responsible for building and operating the plant (Biswas et al. 2021). It was an integrated plant with machinery for wet and dry processing. It produced ready-mix concrete, hollow bricks, pavement blocks, kerbstones, concrete bricks, and sand. Initially, due to the prior poor uptake of recycled C&D materials, the Delhi government had to mandate the use of recycled products in government and municipal contracts to build confidence and encourage usage of such materials (Roychowdhury, Sareen, and Singh 2023). The plant has supplied over 1.8 million recycled C&D blocks for the construction of the Supreme Court Extension (Roychowdhury, Somvanshi, and Verma 2020).
1. Role of departments:
● Local bodies play a key role in setting up and scaling C&D waste recycling. Some of the key responsibilities for local bodies to scale the C&D waste recycling include:
- Conducting baseline assessment to assess existing infrastructure, estimating waste generation and composition, and future projections. This information is critical for waste management planning.
- Depending on the baseline assessment and the mapped areas of C&D waste generation, identifying or expanding intermediate C&D waste collection points or debris sites and the vehicles required for transportation. For example, the erstwhile North Delhi Municipal Corporation had designated collection points in every ward, which increased waste collection and optimised the trips to the centralised processing facility (Roychowdhury, Sareen, and Singh 2023).
- Issuing tenders for C&D waste recyclers to set up and operate recycling plants as per the current and projected requirements. In parallel, identifying land for setting up the plant, in compliance with C&D Waste Management Rules, 2016 (C&D Rules) (Niti Aayog 2018). Identifying sustainable and economically viable business models for recyclers through assessment mechanisms such as feasibility studies. For instance, these may include local bodies waiving off the profit sharing or fees from the recyclers on the sale of recycled products (Niti Aayog 2018).
- Tying up smaller local bodies with bigger ones to channel their C&D waste to their recycling facility or collectively forming clusters to set up combined C&D waste recycling plants.
- Organising interactive awareness campaigns for the general public, developers, and bulk generators 8 on their duties and promotion of recycled products.
- Building the capacities of the municipal staff, such as sanitary officers and inspectors, facilitating C&D waste management, organising field visits to cities and facilities where best practices are being adopted, and implementing demonstration exercises. The above actions to be undertaken collectively to avoid a fragmented and inefficient approach (Roychowdhury, Sareen, and Singh 2023).
- Compliance verification with C&D Rules and the respective waste management plans of the bulk generators by the local development authority.
● The Housing and Urban Development Department (H&UDD) to issue and notify the state policy on C&D waste as required under the C&D Rules. Minimum procurement and use of recycled materials by the local bodies, authorities, and government departments in their construction (Government of NCT of Delhi 2016) and in implementing schemes such as Pradhan Mantri Awas Yojana and Swachh Bharat Mission infrastructure to be mandated. A C&D waste recycling facility should be piloted with provisions of a minimum offtake of recycled materials. Further, this data should be made public to encourage recyclers to view Odisha as a potential destination for setting up recycling facilities. In addition, specific incentives under the Odisha Development Authorities (Planning and Building Standards) Rules, 2020 to be set out for buildings that have green rating certificates such as the Green Rating for Integrated Habitat Assessment (GRIHA), Indian Green Building Council (IGBC), etc.
● The Odisha State Pollution Control Board (OSPCB) to issue directions as and when required for effective implementation of the C&D Rules, as mismanaged C&D waste has several environmental effects including air pollution (DPCC 2018). Regular inspections and monitoring of the C&D waste management facilities must be undertaken to ensure compliance with the C&D Rules, dust pollution control measures, terms of authorisation, among others.
● The Works Department, Odisha to mandate the use of minimum recycled C&D waste products, preferably locally procured, in accordance with the standards set out by the Bureau of Indian Standards (BIS) in building construction, road works, etc., and include recycled materials and products in the schedule of rates for construction materials.
● Government agencies, which may be bulk generators such as the Works Department, city development authorities, public sector utility companies, etc., to tie up either with the local bodies for C&D waste recycling or develop in-situ mechanisms and use recycled materials as mandated, in accordance with the BIS requirements. This utilisation should be on a regular basis and not only in a few selected projects. This uptake will build confidence in the private sector to use recycled materials for construction purposes.
● The local traffic police ensure that the vehicles transporting C&D waste are covered to avoid dust pollution and also conduct random checks if authorised vehicles are carrying the C&D waste (Roychowdhury, Sareen, and Singh 2023).
● The Bureau of Indian Standards (BIS) to regularly update existing standards are for using recycled C&D waste based on changing construction practices and materials. BIS to provide specifications for testing the waste and the products as may be necessary. Additionally, standards to be created to allow for more proportional use of recycled materials based on verified research and development.
2. Role of the private sector:
● Industry associations such as the Confederation of Real Estate Developers' Associations of India (CREDAI) take the responsibility of facilitating the adoption of more sustainable construction practices in the construction industry. They should identify challenges from the construction industry in using recycled materials and disseminate successful examples and best practices to create awareness around the same.
● Builders and developers play the most critical role in managing waste and becoming market linkages for recycled materials. Builders and developers that are bulk generators can reuse C&D waste generated on their sites to minimise waste generation and either tie up with local bodies or set up their own recycling mechanism depending on the quantum of waste generated.
● Recyclers collaborate with industry associations and conduct sessions and demonstrations to address doubts and queries about the durability and functionality of recycled materials.
● Green building rating systems such as GRIHA and IGBC to raise awareness of government incentives for obtaining green ratings for construction.
● Private stakeholders such as manufacturers of construction materials or recyclers of C&D waste to extend grants to academic institutions or funding for research and development of technology and recycling processes, as well as products made from recycled C&D waste that function close to their natural counterparts.
● Supply chain challenges and lack of consumer awareness: There is low awareness among the waste generators on the authorised manner of depositing C&D waste. While the Swachh Bharat Mission, with its robust awareness campaigns, has made people aware of solid waste management, C&D waste management lags behind on that front. The lack of awareness is one of the major reasons formal recyclers face supply chain issues since the waste generators then unintentionally give the waste to the informal sector. The informal players collect the waste in exchange for a fee and dump the waste in dump sites or vacant plots or fill low-lying areas again in exchange for money. This is despite the fact that in many jurisdictions, small waste generators are not required to pay fees for the collection and transportation of C&D waste to encourage them to deposit the waste. Moreover, bulk generators are required to pay for C&D waste management under the C&D Rules. However, many bulk generators dump the waste at unauthorised points or dumpsites or landfills to avoid such costs. In such scenarios, the requisite quantity of waste does not reach the authorised C&D waste facility.
Way forward: In this context, the local bodies must undertake awareness campaigns for different stakeholders on aspects of the collection, user fees, use of recycled products and materials, penalties, reduction of illegal dumping, etc., and encourage generators to deposit waste for resource recovery. The awareness of different types of waste generators and related penalties for non-compliance should be undertaken repeatedly for effective implementation. For instance, it can be undertaken separately for builders in association with CREDAI, private waste generators, public utility service providers, etc. Field visits can also be arranged to sensitise these stakeholders on the repercussions of mismanaged waste. Odisha’s collaboration with Mission Shakti self-help groups on solid waste can be extended to awareness campaigns for C&D waste on collection and compliance requirements.
Moreover, the local bodies create a robust collection mechanism whereby waste can be collected on call or deposited into decentralised collection centres. The aggregated waste at the centre can then be channelled to the recycling facility. The vehicles should be equipped with GPS for traceability and identifying instances of dumping. There are various collection and transportation models practised by cities across the country. The local bodies in Odisha identify an effective model in their local context based on the waste generation quantum, mapping of collection points and routes and awareness levels, among others.
● Need of enforcement of regulation: Despite being notified over seven years ago, the C&D Rules have not been implemented effectively. There continues to be unauthorised collection and dumping of C&D waste and meagre collection of user fees and penalties. The non-implementation of the C&D Rules directly affects the operations of the recyclers, leading to mismanagement of waste and related environmental issues.
Way forward: The H&UDD to notify the state policy on C&D waste under the C&D Rules, setting forth broad roles and responsibilities of different stakeholders to facilitate the C&D waste management and use of recycled products. Under the policy, periodic market potential assessments from C&D waste recycling to be undertaken to showcase the market size of the state and encourage the private sector to invest in recycling facilities. The local bodies to notify the bye-laws for C&D waste clearly laying down the process of collection, transportation, storage and channelisation to the facility for processing. The bye-laws should also mention the duties of local bodies, authorised service providers, small and bulk generators, recycling facilities, etc. The user charges for collection, transportation and processing of C&D waste, at least for bulk generators, should be notified along with penalties for specific non-compliances such as unauthorized collection and dumping of waste. Moreover, a robust grievance redressal mechanism should be created and promoted where citizens can raise complaints.
Inspiration can be taken from cities such as Delhi that have made fortnightly self-audits mandatory on an online platform, where developers have to register C&D projects larger than 500 sq. m. for records and better accountability (DPCC n.d.). Similarly, there can be mechanisms set out under the Odisha Development Authorities (Planning and Building Standards) Rules, 2020 that promote transparency, such as (i) a show of proof of channelising C&D waste from demolition to an authorised facility prior to giving approval for a new building plan or (ii) compliance of C&D waste management plans submitted by bulk generators can be verified prior to issuing occupancy certificate. A common monitoring system between the sanitation department of the local body and the development authority can ensure such compliance and record keeping.
● Low uptake of recycled materials and products: Recyclers are dependent on making their revenue from the sale of recycled materials. However, generally, recycled materials are perceived to be of an inferior quality, and therefore, their market uptake remains a challenge. Further, the awareness on C&D waste recycled materials and range of products and their varied use-case is limited. Its general assumed utility is rubble for filling.
Way forward: Obtaining a recycled product certification from a recognised independent third party and listing them on product catalogues of entities such as GRIHA or GreenPro Ecolabel will improve market acceptability and exposure (Niti Aayog 2018).
The C&D Rules require procurement of materials made from C&D waste to be made mandatory, up to an extent, in government contracts. For ease in market uptake, recycled C&D material and products with potentially better uptake in the local context to be identified by the state and promoted pertaining to its use case. The state departments, Works Department and local bodies mandate use of minimum recycled C&D waste products in building construction, road works, etc., as may be apt in the local context. The clauses of C&D waste management and minimum use of recycled materials to be included in their construction contracts. This will not only increase uptake in the public sector but also provide private parties the confidence to use such products. For instance, the Delhi Public Works Department has issued an advisory to all government departments to incorporate clauses in tenders that mandate the use of 2 and 10 per cent of recycled materials in buildings and road works, respectively (Government of NCT of Delhi 2018). In addition, targets for the off-take of recycled C&D materials can be set out for different departments and local bodies (National Green Tribunal 2019; DPCC 2022). For instance, the construction of toilets under the Swachh Bharat Mission with minimum use of recycled C&D waste materials can be mandated with specified design and quality control.
Further, the state provides incentives and encourages builders to rate their buildings through building rating certifications. IGBC has criteria for green procurement of construction materials and products (including those made from C&D waste) and recycling of C&D waste generated. In order to encourage rating systems like IGBC, several state governments have provided incentives such as an additional 10 per cent floor area ratio (FAR) for rated projects (IGBC n.d.). This also helps incentivise uptake of recycled materials.
● Environmental risks: Risks include air and land pollution due to unauthorised collection (Masrath 2023) and dumping of waste. The local bodies ensure that the collection and transportation agencies and recycling facilities regularly comply with their contractual obligations and conditions of registration. In instances of unauthorised collection and dumping, penalties should be imposed, and enforcement should be stringent.
The scope of the C&D waste recycling value chain is limited to jobs generated from recycling operations that include partial transportation of waste to recycling plants, 10 and different stages of recycling such as screening, sorting, and recycling of C&D waste, along with its storage and utilisation of recycled materials to produce products. These jobs are created at or by a recycling plant.
The activities before recycling, including primary collection from construction sites and aggregation of C&D waste, are not included in the scope of the current analysis due to data unavailability. The scope excludes corporate functions of the recyclers, such as accounts, human resources, legal, etc., and ancillary activities related to insurance, banking, chartered accountants, etc. These functions are not directly linked to the operational capacity of the recycler. Hence, only direct jobs from recycling operations are estimated in this analysis.
● Direct jobs are converted to a full-time equivalent (FTE). The full-time equivalent or job year is defined as simply a ratio of the time spent by an employee on a particular task/project in a given year to the standard total working hours in that particular year. The FTE formula translates short-term or one-time employment into a full-time equivalent or job-year (Tyagi et al. 2022).
● In this analysis, FTE for recycling operations is the number of workers engaged in the recycling operations in a year divided by the quantity of waste recycled in a year.
● Key informant interviews (KIIs) were conducted with identified players in the C&D waste recycling ecosystem in order to arrive at the FTE. The interviews focused on the number of people employed for recycling operations, challenges and risks for the ecosystem, skilling requirements, etc.
● The market opportunity is estimated as the revenue accrued by selling materials and products (made from such materials), recovered from C&D waste recycling.
● The investment opportunity refers to the capital expenditure for setting up the C&D waste recycling facilities. This includes the cost of plant and machinery
Three scenarios were developed for estimating the market, investment and employment opportunity. These are business as usual (BAU), policy, and ambitious, each having a different recycling target.
KIIs were conducted with identified players to calculate the C&D waste recycling FTE and estimate jobs.
● A mix of purposive and convenience sampling strategy was used to identify the stakeholders for KII.
● Three KIIs were conducted, representing daily recycling capacites between 300 to 1000 tonnes. However, out of these three, data from two respondents was used to calculate FTE. These two respondents provided data for five C&D waste recycling facilities. The activities performed by the respondents were partial transportation of waste to the recycling facility, storage, screening and sorting and recycling of the C&D waste along with producing products from the recycled C&D waste materials.
● Questionnaires were used to gather information and data from the respondents. The broad heads under the questionnaire included specifications of the recycling plants such as capacity, area, workers deployed for different activities, etc., and stages of recycling. There were also qualitative questions on skill requirements at different stages of recycling, risks associated with the recycling ecosystem, prevalent challenges in the ecosystem, and interventions that can potentially solve them.
Annual FTE for C&D waste recycling is computed as:
Full-time equivalent (per Kilo tonne) = Total number of worker employed for recycling operations /
Total waste recycled in the year (in kilo tonne)
Annual FTE for producing products from recycled material:
Full-time equivalent (per kilo tonne) = Total number of worker employed for producing products from recycled material /
Total recycled material made into products in the year (in Kilo tonne)
Table 1: Annual FTE calculated using data received from the KIIs
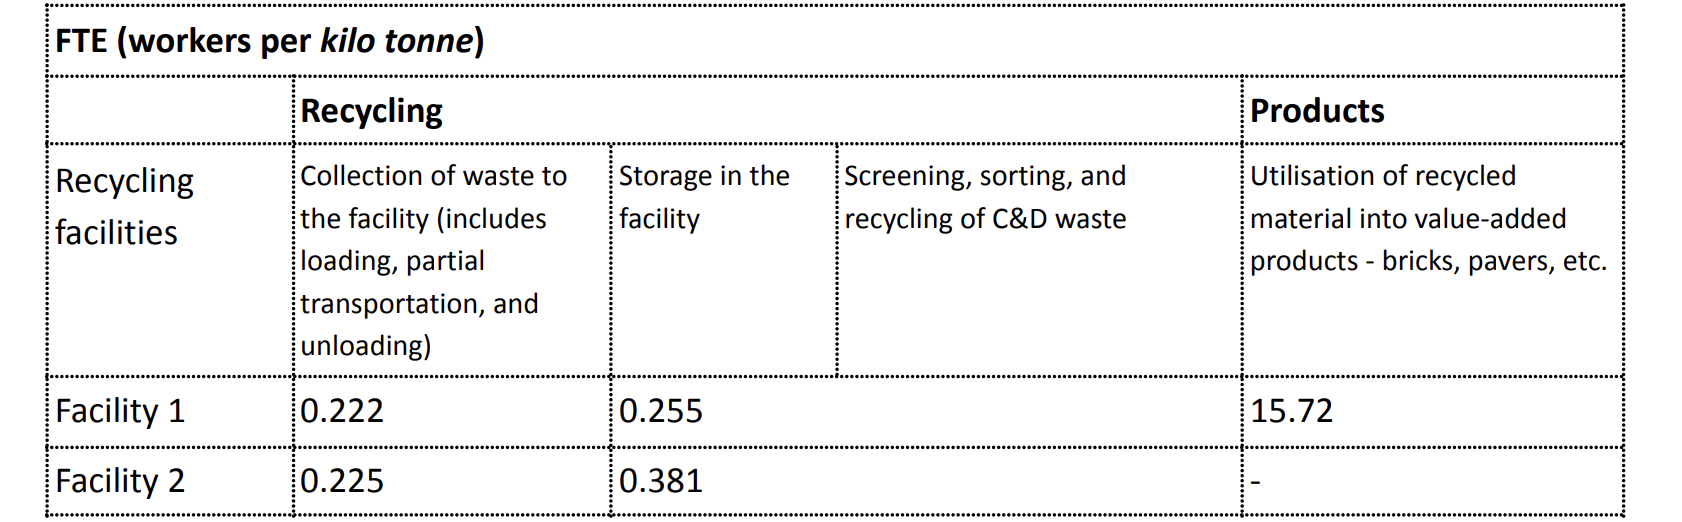

Source: Authors’ analysis based on stakeholder consultations
● It should be noted that this analysis does not consider any reduction in employment due to increased automation of various recycling operations.
The market opportunity has been estimated from the sale of recovered materials and products made from such materials. The following methodology was used to calculate the market opportunity under the three scenarios.
● First, Odisha’s C&D waste was projected till 2030. Thereafter, recycling rates under these scenarios were applied to calculate the C&D quantum to be recycled. Next, this number was multiplied with recovery rates, applicable for the chosen recycling process, to calculate the quantum of recycled materials recovered from C&D waste. Lastly, the quantum of recycled materials was multiplied with market prices to estimate the revenue from recycling. The market opportunity is, therefore, a summation of the quantum of product and price of all recoverable materials from C&D waste:
Market opportunity (USD) = { (Recovered material from C&D waste (kg) ) * (marlet price (USD/kg) ) indicates the recoverable materials from the C&D waste USD to INR = 83
● The following sections detail out these three stages:
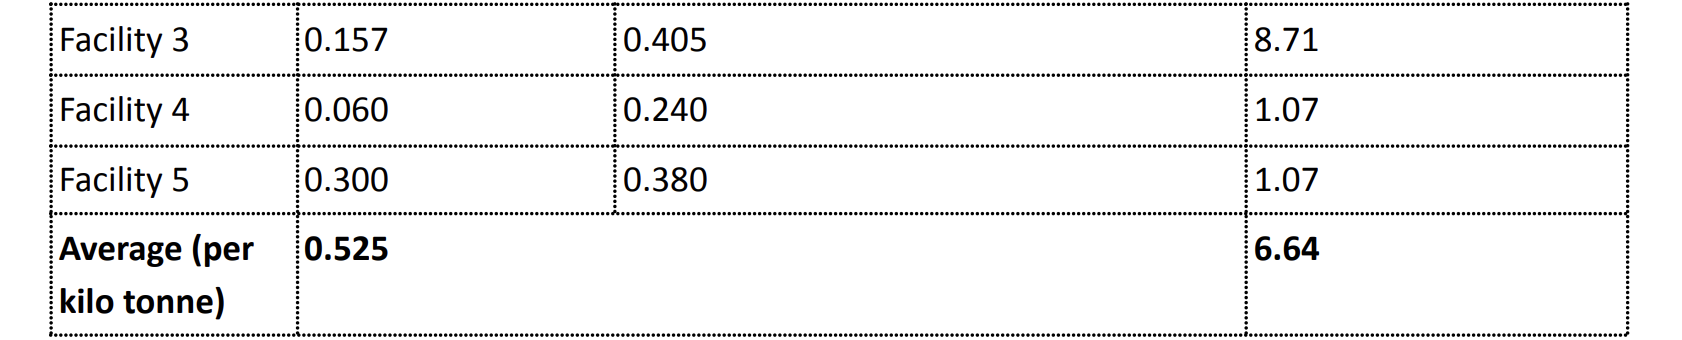
i. C&D waste generation:
The C&D waste generated in the state was calculated as a proportion of the solid waste generated therein (MoHUA 2021). The solid waste generation data was obtained from secondary sources (CAG 2022; OSPCB 2023). 10.3 per cent of the solid waste generated from 2016 to 2023 was estimated as the C&D waste generation for that period (refer to Annexure II). Using a CAGR (compound annual growth rate) on C&D waste from 2016-2023, i.e., 32.8 per cent, C&D waste was estimated from 2024-2030.
Table 2: Estimated C&D waste generation and projection till 2030
Source: Authors’ analysis based on data from CAG 2022 and OSPCB 2023
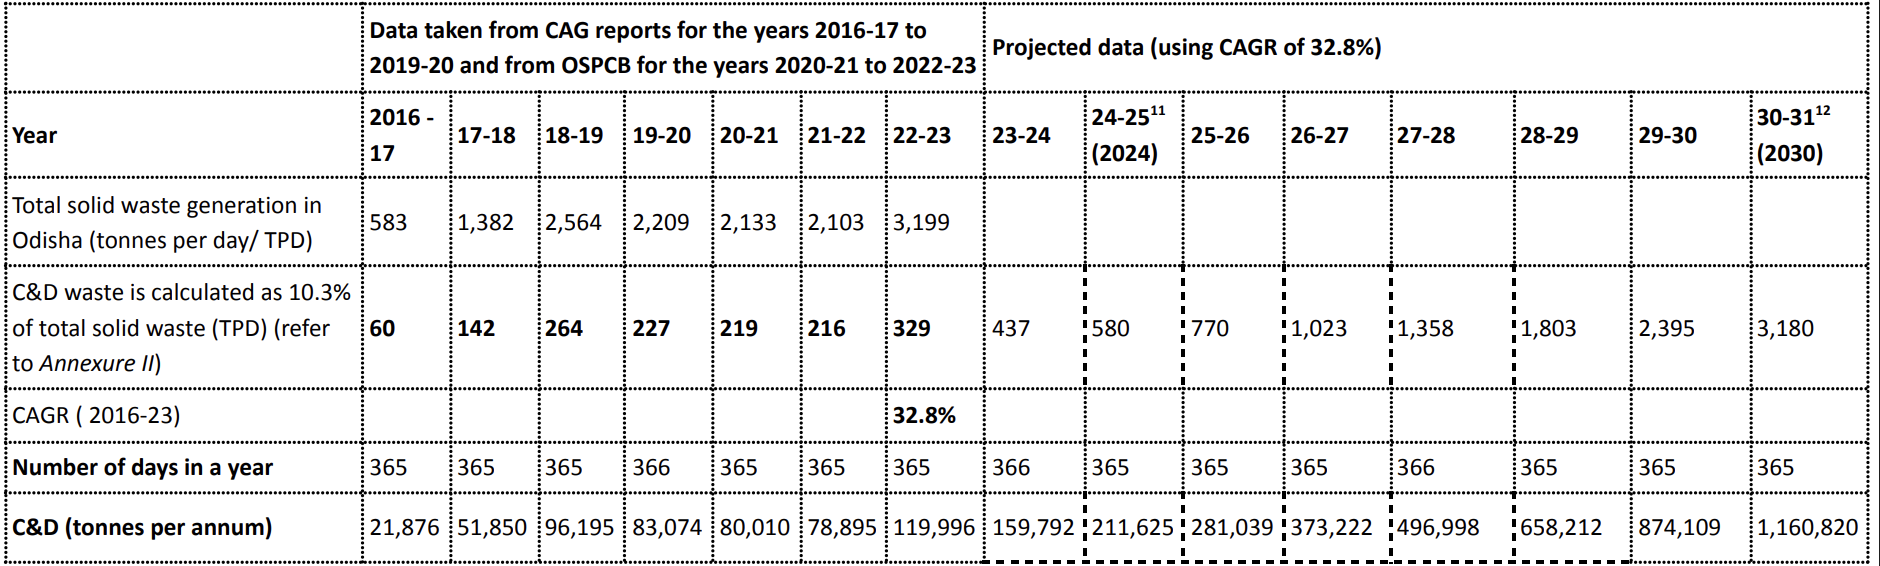
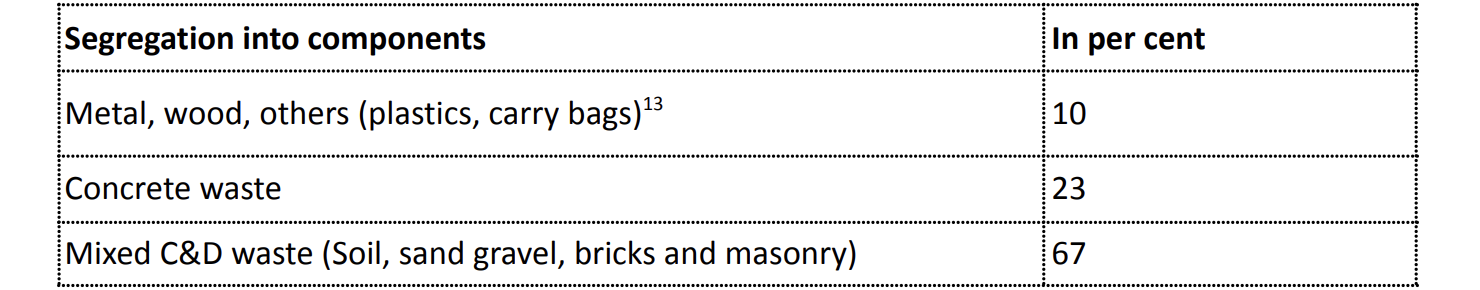
The composition of C&D waste was determined using the information provided by Technology Information, Forecasting and Assessment Council’s (TIFAC) on segregation of C&D waste. The same is shown in tables below.
Table 3: Composition of C&D waste
Source: Roychowdhury, Somvanshi, and Verma 2020
Table 4: Further categorisation of C&D waste
Source: Roychowdhury, Somvanshi, and Verma 2020 (based on the above table)
ii. Recycling and recovery rates: The recycling rates were different for each scenario and are discussed in the upcoming sections. The C&D waste to be recycled is then multiplied by the recovery rate of materials from recycling as per secondary sources and KIIs.
Table 5:C&D waste recycling recovery rate
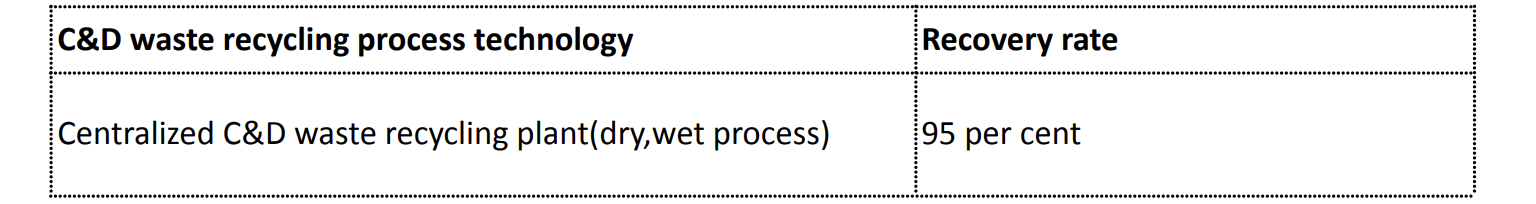
Source: Stakeholder consultations and ILFS n.d.
Post-recycling C&D waste, the following materials are recovered: recycled concrete aggregates, recycled aggregate, recycled sand, and silt or soil. The proportions of the recovered materials are based on the information received from the KIIs shown in the tables below.
Table 6: Recycled materials obtained from concrete and mixed C&D, as per KIIs
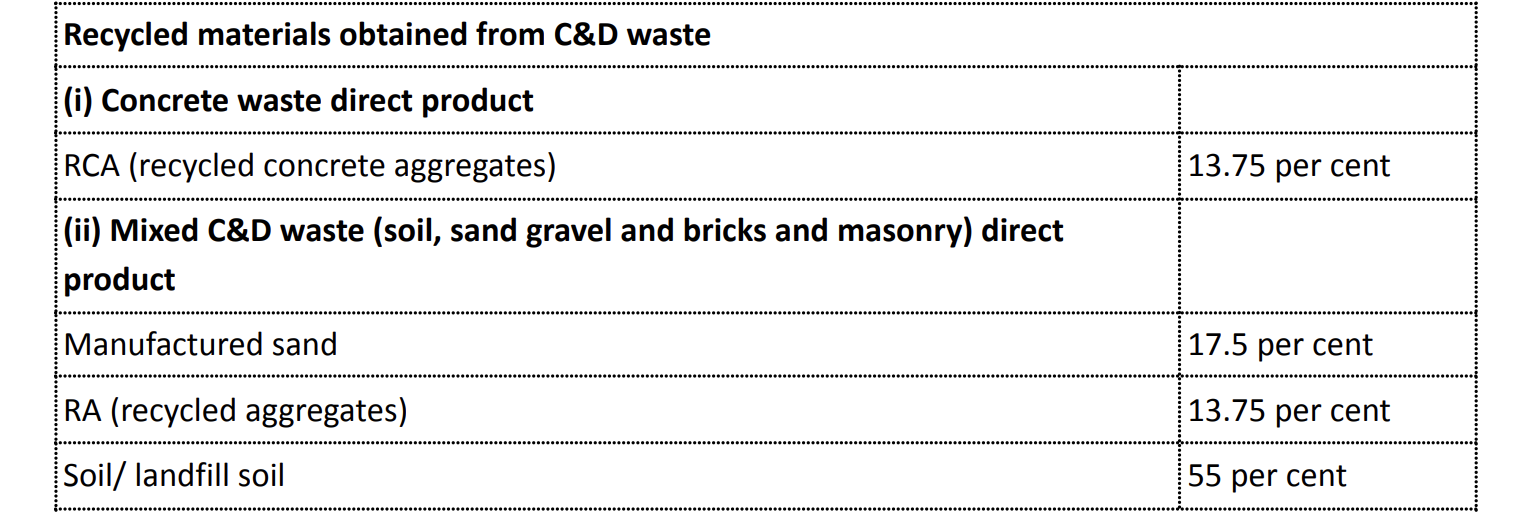
Source: Stakeholder consultations
From these recovered materials, under both scenarios, it is assumed that 50 per cent of the RAs and RCAs recovered will be used to produce products such as concrete blocks and paver bricks. The market opportunity for these products is calculated by multiplying the number of products made from RA and RCA with the price of each product unit. Table 7 below shows the specifications of concrete blocks and paver bricks taken into consideration for the analysis.
Table 7: Specifications of concrete blocks and paver bricks
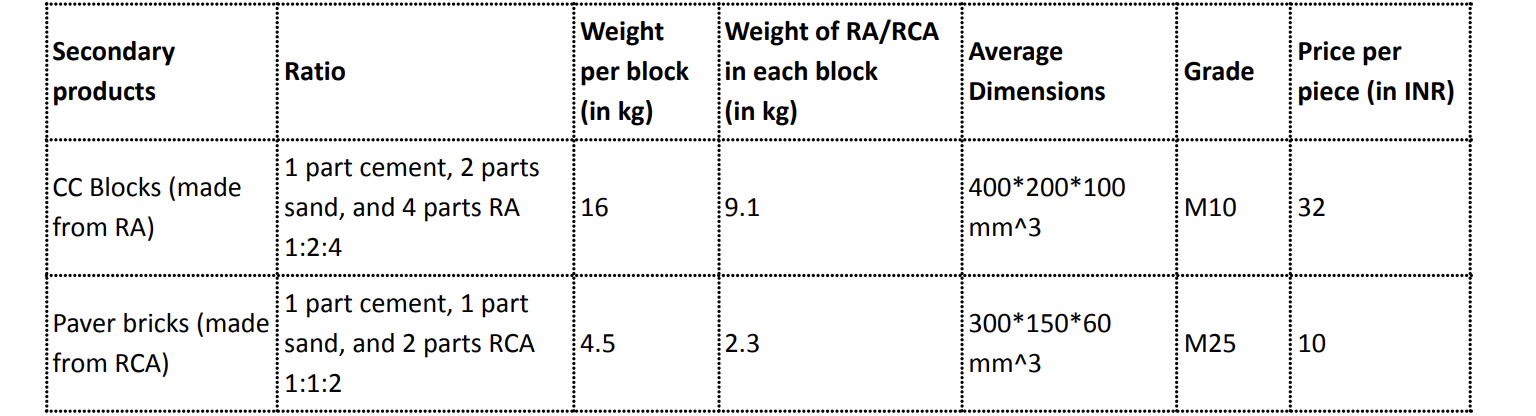
Source: Stakeholder consultations, MoHUA 2021, Makkar and Panwar n.d., Sekhar, Chandran, and Rathi 2016
The remaining 50 per cent of the RAs and RCAs will be sold as recycled raw material along with recycled sand and silt or soil on a per tonne basis.
The current prices of the materials recovered and products are an average of data on prices from secondary sources and verified with primary consultations. The secondary sources include recycled materials’ price list from C&D plants, the Delhi Public Works Department (PWD) schedule of rates, and Indiamart. These prices were then confirmed through stakeholder consultations. These prices are kept constant for the assessment period (2024 to 2030), and any change in them will directly impact the market opportunity.
Table 8: Price of the recycled materials and secondary products
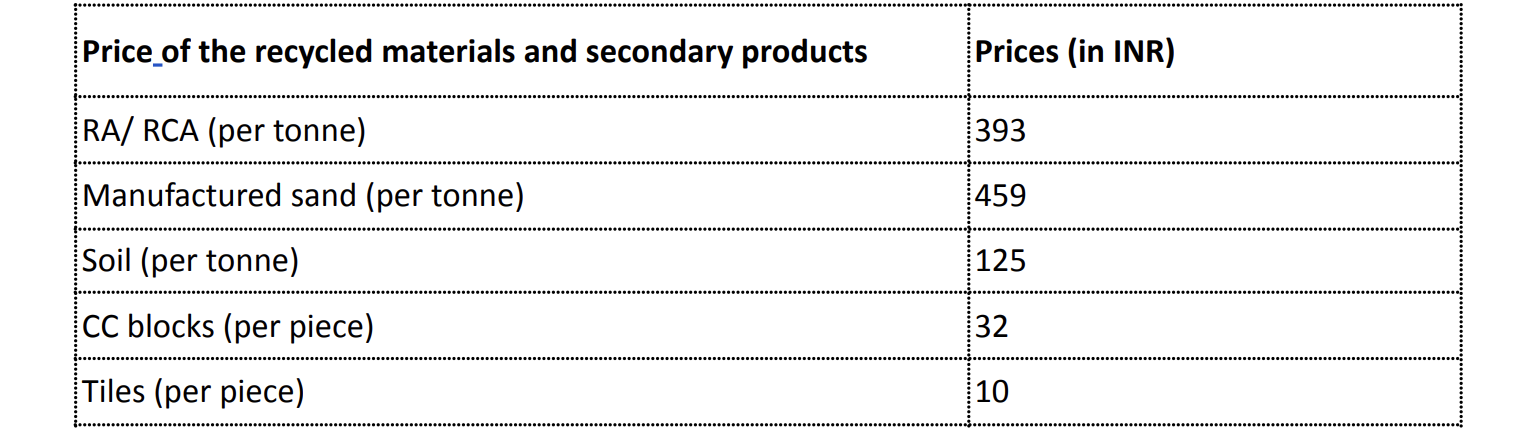
Source: Indiamart, stakeholder consultations, CPWD 2021
Scenarios for market opportunity
1. Business as usual (BAU) scenario
BAU assumes a nominal recycling rate of about 1 per cent for C&D waste recycling in Odisha. The state has a cumulative C&D waste recycling capacity of 341 tonnes per day as per the Swachh Bharat Mission (Urban) website (SBM (U) n.d.). However, generally, the C&D waste generated is disposed of in low-lying areas or solid waste dumpsites (OSPCB 2023). In this regard, due to the varied operational capacity as per sources, India’s C&D waste recycling rate, which is at 1 per cent (Roychowdhury, Somvanshi, and Verma 2020), is taken into account for the BAU scenario for Odisha. In this context, the cumulative C&D waste to be recycled under the BAU scenario for the assessment period of 2024-2030 is 40.5 kilo tonnes and the cumulative market opportunity is 0.33 million USD.
2. Policy Scenario
Under the policy scenario, the recycling rate is projected to reach 50 per cent by 2025 and 75 per cent by 2030 based on the targets under the Draft National Resource Efficiency Policy, 2019. 14 In this context, the cumulative C&D waste to be recycled under the policy scenario for the assessment period of 2024-2030 is 2,578 kilo tonnes and the cumulative market opportunity is 21 million USD.
3. Ambitious scenario
The ambitious scenario considers the recycling rate to reach 100 per cent by 2030. The scenario is inspired by Delhi’s C&D waste recycling capacity, which is at 80 per cent of the total C&D waste generated, and soon to reach a 100 per cent recycling rate. In this context, the cumulative C&D waste to be recycled under the ambitious scenario for the assessment period of 2024-2030 is 3,312 kilo tonnes and the cumulative market opportunity is 27 million USD.
There are two FTEs for C&D waste value chain; one for recycling and other for manufacturing of products from the recycled C&D waste materials. Therefore, the jobs are calculated as a sum of the above two sets of jobs.
● As mentioned above, under each scenario, depending on the recycling rate, the quantity of C&D waste to be recycled is calculated. Therefore, the total number of jobs for recycling are calculated using the below formula:
Recycling jobs = FTE * waste to be recycled in tonnes
● Similarly, under each scenario separately, the jobs for producing products are calculated by multiplying the FTE with 50 per cent of the quantity of RA and RCA recovered, of which products will be made.
Products jobs = FTE * market opportunity (50 per cent of RA and RCA recovered from recycling in tonnes, from which products will be made)
On this basis, jobs are estimated for three scenarios as follows:
● Under the BAU scenario, the total cumulative jobs for the assessment period 2024-2030 is 15 for recycling 40.5 kilo tonnes of C&D waste and producing products of 4.7 kilo tonnes of RA and RCA over the assessment period 2024-30.
● Under the policy scenario, the total cumulative jobs for the assessment period 2024-2030 is 1,137 for recycling 2,578 kilo tonnes C&D waste and producing products of 303 kilo tonnes of RA and RCA over the assessment period 2024-30.
● Under the ambitious scenario, the total cumulative jobs for the assessment period 2024-2030 is 1,515 for recycling 3,312 kilo tonnes C&D waste and producing products of 389 kilo tonnes of RA and RCA over the assessment period 2024-30.
The investment opportunity is the capital expenditure (capex) to be incurred in setting up the C&D waste recycling facilities under different scenarios. The number of facilities and their recycling capacity are sized to the maximum waste generated in Odisha, that is, waste generated in the year 2030, and indicative to showcase the investment potential. The capex required under different scenarios is mentioned below:
Table 9: Capex required under different scenarios
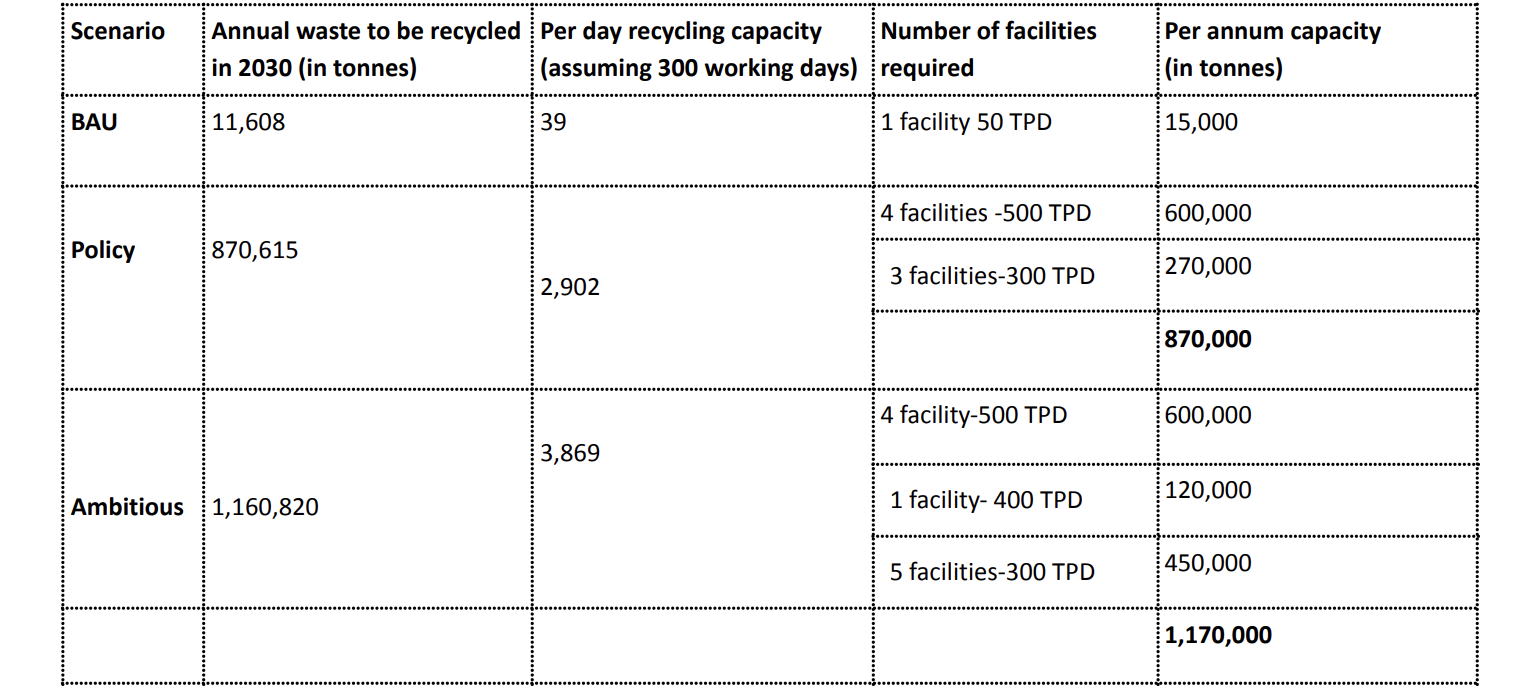
Source: Authors’ analysis
○ For the BAU scenario, where a 39 TPD plant is required, it is suggested that a 50 TPD C&D waste stone crushing unit is set up for this purpose. The machinery cost of a 50 TPD C&D waste stone crushing unit is Rs.12,00,000 i.e., 0.014 million USD (Sekhar, Chandran, and Rathi 2016).
○ For the policy and ambitious scenarios where various facilities of different capacities are required, we have used the capex range from a primary consultation. As per the consultation, the capex for setting up a 200 - 500 TPD is approximately Rs. 5 to 9 crores. This includes plants and machinery. It is assumed that the land will be provided by the local body for setting up the facility under a public-private partnership model.
○ Thereafter, a per tonne capex was calculated as below:
Assuming that the plant is operational for 300 working days, the average per tonne capex was calculated:
Table 10: Capex: Average per tonne

Source: Stakeholder consultations and analysis
Per tonne capex (in USD) ={Average[(5,00,00,000/60,000)+(9,00,00,000/1,50,000)]}/83 where, 1 USD = Rs. 83.
In this regard, when considering the annual capacity of a C&D waste plant, approximately, 8.6 USD is the estimated capex on a per tonne basis.
○ Using the per tonne capital expenditure, investment opportunity for the policy and ambitious scenario were calculated.
Investment opportunity under each scenario = Per annum capacity of C&D facilities (as set in the table above) * per tonne capex.
○ In this context, the investment opportunity under the policy scenario is 7.5 million USD, and under the ambitious scenario, it is 10.1 million USD.
Based on the urban local body (ULB) population, C&D waste is considered as a percentage of the total solid waste generated by the ULB (MoHUA 2021):
Table 11: C&D waste as a percentage of solid waste generated by the ULB
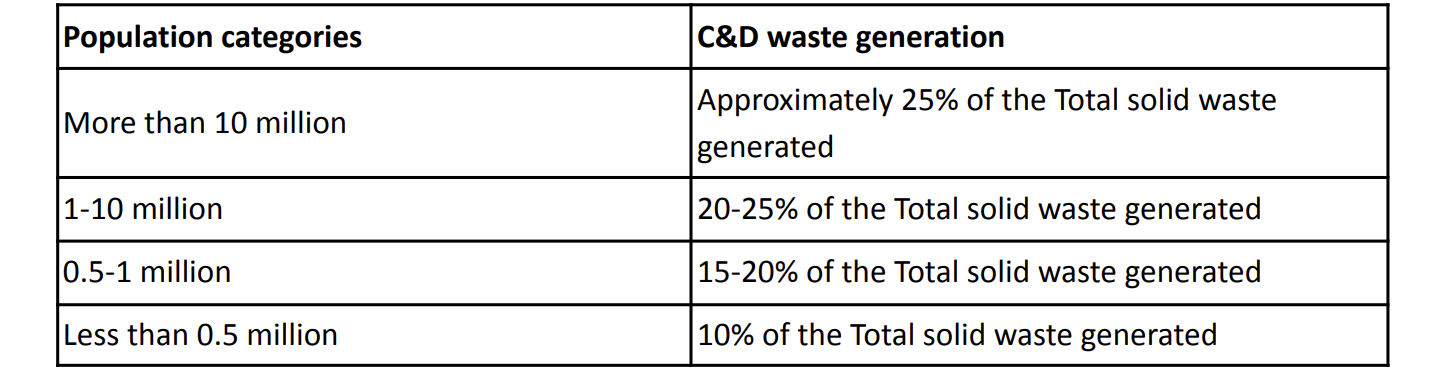
Source: MoHUA 2021
Estimating the composition of C&D out of the total solid waste based on the population of ULBs as set out above:
Table 12: C&D percentage of the total solid waste for Odisha
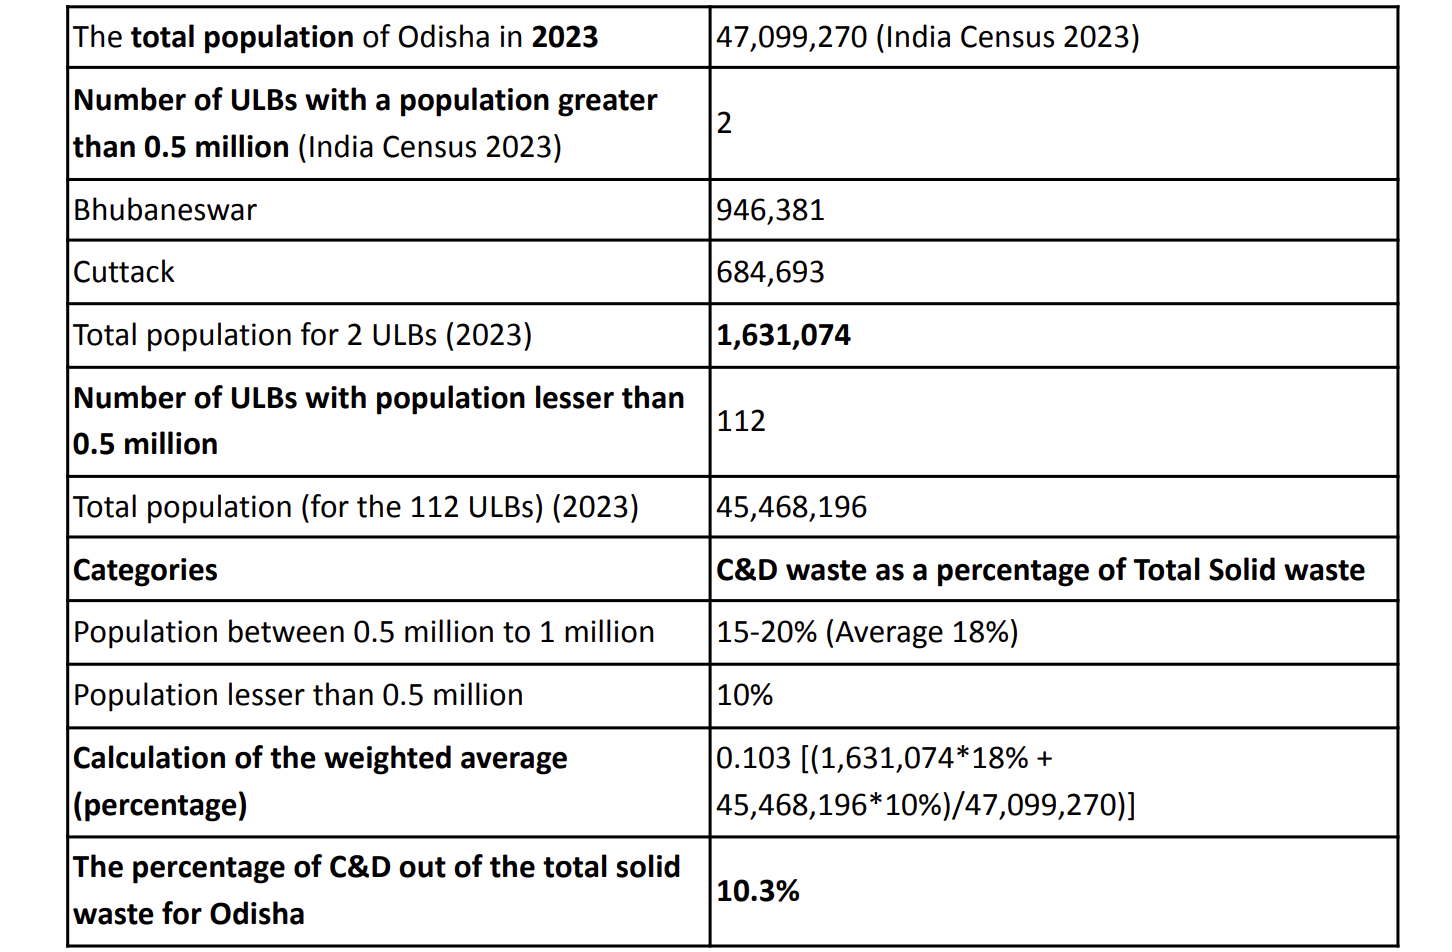
Source: India Census 2023, Authors’ analysis
Biswas, Atin, Kuldeep Chaudhary, Richa Singh, Shailshree Tewari, Siddharth Singh and Subhasish Parida. 2021. “Waste-Wise Cities: Best practices in municipal solid waste management.” https://www.niti.gov.in/sites/default/files/2021-12/Waste-Wise-Cities.pdf New Delhi: Centre for Science and Environment and Niti Aayog.
CAG. 2021. "Audit Report of the Comptroller and Auditor General of India Performance Audit on Waste Management in Urban Areas for the year ended March 2021 Government of Odisha." https://cag.gov.in/en/audit-report/details/117649
CPCB (Central Pollution Control Board). 2017. “Guidelines on Dust mitigation measures in handling construction material and C&D wastes.” https://cpcb.nic.in/openpdffile.php?id=UmVwb3J0RmlsZXMvNTYxXzE1MTE5MzMzN...
Central Public Works Department (CPWD). 2021. "Delhi Schedule of Rates." https://www.daojharkhandgroup.in/wp-content/uploads/2021/09/DSR-2021.pd
DPCC (Delhi Pollution Control Committee). n.d. “Monitoring of Dust Mitigation Measures. Construction and Demolition sites.” https://dustcontroldpcc.delhi.gov.in/Upload/GuidelinesPDF/43/FilePDF_43_...
DPCC. 2018. “Direction u/s 5 of Environment (Protection) Act, 1986, read along with Construction and Demolition Waste Management Rules, 2016.” https://pwddelhi.gov.in/writeread/Circular/Cir_201804111242042513.pdf
DPCC. 2022. “Annual Report in Form IV in respect of NCT of Delhi for the Year 2021-2022 on the Implementation of Construction and Demolition Waste Management Rules, 2016.” https://www.dpcc.delhigovt.nic.in//uploads/pdf/AnnualReportCD2021-2022pd...
European Commission. 2023. “Call for better management of coastal sand mining to halt ‘dire’ consequences.” Accessed on December 12, 2023. https://environment.ec.europa.eu/news/call-better-management-coastal-san...(including%20gravel,nickname%20'the%20new%20gold
Forest, Environment & Climate Change Department. 2023. “Environment Synthesis Report of Odisha.” https://stsc.odisha.gov.in/sites/default/files/2023-08/Environmental%20S...
Government of NCT of Delhi, Department of Urban Development. 2016. “Use of Recycled Products from Construction & DemolitionWaste.” https://www.dpcc.delhigovt.nic.in/uploads/pdf/CDWasteProductsUseOrderpdf...
Government of NCT of Delhi, Office of the Director (Local Bodies). 2018. “Use of Recycled Products from Construction and Demolition (C&D) Waste.” https://pwddelhi.gov.in/writeread/Circular/Cir_201802161507462320.pdf
Hossain, Md Uzzal, Chi Sun Poon, Irene MC Lo, and Jack CP Cheng. 2016. "Comparative environmental evaluation of aggregate production from recycled waste materials and virgin sources by LCA." Resources, Conservation and Recycling 109 (2016): 67-77. https://www.sciencedirect.com/science/article/abs/pii/S0921344916300295
IGBC (Indian Green Building Council). n.d. “Government Incentives to IGBC-rated Green Building Projects.” Accessed on February 01, 2024. https://igbc.in/governmentincentivestoigbc#:~:text=Climate%20Change%20De...
ILFS. n.d. "Construction & Demolition Waste Recycling."
http://old.ilfsindia.com/our-work/environment/construction-demolition-wa...
India Census. n.d. "Orissa Population". Accessed on December 20, 2023.
https://www.indiacensus.net/states/orissa
Jain, Sourabh, Shaleen Singhal, and Nikunj Kumar Jain. 2019. “Construction and Demolition Waste Generation in Cities in India: An Integrated Approach.” International Journal of Sustainable Engineering 12 (5): 333–40. doi:10.1080/19397038.2019.1612967.
https://www.tandfonline.com/doi/full/10.1080/19397038.2019.1612967
Jaisankar, C. 2023. “Prices of manufactured sand shoot up as several quarries stay shut after ED raids.” Accessed on January 15, 2024.
https://www.thehindu.com/news/cities/Tiruchirapalli/prices-of-manufactur...
Makkar, B.B. and D.S. Panwar. n.d. "C&D waste recycled block masonry." CSE.
https://cdn.cseindia.org/docs/photogallery/orientation-conclave/makkar.pdf
Masrath, Fatima. 2023. “GHMC officials seize 20 unauthorised C&D waste collection vehicles.” Accessed on January 20, 2024.
https://www.siasat.com/ghmc-officials-seize-20-unauthorised-cd-waste-col...
Ministry of Environment, Forest and Climate Change. "Draft National Resource Efficiency Policy, 2019."
https://moef.gov.in/draft-national-resource-efficiency-policy2019-inviti...
MoHUA (Ministry of Housing and Urban Affairs). 2021. "Circular Economy in Municipal Solid and Liquid Waste."
https://mohua.gov.in/pdf/627b8318adf18Circular-Economy-in-waste-manageme...
National Green Tribunal, New Delhi. 2019. “Pawan Kumar Sharma v. Govt. of NCT of Delhi, OA No. 2 of 2019,”
https://greentribunal.gov.in/sites/default/files/news_updates/Report%20b...
Niti Aayog. 2018. “Draft Strategy for Promoting Processing of Construction and Demolition (C&D) Waste and Utilisation of Recycled Products.”
https://www.niti.gov.in/sites/default/files/2019-03/CDW_Strategy_Draft%2...
OSPCB 2023. "Annual Report for the period 2022-2023 on Implementation of Construction and Demolition Waste Management Rules, 2016 in the state of Odisha."
https://ospcboard.org/wp-content/uploads/2023/07/10993-13.07.2023-Annual...
PIB (Press Information Bureau). 2023. “Coal India Ltd to Launch M-Sand Projects in a Big Way.” Accessed on November 10, 2023. https://pib.gov.in/PressReleasePage.aspx?PRID=1894047
Prakash Chandar, S., and S. Loganathan. 2022. "Demand Analysis on Natural River Sand Used in the Construction Project." In Sustainable Construction Materials: Select Proceedings of ACMM 2021, pp. 51-60. Springer Singapore.
https://books.google.co.in/books?hl=en&lr=&id=0vBUEAAAQBAJ&oi=fnd&pg=PA5...
Purchase, Callun Keith, Dhafer Manna Al Zulayq, Bio Talakatoa O’Brien, Matthew Joseph Kowalewski, Aydin Berenjian, Amir Hossein Tarighaleslami, and Mostafa Seifan. 2021. "Circular economy of construction and demolition waste: A literature review on lessons, challenges, and benefits." Materials 15, no. 1 (2021): 76.
https://pmc.ncbi.nlm.nih.gov/articles/PMC8745857/
Roychowdhury, Anumita, Avikal Somvanshi and Anurag Verma. 2020. “Another Brick off the Wall: Improving Construction and Demolition Waste Management in Indian Cities.” New Delhi: Centre for Science and Environment.
https://www.cseindia.org/another-brick-off-the-wall-10325
Roychowdhury, Anumita, Rajneesh Sareen and Mitashi Singh. 2023. “Construction and Demolition Waste: Closing the waste loop for sustainability.” New Delhi: Centre for Science and Environment. https://www.cseindia.org/construction-and-demolition-waste-11992
Sekhar, Achu R., Krishna Chandran and Vaibhav Rathi. 2016. "Resource Efficiency in the Construction Sector." New Delhi: Development Alternatives.
https://www.devalt.org/images/L2_ProjectPdfs/BangalorereportonC_Dwastema...
Swacch Bharat Mission (Urban) (SBM (U). n.d. "SWM Plants." Accessed on August 01, 2024
https://sbmurban.org/swachh-bharat-mission-progess
Tyagi, Akanksha, Charu Lata, Jessica Korsh, Ankit Nagarwal, Deepak Rai, Sameer Kwatra, Neeraj Kuldeep, and Praveen Saxena. 2022. “India’s Expanding Clean Energy Workforce.” Council on Energy, Environment and Water, Natural Resources Defense Council, and Skill Council for Green Jobs. https://www.ceew.in/sites/default/files/Green-Jobs-Report-Jan27.pdf