Council on Energy, Environment and Water Integrated | International | Independent
There has been rapid technological advancement in the electrical and electronic sector. With the reduced lifespan (Bhutta et al. 2011) of electrical and electronic equipment and increased consumption by consumers, a large quantity of electrical and electronic equipment waste (e-waste) is being generated in a short period. However, the infrastructure and processes to manage this waste are not being developed at the same pace. India generated 1.6 million tonnes of e-waste in 2021-22 and recycled only 33 per cent (0.5 million tonnes) (PIB 2023). Estimates suggest that India will generate over 161 million tonnes of e-waste by 2050 (Sengupta et al. 2022). In this regard, urban mining of materials through recycling of e-waste holds significant economic value and offers employment opportunities. For example, “1 tonne of ore has an extractable reserve of about 1.4 g of gold, while a tonne of mobile phone printed circuit boards (PCBs) can produce about 1.5 kg” (MeitY 2021).
Jobs overview
● A total of 6,000 1 direct FTE jobs can be generated through the recycling of 1,000 kilo tonnes of e-waste in Odisha for the period of 2024 – 2030. These estimates are for an ‘ambitious scenario’, which considers that Odisha can emerge as a recycling hub for e-waste in eastern India. In such a scenario, in addition to recycling its own waste, it will be able to process additional waste from neighbouring states like Chhattisgarh, Jharkhand and West Bengal in its recycling facilities.
Market Opportunity
● 100 million USD is the revenue potential from recycling 200 kilo tonnes of e-waste in 2030 in Odisha under the ambitious scenario.
Investment Opportunity
● Under the ambitious scenario, 40 million USD is the investment potential, i.e., capital expenditure, to set up e-waste recycling capacities of approximately 200 5 kilo-tonnes per annum in Odisha.
Annexure I contains further details on the methodology.
● Prevention from environmental and health hazards: Some of the e-waste contains toxic substances such as mercury, lead, cadmium, among others (Lin et al. 2022). Furthermore, about 90 per cent of the e-waste generated is managed by the informal sector (Turaga et al. 2019, Biswas and Singh 2020). Illegal and informal extraction of materials and disposal of unprocessed e-waste in landfills, dumpsites, or water bodies contaminates the environment (Raghupathy et al. 2018) and has an adverse impact that disproportionately affects low-income groups and marginalised communities (Singh and Ogunseitan 2022). Building formal e-waste recycling capacities and addressing the challenges of formal recyclers will reduce the leakage of e-waste and the consequences of unscientific handling and disposal.
● Creating circular industries: The e-waste also contains valuable metals such as copper, silver, gold, and platinum, among other materials that can be recovered and brought back into the production cycle. The recovered materials can feed into the raw materials requirement for the production of electronics at Infovalley Electronics Manufacturing Cluster, Bhubaneswar, and similar manufacturing industries located within or outside Odisha. Odisha’s strategic location with access to Paradip port also enables the recyclers to export these materials to fulfil international demand.
● Reduced emissions from mining: Efficient material recovery from e-waste will lead to a reduction in the carbon footprint from procuring virgin raw materials for manufacturing electrical and electronic equipment (Manish and Chakraborty 2019). For instance, recycling 110,000 tonnes of e-waste can result in avoiding 155,000 tonnes of CO₂-equivalents, which can otherwise be generated from the production of new materials such as iron and aluminium (Golsteijn and Martinez 2017). Additionally, with reduced transportation between recyclers and manufacturers, the carbon footprint of the supply chain is bound to be reduced.
Eco Recycling Limited (Ecoreco) is an R2 certified e-waste recycler located in Maharashtra, with a recycling capacity of 25,000 tonnes per annum (Ecoreco 2018). Additionally, Ecoreco runs a mobile application called Bookmyjunk, where waste generators can register for the collection of e-waste free of cost (Wangchuk, Rinchen Norbu. 2021). It undertakes end-to-end e-waste recycling and promotes the use of recovered materials by electronics manufacturers. On Global Recycling Day in 2024, it engaged 1000 industrial and commercial units in Maharashtra on responsible disposal practices and collected over 10,000 kg of e-waste (ANI News 2024). Further, it has partnered with the National Skills Development Corporation (NSDC) for the skilling of workers in the informal recycling industry (Ecoreco 2023).
1. Role of departments
● Odisha State Pollution Control Board (OSPCB): One of the major challenges in scaling e-waste recycling is the low awareness among the waste generators regarding the handover of waste. The OSPCB to conduct random checks on bulk consumers 7 to ensure that e-waste is channelled to formal recyclers. OSPCB can also conduct campaigns and events to support the producers’ and recyclers’ efforts to raise awareness of channeling e-waste to formal recycling units. OSPCB, through inspections, to suspend/cancel the authorisation of recyclers who are authorised but are not undertaking recycling operations. It should also audit the material balance of the e-waste to ensure that the residue waste from recycling is supplied to the authorised Treatment Storage Disposal Facility (TSDF).
● Local bodies to sustain their efforts to integrate the informal sector into the formal supply chain. They can engage leaders of the local communities or the informal groups to influence the informal workers to sell the collected waste through the local bodies for formal recycling. In this context, training sessions to be undertaken for both the municipal staff and the informal sector on the collection and handling of e-waste and health and safety. Awareness campaigns on e-waste segregation to continue as a part of the awareness of waste management. Penalties to be imposed particularly on commercial and institutional establishments that give municipal waste, mixed with e-waste or sell to unauthorised personnel, given its hazardous nature. These penalties can be notified by itself or in the bye-laws notified under Solid Waste Management Rules, 2016.
● Pursuant to the EWM Rules, the Labour and E.S.I Department, Odisha, to ensure recognition of workers engaged in dismantling and recycling and work with the local bodies to form local groups of such workers to facilitate the setting up of common dismantling facilities. These facilities may be introduced as a part of the wealth centres created under the Standard Operating Procedure (SOP) For Decentralised Solid Waste Management in the State of Odisha (amended in 2020 and 2022) issued by the Housing and Urban Development Department (H&UDD). Thus, formalising the informal sector.
● Industries Department, either under the Odisha Electronics Policy 2021 (Odisha Policy) or a separate policy for e-waste recyclers, to create resource recovery or industrial parks that have a dedicated area for waste recycling with fiscal and non-fiscal incentives and market linkage for the supply of recovered materials. This will encourage more recyclers to enter the ecosystem and motivate some of the bigger informal players to formalise and reduce the cost disparity between informal and formal recycling units. Proximity to other recycling and manufacturing units will ease market uptake of materials recovered from e-waste. This will also reduce the challenge of storing e-waste or materials recovered from it.
● Skill Development and Technical Education Department, with the State Council for Technical Education and Vocational Training and Odisha Skill Development Authority (“OSDA”) (collectively “Skilling bodies”) to facilitate the inclusion of courses on e-waste dismantling and recycling in the Industrial Training Institutes (ITI) curriculums and courses, respectively. They must collaborate with recyclers to design or update the syllabus and conduct field visits and internships for the students.
2. Potential role of the private sector
● E-waste recyclers can initiate tie-ups with local bodies in the State with relatively higher segregation levels for the e-waste supply.
● Recyclers and producers engage with civil society organisations (CSOs) in the State to create awareness among the e-waste generators to segregate and deposit e-waste with authorised recyclers or municipal collection systems.
● Associations such as the Electronic Industries Association of India and the Manufacturers Association for Information Technology (MAIT) to actively facilitate periodic dialogue between manufacturers and recyclers. The discussion covers aspects of sustainable product designs, changes in material composition, reverse logistics, and other challenges faced by recyclers (MoHUA 2023).
● Issues in the e-waste supply chain: More than 90 per cent of e-waste is managed by the informal sector in India (Biswas and Singh 2020). Often, the informal sector does not comply with the regulatory norms for waste processing units, risking the health and safety of workers. Hence, they do not incur substantial capital and operational costs, which allows them to purchase e-waste from waste generators at a competitive price than formal recyclers. 8 The unavailability of the requisite quantity of e-waste due to leakages into the informal sector poses a risk to the return on investments for recycling infrastructure. It can discourage formal recyclers from scaling up and/or bringing advanced technologies for e-waste dismantling and recycling. Some mitigation strategies to address this challenge are suggested below:
Way forward:
● The informal sector to either be integrated with the formal supply chain or formalised. This integration is critical to capitalise on the informal sector's high e-waste collection rate and safeguard economic and social benefits for these marginalised communities (Zhang, Schnoor, and Zeng 2012). Facilitating adequate incentives for informal sector workers can motivate them to become part of the formal supply chain. Some recommendations are:
- setting up common dismantling facilities to facilitate co-working of formal and informal workers. Recycling setup can also be integrated into such facilities. Such a facility will provide a safe and compliant space for informal workers to handle the e-waste. The investment in these facilities can be made by the private sector or jointly with the local bodies based on a public-private partnership model. This can also be read as an extension of Rule 10 of the EWM Rules, which requires the Department of Labour to recognise and register workers involved in dismantling and recycling and to assist in forming groups of workers to facilitate the setting up of dismantling facilities.
- procurement of e-waste collected by the informal players by local bodies. By virtue of the SOP issued by H&UDD, waste pickers have been integrated at the materials recovery facilities in Odisha. Integration of the informal sector for collection and its channelisation to recyclers, can ensure that the informal players lead the collection while the formal recyclers process it.
- registration of informal workers, issuing ID cards and training by local bodies. Training can cover safe collection of e-waste, scientific methods to sort and dismantle different types of e-waste and requirements under the EWM Rules to channelise e-waste to authorised entities, among others. An action plan for training can be created where frequency and subject matter are defined, and its impact can be monitored to make course corrections when necessary.
● Issues of segregation and disposal of waste and unauthorised collection by the informal sector are primarily caused by a lack of awareness among the waste generators and loose enforcement by the local bodies. Most of the formal facilities are operating well below their approved capacities because of their inability to source adequate e-waste (Turaga et al. 2019). This challenge can be mitigated by Swachha Saathis extending sensitisation sessions to households under the SOP. Behavioural change at an individual level can be brought about by explaining the ill effects of dumping and informal recycling on the environment.
● Awareness regarding the segregation of e-waste and handover of e-waste to either municipal staff or to informal workers with ID cards to be conducted on a regular basis. The local bodies can also identify self-help groups or civil society organisations, or community leaders with influence to undertake awareness programmes on the ground. Additionally, under the EWM Rules, recyclers are required to undertake awareness through media, publications, advertisements, posters, or other means of communication. In addition to the regular awareness campaigns, H&UDD may leverage this provision and facilitate awareness, in collaboration with the recyclers, on the segregation and deposition of e-waste in an authorised manner.
● The erstwhile E-waste (Management) Rules, 2016 set forth an obligation on bulk consumers 9 to submit annual returns to the SPCB with information on the destination of e-waste generated by them in a year. While the current EWM Rules have done away with this obligation, the H & UDD introduce and enforce this obligation in order to ensure that bulk consumers channelise the e-waste to registered recyclers.
● Lack of skilled personnel: Interviews with recyclers have highlighted that it is difficult to find personnel with the necessary skills for dismantling and recycling operations. This limitation creates an issue, especially when employees trained on the job leave the recycling facility and new employees have to be trained afresh.
Way forward: The Skill Development and Technical Education Department to facilitate the introduction of an e-waste recycling module in the ITI curriculum. The module includes necessary knowledge on the assembly of electrical and electronic equipment for ease of dismantling, plastic used in e-waste, production line knowledge, understanding of recycling machinery, and expertise in electronics and metallurgy. Similarly, the OSDA to introduce or supplement existing e-waste or electronics courses with the above topics. The module/courses to be complemented with field visits or short-term training at established recycling units for practical experience. This will ensure increased availability of trained personnel in the market and increase the efficiency of the recycling units. The Skilling bodies can also leverage the existing courses on e-waste, supported by the Ministry of Electronics & Information Technology (MeitY n.d., NIEIT n.d.), to update their courses.
● Inefficient digital compliance mechanism due to frequent changes and downtime: The CPCB has digitised the issuance of EPR certificates with the intention of bringing transparency, traceability, and ease for producers and recyclers. However, the portal is not consistently operational and running. Due to the portal’s downtime, recyclers are unable to issue EPR certificates to the producers and, in turn, do not get paid, making it difficult to remain financially viable. Small and medium recyclers cannot sustain themselves in the long run without due payments, which can lead to the closure of operations. Further, prospective solutions such as amendments to reduce the EPR target by the government due to such issues can again cause financial hurdles for recyclers, who have already completed the targets of collection and recycling for the producers to purchase EPR certificates.
Way forward: In this regard, CPCB to reduce the downtime of the portal to a minimum. Future amendments to the portal can be tested extensively before being released for the stakeholders to avoid the issues mentioned above. Reduction of EPR targets should be avoided as it can undermine the feasibility of small and medium enterprises to continue with their operations. Solutions such as extending the timeline to complete the target should be explored to resolve this challenge. Similarly, consents and authorisations from the different state departments to the recyclers to be issued seamlessly and within a minimum turnaround time.
● Environmental risks: Risks associated with e-waste recycling include pollution from spent chemicals and residue waste that cannot be further processed. These materials can be hazardous and should be disposed of at an authorised TSDF (CPCB 2022). Improper disposal or dumping can result in severe environmental degradation. Further, some recyclers may register but not conduct actual recycling operations, causing the recycling capacity of the state to be overestimated. OSPCB to conduct periodic audits/inspections of the recyclers to verify the fulfillment of this obligation.
● Social risks: If e-waste is not managed by observing health and safety standards, its exposure can lead to several serious health vulnerabilities (WHO 2023). The Labour and E.S.I Department will periodically audit recycling facilities to ensure compliance with relevant approvals and legal requirements. Dismantlers and recyclers should also regularly undertake health and safety training to avoid this issue.
The scope of the e-waste recycling value chain is limited to jobs created from recycling operations, which include partial transportation to recycling facilities, storage and sorting, dismantling, and recycling. These jobs are created at or by a recycling plant.
Activities before recycling, which include primary collection and aggregation, are not included in the scope of the current analysis due to data unavailability. The scope excludes corporate functions of the recyclers, such as accounts, human resources, legal, etc., and ancillary activities related to insurance, banking, chartered accountants, etc. These functions are not directly linked to the operational capacity of the recycler. Hence, only direct jobs from recycling operations are estimated in this analysis.
● Direct jobs are converted to a full-time equivalent (FTE). The full-time equivalent or job year is defined as simply a ratio of the time spent by an employee on a particular task/project in a given year to the standard total working hours in that particular year. The FTE formula translates short-term or one-time employment into a full-time equivalent or job-year (Tyagi et al. 2022).
● In this analysis, FTE for recycling operations is the number of workers engaged in the recycling operations in a year divided by the quantity of waste recycled in a year.
● Key informant interviews (KIIs) were conducted with e-waste recyclers to obtain primary data for developing FTEs. The interviews focused on capturing the number of people employed in recycling operations, the challenges and risks for the ecosystem, skilling requirements, etc.
● The new E-Waste (Management) Rules, 2022 (“EWM Rules”), effective from April 2023, increased the categories of items covered under the rules from 21 to 106. The recyclers are still in the process of building their capacities to manage the additional categories of e-waste. Hence, this analysis is limited to 21 items listed in the erstwhile E-waste (Management) Rules, 2016.
● The market opportunity is estimated as the revenue accrued by the sale of materials recovered from recycling e-waste.
● Investment opportunity refers to the capital expenditure incurred in setting up the e-waste recycling facilities. This includes the cost of land, building, and machinery.
Only one scenario, policy, is modelled for e-waste. This is because, as per OSPCB’s Annual Report on e-waste for the year 2022-23, there was no authorised recycler in Odisha; therefore, there is no ‘business-as-usual’ scenario. Furthermore, the recycling and recovery rates in the new EWM Rules are highly ambitious 11 , thereby omitting the need to model an ‘ambitious’ scenario. This scenario also assumes that Odisha will emerge as a hub for e-waste recycling in eastern India. In such a case, it is assumed that Odisha will not only manage its e-waste but also process around 50 per cent of the e-waste generated by neighbouring states of Jharkhand, West Bengal, and Chhattisgarh. This is not to suggest that these states will not further build their e-waste recycling capacities but to showcase that when a state moves past its technical constraint and builds recycling capacities with favorable ecosystems, more waste from other states will flow to the state to be recycled. Additionally, the assumption of the flow of 50 per cent of e-waste from the above-mentioned states is because the states’ current recycling capacities are less than 50 per cent of its generation. The analysis does not consider any other outflow or inflow of e-waste to Odisha except as stated herein.
KIIs were conducted with identified players to calculate the FTE and estimate jobs.
● A mix of purposive and convenience sampling strategies was used to identify the stakeholders for KIIs.
● Six KIIs were conducted, of which data from four was used for estimating FTEs due to data quality issues. These recyclers represented annual recycling capacities between 1,000 to 11,000 tonnes. The respondents were engaged in the following activities: partial transportation of e-waste to the recycling facility, storage, sorting, manual dismantling and recycling e-waste.
● Questionnaires were used to gather information and data from the respondents. The broad heads under the questionnaire included specifications of the recycling plants such as capacity, types of e-recycled, employees deployed for overall recycling operations, etc., and recycling stages. There were also qualitative questions on skill requirements at different stages of recycling, risks associated with the recycling ecosystem, prevalent challenges in the ecosystem, and interventions that can potentially solve them.
Annual FTE for e-waste recycling is computed as:
Full-time equivalent (per kilo tonne) = Total number of workers employed for recycling operations /
Total waste recycled in the year (in kilo tonnes)
Table 1: Annual FTE calculated using data received from the KIIs
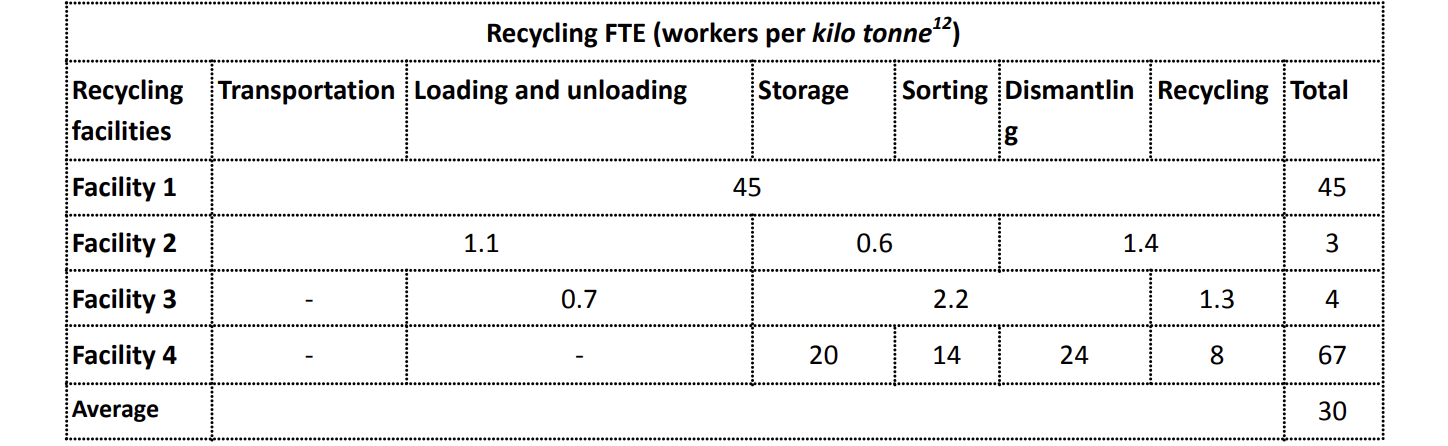

Source: Authors’ analysis based on stakeholder consultations
○ We have taken an average of the workforce of the facilities recycling both IT and non-IT items to calculate the annual FTE. The variation in the individual FTEs of the facilities is due to the variation in the composition and size of the e-waste that these facilities manage, their capacities, mode of operations, manual or automated, and their processes. Therefore, the employment potential is subject to change with these variations.
○ It should be noted that this analysis does not consider any reduction in employment due to increased automation of various recycling operations.
The market opportunity has been estimated from the sale of recycled materials recovered from e-waste recycling within or outside Odisha. First, the e-waste generated in Odisha, Jharkhand, West Bengal, and Chattisgarh was projected from 2024-2030. Thereafter, recycling rates under the policy scenario were applied to calculate the e-waste to be recycled. Next, the material composition of the e-waste categories was determined through literature and their respective recycling rates were applied to calculate the quantum of recovered materials. Lastly, the quantum of recovered materials was multiplied with their market prices to estimate the revenue from recycling. The market opportunity is, therefore, a summation of the quantum of product and price of all recoverable materials from e-waste:
Market opportunity (USD) = ∑(Recovered material from e-waste (kg) ) i * (market price (USD/kg), i indicates the recoverable materials from the e-waste USD to INR = 83
The following sections detail these three stages:
i. E-waste generation
The CPCB and SPCB reported e-waste data of the assessment states appears to be only for collected and processed e-waste and not generation. Further, independent studies estimating e-waste generation and available on West Bengal and Jharkhand SPCB’s website are based on different methodologies and project varied data. In this context, to understand the market opportunity based on the e-waste generation of these states, the e-waste generation is projected based on per capita e-waste generation.
Table 2: India’s reported e-waste generation data from 2017-22
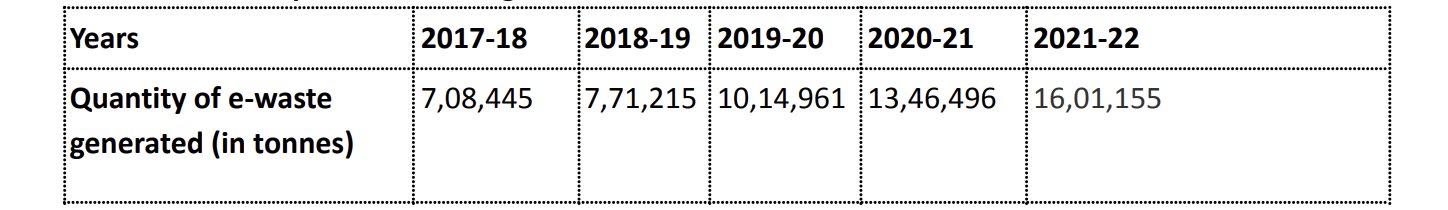
Source: PIB 2023
The compound annual growth rate (CAGR) from 2017-22 is 22.61 per cent, which is used to project e-waste generation in India till 2030-31 as shown below:
Table 3:Projected e-waste generation in India
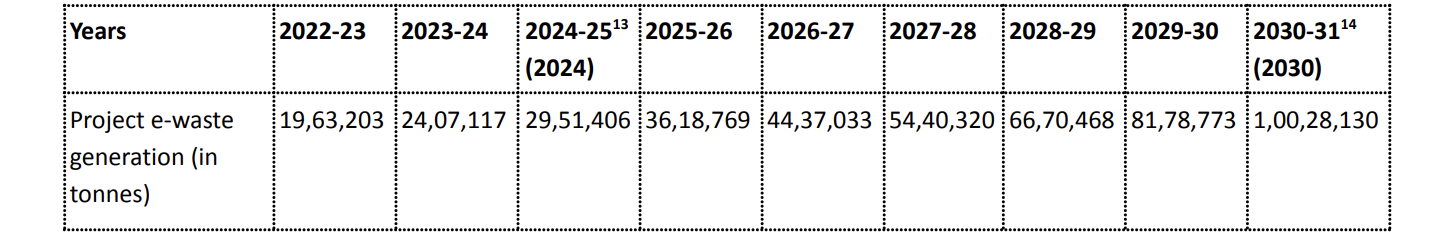
Source: Authors’ analysis based on CAGR
The population of India for the year 2023-24 is suggested to be 1,42,57,75,850 (UN 2023). Therefore, the per capita e-waste generation at an India level is 1.7 kg based on the below formula:
Per capita e - waste generation = E - waste generation (in kg) in FY 2023 - 24 population of India in FT 2023 - 24
This per capita e-waste generation is used at a state level to estimate the approximate and indicative e-waste generation of Odisha, Jharkhand, West Bengal and Chhattisgarh. The limitation of this method is that the per capita e-waste generation across the states in India is varied. However, this is not accounted for in this study due to limited data availability. Therefore, the India level per capita e-waste generation is used as an average for the states. This per capita e-waste generation of 1.7 kg is kept constant for the assessment period (2024 to 2030), and any change in them will directly impact the market opportunity.
E-waste in Odisha: Odisha’s population for 2024-2030 has been taken from the Report of the Technical Group on Population Projections, Census of India 2011 (MoH&FW 2020). Every year’s population is multiplied by 1.7 kg (per capita e-waste generation) to calculate the estimated e-waste generation of Odisha as shown below:
Table 4: Estimated e-waste generation in Odisha
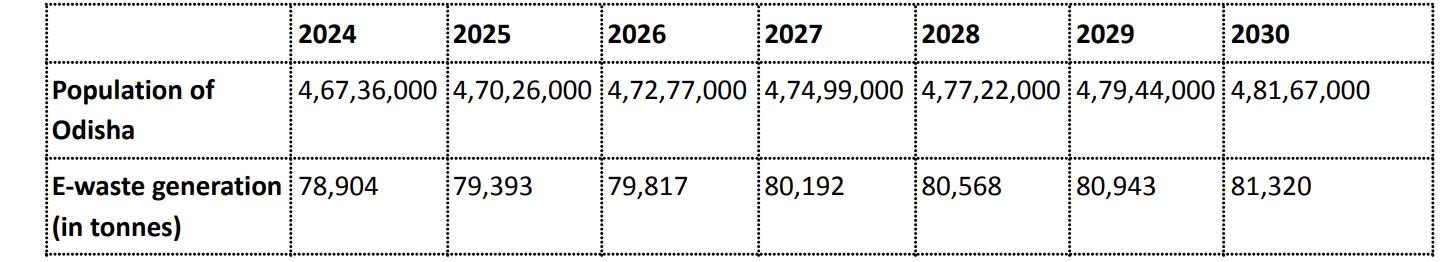
Source: MoH&FW, 2020 for population, authors’ analysis for projected e-waste generation in Odisha based on the estimated per capita e-waste generation in India
E-waste in Jharkhand, West Bengal, and Chhattisgarh: Similar to Odisha, the population of these states were taken (MoH&FW 2020) and multiplied by 1.7 kg to calculate the estimated e-waste generation as shown below:
Table 5: Estimated e-waste generation in Jharkhand, West Bengal, and Chhattisgarh
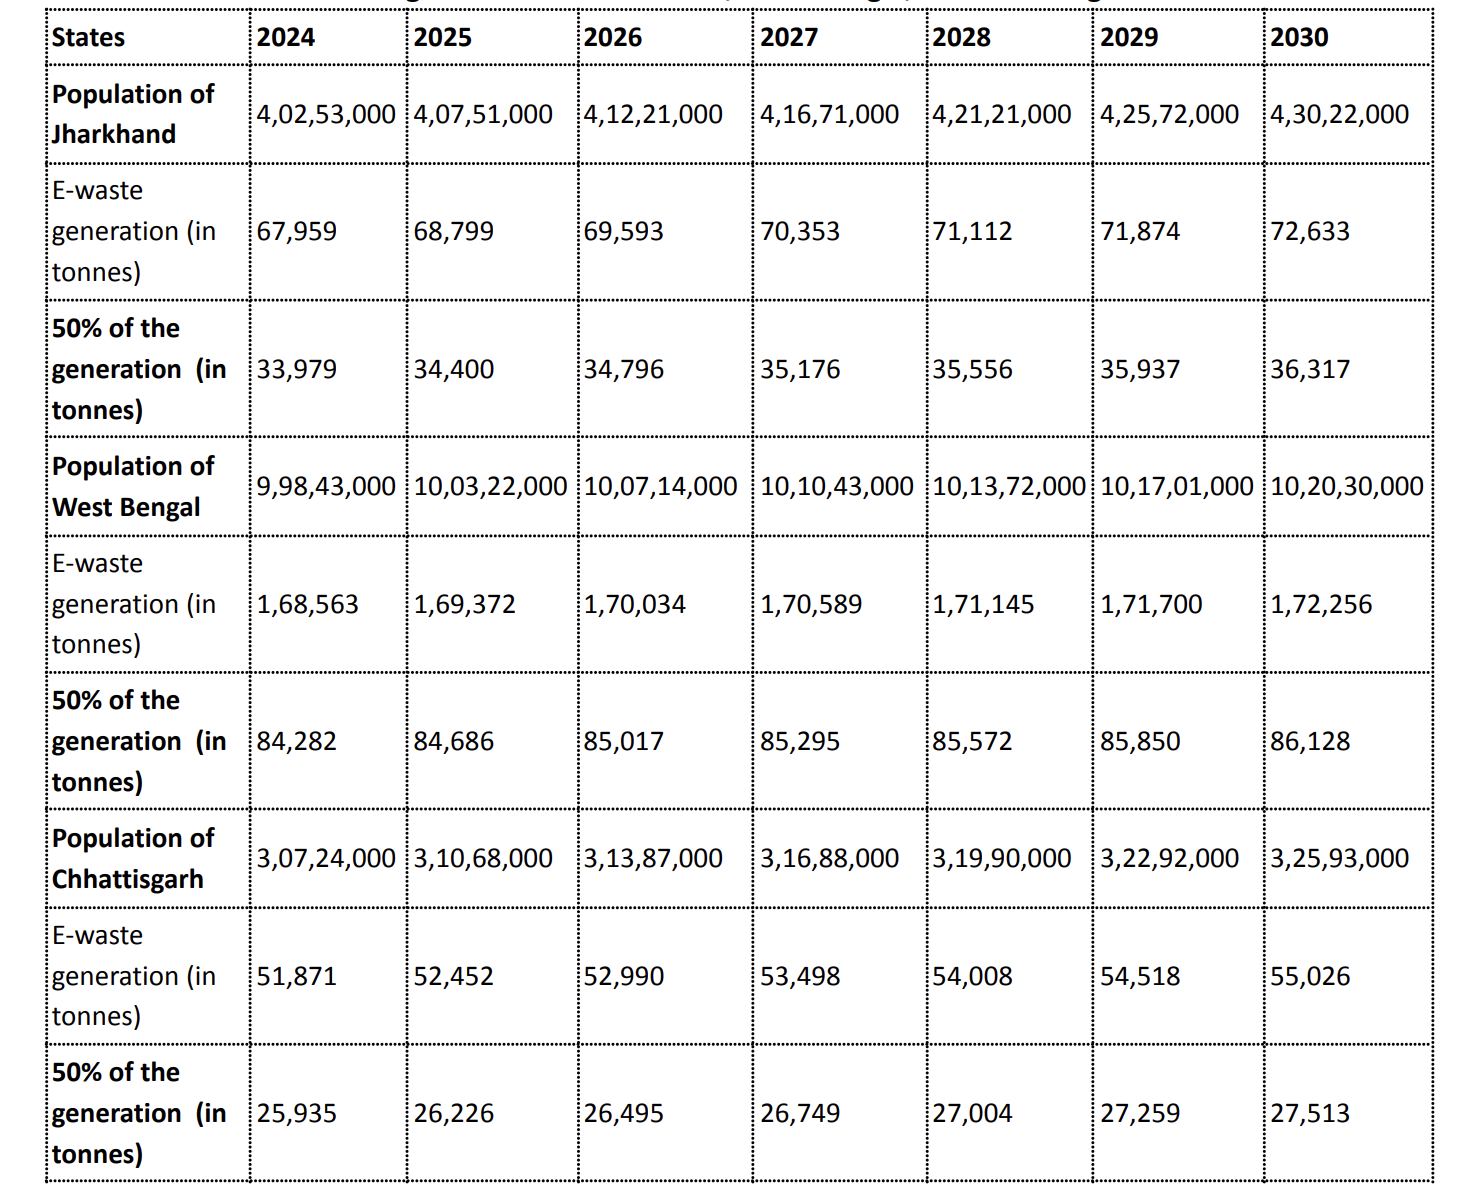
Source: MoH&FW, 2020 for population, authors’ analysis for estimated e-waste generation in the states based on the estimated per capita e-waste generation in India
Composition of e-waste: As highlighted before, the scope of the current analysis is limited to the 21 items under the erstwhile E-waste (Management) Rules, 2016. This is because the recyclers are still in the process of building their capacities to manage the additional categories of e-waste under the new EWM Rules. The average weight and life of the above-mentioned 21 categories are mentioned below (Panchal et al. 2021):
Table 6: Average weight and life of electrical and electronic equipment
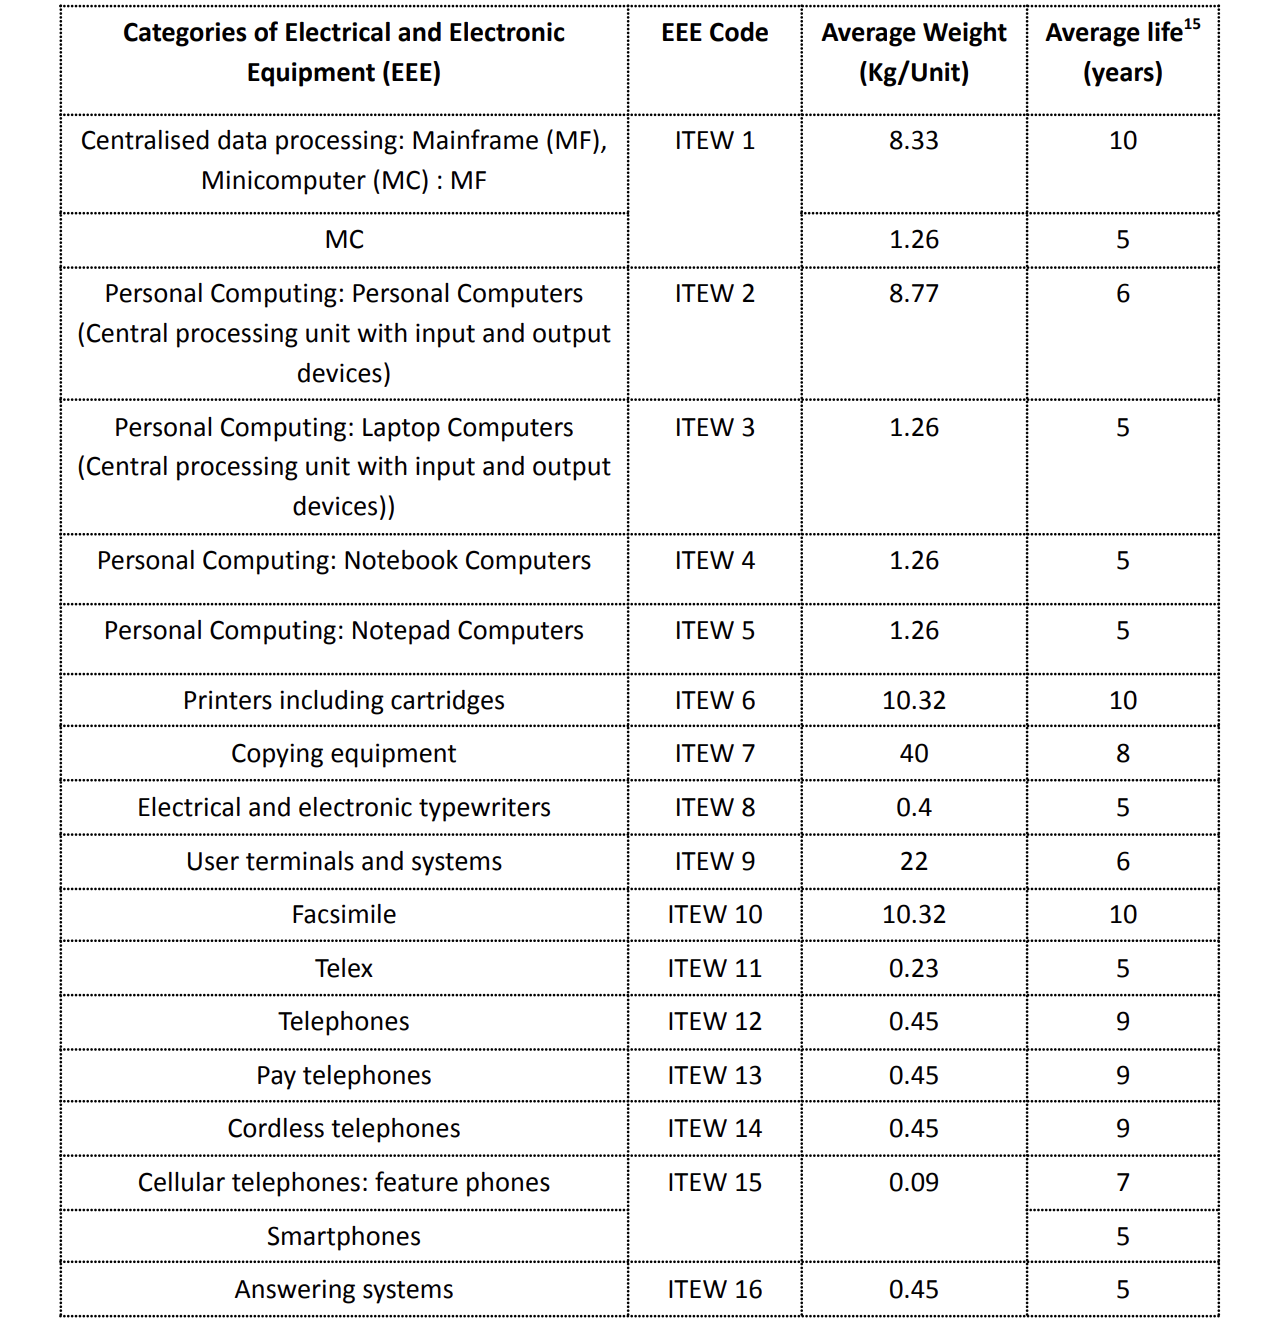
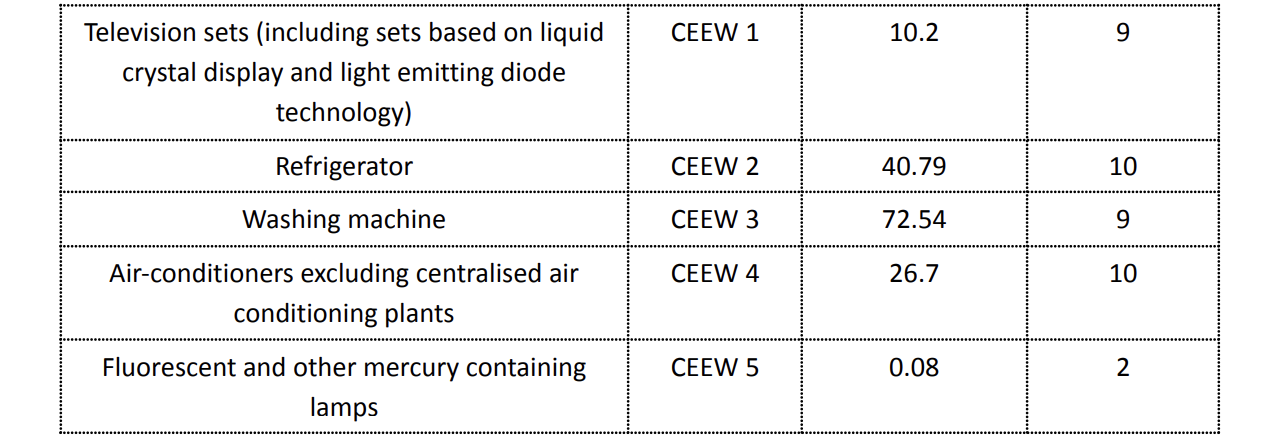
Source: Panchal et al. 2021, EWM Rules
The composition of the 21 e-waste categories is based on the estimated e-waste generation in India from 2017-18 to 2021-22 in a category-wise manner, taken from Panchal et al., 2021.
Table 7: E-waste composition
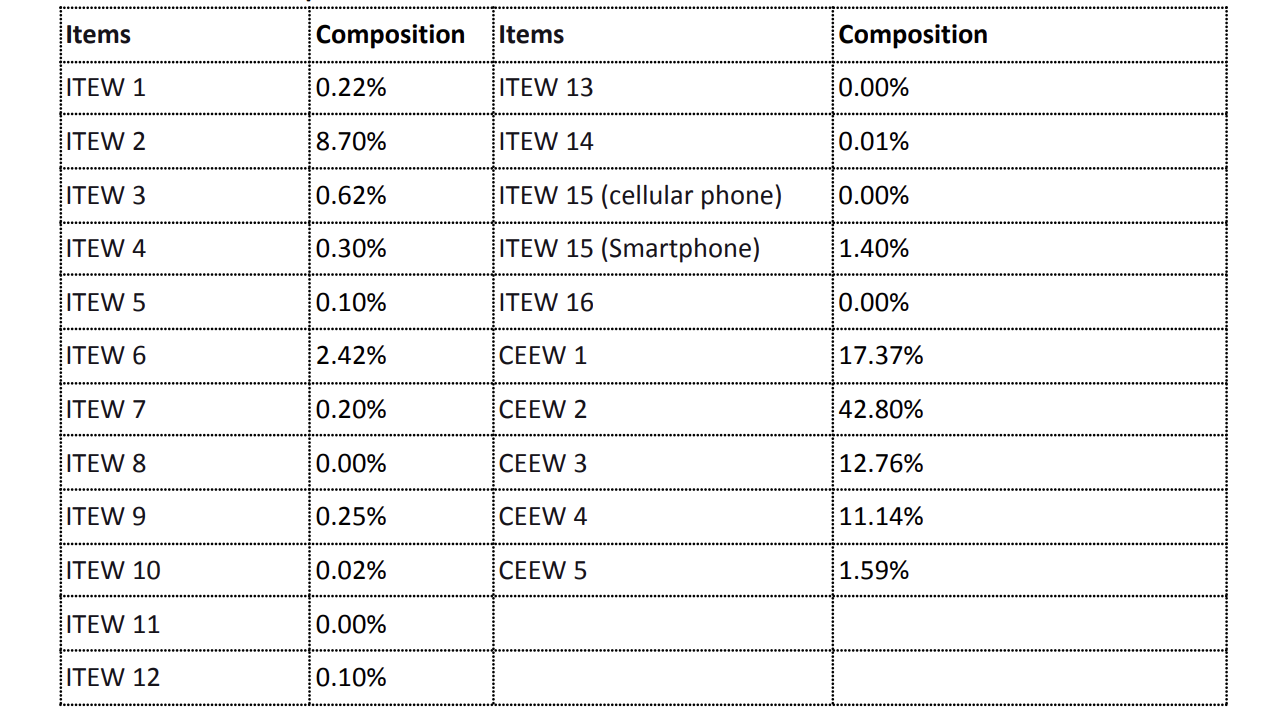
Source: Panchal et al. 2021
ii. Waste recycling
EWM Rules mandate recycling of e-waste under the extended producer responsibility (EPR) obligations which have to be complied with by the producers. In this context, these recycling rates have been considered to be applied to e-waste generated and accumulated in Odisha 16 , to calculate the e-waste to be recycled in tonnes.
Table 8: Recycling targets under the EWM Rules
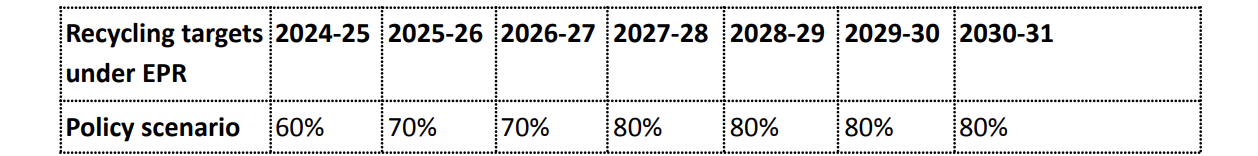
Source: EWM Rules
Based on the above recycling targets, the below quantum of e-waste will be recycled in Odisha:
Table 9: E-waste to be recycled in Odisha till 2030
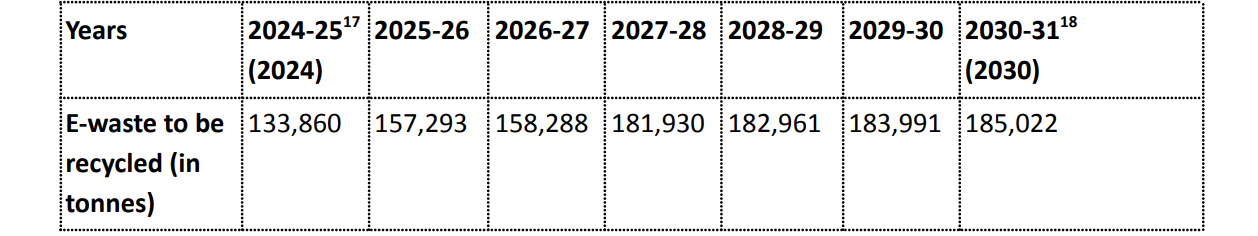
Source: Authors’ analysis using the recycling targets and the projected e-waste accumulation in Odisha
○ The 21 e-waste categories have a composition of materials, such as aluminium, cobalt, copper, gold, silver, iron, tin, etc. During the e-waste recycling process, some materials are recovered and sold to manufacturing industries and/or metal aggregators and the remaining materials are channelised to recyclers, smelters or refineries for further material recovery. 19 In the current analysis, we have only accounted for the jobs at e-waste recycling facilities and not for subsequent processors. Based on the material composition of e-waste categories, their respective material recycling rates were applied to calculate the maximum material recovery from e-waste. This data has been obtained from secondary sources (Panchal et al. 2021).
○ The quantum of recovered materials 20 is multiplied by the market prices to arrive at the market opportunity for this value chain. There is a huge range in the prices of recycled materials depending on their purity. As a result, we have used the price of virgin counterparts as a proxy for recycled materials in this analysis.
○ The prices of the recovered material from recycling e-waste have been taken from secondary sources, primarily from the Indian Bureau of Mines and Daily Metal Prices. The average prices of five years 2019-2023, have been used for the period 2024-2030. These prices are kept constant for the assessment period (2024 to 2030), and any change in the material prices will directly impact the market opportunity. The average prices of the materials are provided below:
Table 10: Average prices of materials
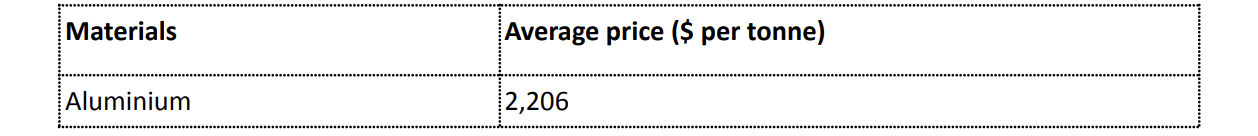
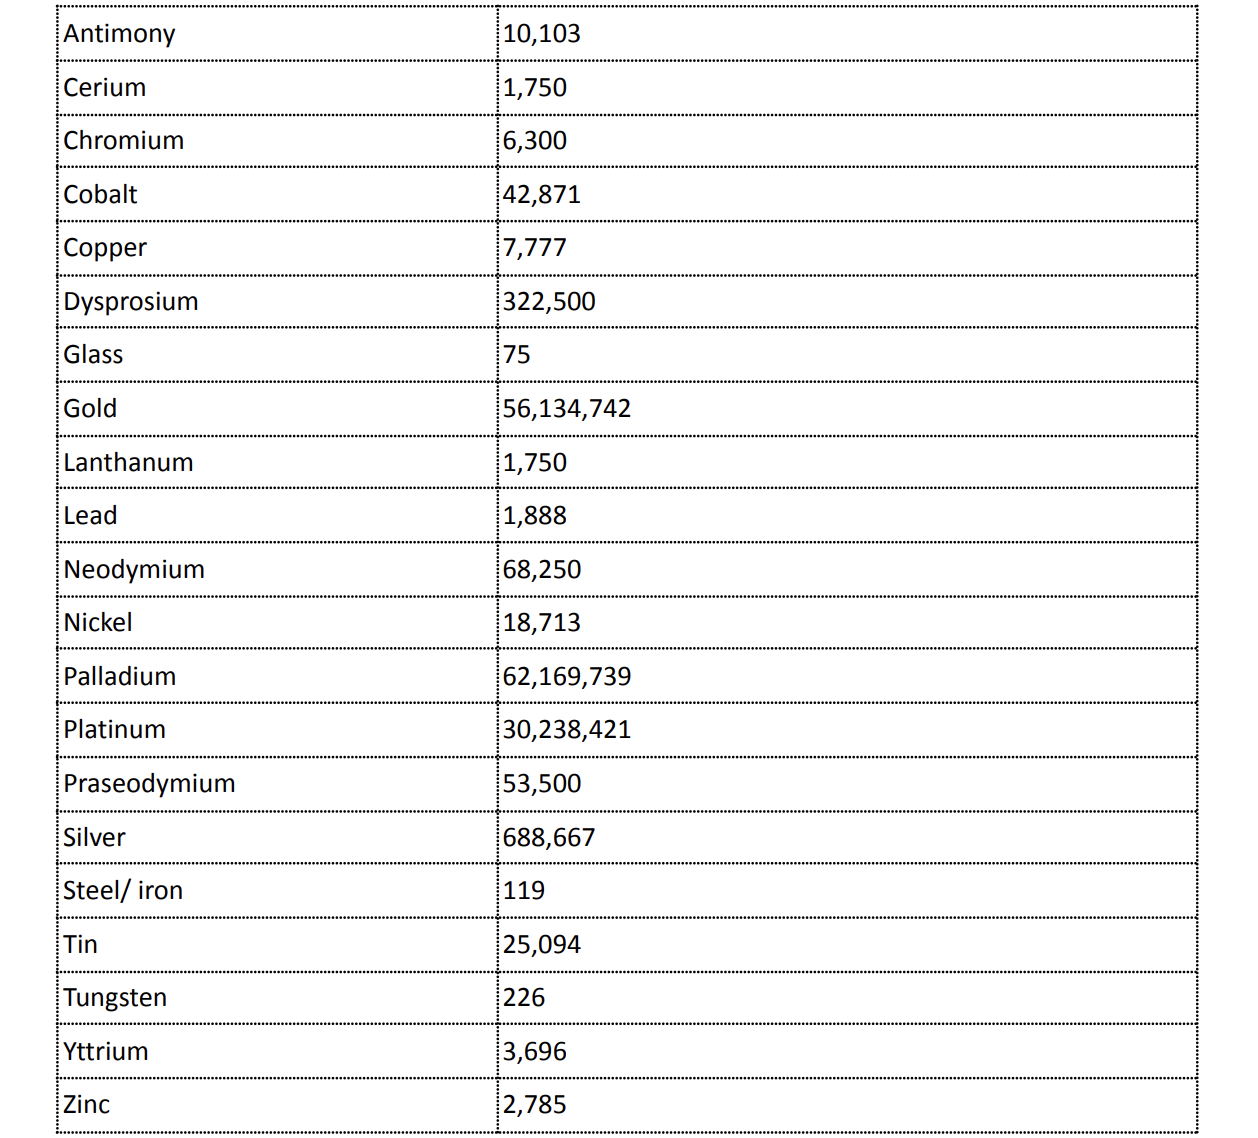
Source: Indian Bureau of Mines and Daily Metal Prices
In this context, the market opportunity for e-waste recycling based on the above scenario and assumption for the period 2024-2030 is 813.3 million USD by recycling 1,183 kilo tonnes of e-waste.
The FTE calculated for recycling related operations is used on the quantum of e-waste recycled. Therefore, under the policy scenario, the total cumulative jobs for the assessment period 2024-2030 is 5,500 for recycling 1,183 kilo tonnes of e-waste.
Investment opportunity is the capital expenditure (capex) to be incurred in setting up the e-waste recycling facilities. This includes the cost of land, building, and machinery. This opportunity has been calculated based on secondary and primary sources (refer to Annexure II).
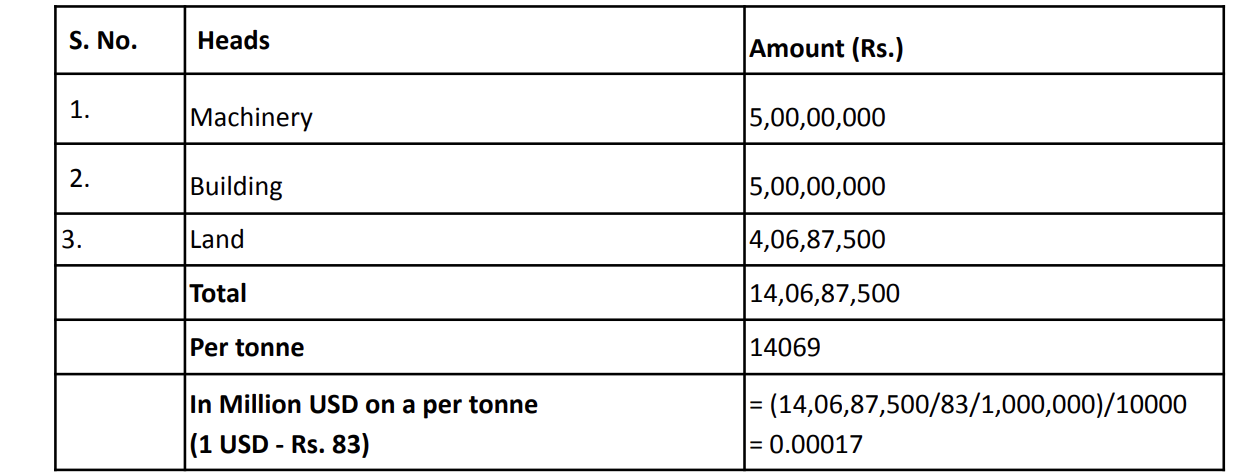
There is limited data available on the cost of setting up an e-waste recycling plant. From one secondary source, it is understood that approximately Rs. 3.7 crores are required to set up an e-waste recycling plant of the capacity of 1,500 tonnes per annum (Engineers India Research Institute n.d.). On the other hand, primary consultations indicate that approximately Rs. 14 crores are required to set up an e-waste recycling plant with a capacity of 10,000 tonnes per annum.
Due to this varied range, an average per tonne capital expenditure was calculated as set out in Annexure II. This came to approximately, Rs. 19,268 per tonne or 0.00023 million USD per tonne.
Using this per tonne capital expenditure, the investment opportunity comes to approximately 42.9 million USD as shown in the table below. The recycling capacity and number of facilities are sized to the maximum waste generated in Odisha, that is, waste generated in the year 2030. The number of plants and their capacities are indicative to showcase the investment potential.
Table 11: Capex requirements
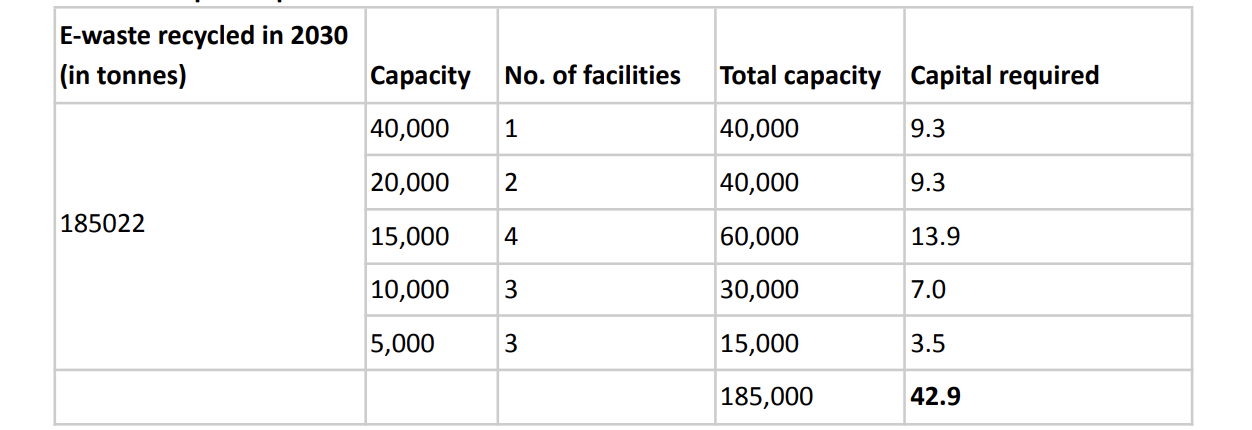
Source: Authors’ analysis
1. Secondary source: Set out below is the capex from the secondary source to set up a 1,500 tonnes per annum e-waste recycling plant:
Table 12: Capex requirement as per secondary sources
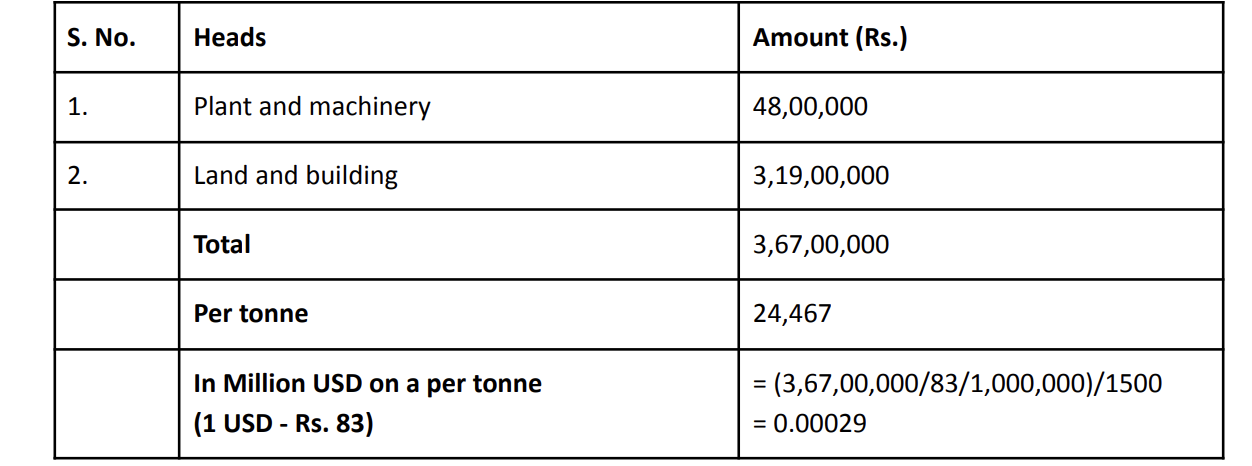
Source: Engineers India Research Institute n.d. and authors’ analysis on it
2. Primary source: Set out below is the capex from the KII to set up a 10,000 tonnes per annum recycling plant:
Table 13: Capex requirement as per KII Source: Stakeholder consultations and authors’ analysis on it
Land rates are based on average land rates of Bhubaneswar and Cuttack per acre:
Table 14: Average rates of Bhubaneswar and Cuttack Industrial Estates
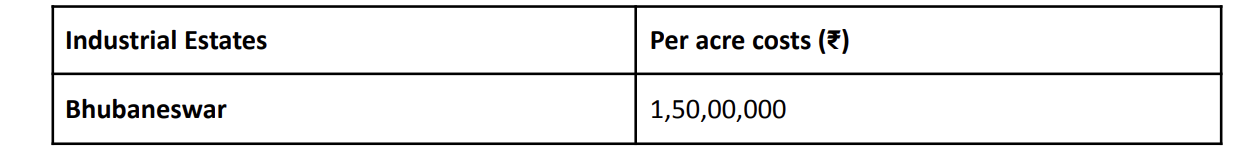

Source: IDCO n.d.
Approximately 3.5 acres’ area of land is suggested to be required for 10,000 tonnes per annum, which will as per the average rates cost about Rs. 4,06,87,500.
Therefore, an average of the primary and secondary sources as set above is used to estimate the investment opportunity for setting up an e-waste recycling plant, i.e., Rs. 19,268 per tonne or 0.00023 USD million per tonne.
Table 15: Estimated capex requirement per tonne
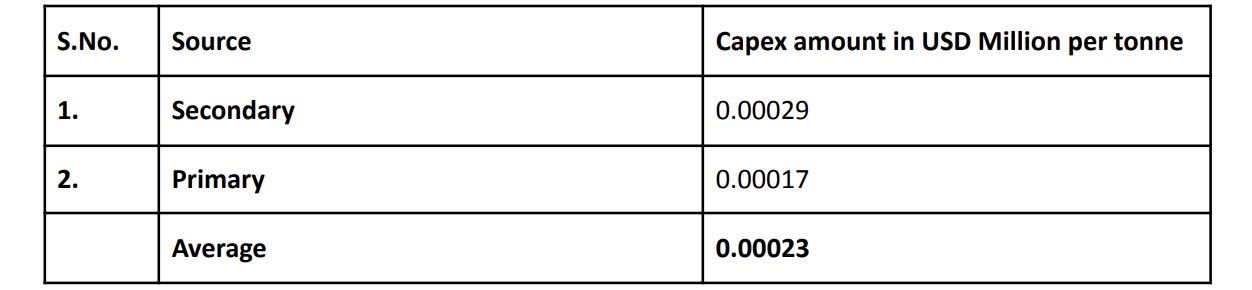
Source: Authors’ analysis on the data from secondary source and stakeholder consultation
ANI News. 2024. “Eco Recycling’s Standalone FY24 Profit Rises by 163 Percent”. Accessed on 28 May 2024.
https://www.aninews.in/news/business/eco-recyclings-standalone-fy24-prof...
Asian Development Bank. 2008. “Civil Society Organization SOURCEBOOK a STAFF GUIDE to COOPERATION with CIVIL SOCIETY ORGANIZATIONS.”
https://www.adb.org/sites/default/files/institutional-document/32629/fil...
Bhutta, M. Khurrum S., Adnan Omar and Xiaozhe Yang. 2011. "Electronic Waste: A Growing Concern in Today's Environment." Economics Research International. 2011, no. 1 (2011): 474230.
https://www.hindawi.com/journals/ecri/2011/474230/
Biswas, Atin and Siddharth Ghanshyam Singh 2020. “E-waste Management in India: Challenges and Agenda, Centre for Science and Environment.” New Delhi: Centre for Science and Environment. https://www.cseindia.org/e-waste-management-in-india-10593
Central Pollution Control Board (CPCB). 2022. “ E-Waste (Management) Rules, 2022.”
https://cpcb.nic.in/uploads/Projects/E-Waste/e-waste_rules_2022.pdf
Ecoreco. 2018. “Eco Recycling Limited Q4 FY-24 Earnings Conference Call.” May 15, 2024.
https://ecoreco.com/wp-content/uploads/2024/05/Eco-Recycling-Q4-FY24-Ear...
Ecoreco. 2023. “Announcement under Regulation 30 of Securities and Exchange Board of India (Listing Obligations and Disclosure Requirements) Regulations, 2015.” September 25, 2023
https://www.bseindia.com/xml-data/corpfiling/AttachHis/755a472a-3794-4a3...
Engineers India Research Institute. n.d. “Detailed Project Report On E-Waste Recycling Unit.”
https://www.eiriindia.org/project-profile-handbook-waste-recycling-unit-...
Golsteijn, Laura, and Elsa Valencia Martinez. 2017. "The circular economy of E‐waste in the Netherlands: optimizing material recycling and energy recovery." Journal of Engineering 2017, no. 1 (2017): 8984013. https://onlinelibrary.wiley.com/doi/10.1155/2017/8984013
Lin, Siyi, Muhammad Ubaid Ali, Chunmiao Zheng, Zongwei Cai, and Ming Hung Wong. 2022. "Toxic chemicals from uncontrolled e-waste recycling: Exposure, body burden, health impact." Journal of Hazardous Materials 426 (2022): 127792.
https://www.sciencedirect.com/science/article/abs/pii/S0304389421027618
Manish , Akanksha, and Paromita Chakraborty. 2019. “Review of E-Waste Management in India: Challenges and Opportunities.” TERI, November 6, 2019.
https://www.teriin.org/article/e-waste-management-india-challenges-and-o...
MeitY. n.d. “EMCD Self-sustainable R&D Centres.” Accessed on January 11, 2024.
https://www.meity.gov.in/centre-excellences
Ministry of Electronics and Information Technology (MeitY). 2021. “CIRCULAR ECONOMY IN ELECTRONICS AND ELECTRICAL SECTOR ACTION PLAN.” Accessed January 11, 2024.
https://www.meity.gov.in/writereaddata/files/Circular_Economy_EEE-MeitY-May2021-ver7.pdf
Ministry of Health & Family Welfare. 2020. “Population Projections for India and States 2011-2036, Report of the Technical Group on Population Projections, Census of India 2011.”
https://main.mohfw.gov.in/sites/default/files/Population%20Projection%20...
Ministry of Housing and Urban Affairs (MoHUA). 2023. “Advisory on E-waste management in Smart Cities.”
https://psa.gov.in/CMS/web/sites/default/files/publication/annexure1_adv...
National Institute of Electronics & Information Technology, Gangtok (NIEIT). n.d. “Paid Courses on E-Waste.” Accessed on January 20, 2024.
https://nielit.gov.in/gangtok/content/paid-course-e-waste-management
Odisha Industrial Infrastructure Development Corporation (IDCO). n.d. Industrial Estate Details.
https://portal.idco.in/Reports/IEstatistics.aspx
Panchal, Rohit, Anju Singh and Hema Diwan. 2021. “Economic potential of recycling e-waste in India and its impact on import of materials.” Resources Policy 74 (2021) 102264.
https://www.sciencedirect.com/science/article/abs/pii/S0301420721002750#...
PIB (Press Bureau of India). 2023. “Generation of E-waste.” July 27, 2023.
https://pib.gov.in/PressReleasePage.aspx?PRID=1943201
Raghupathy, Lakshmi, Christine Krüger, Ashish Chaturvedi, Rachna Arora and Mikael P. Henzler. 2018. “E-Waste Recycling In India – Bridging The Gap Between The Informal And Formal Sector.”
https://greene.gov.in/wp-content/uploads/2018/01/Krueger.pdf
Sengupta, Diyasha, I.M.S.K. Ilankoon, Kai Dean Kang and Meng Nan Chong. 2022. “Circular economy and household e-waste management in India: Integration of formal and informal sectors.” Minerals Engineering 184 (2022): 107661.
https://www.sciencedirect.com/science/article/abs/pii/S0892687522002710
Singh, Narendra, and Oladele A. Ogunseitan. 2022. “Disentangling the Worldwide Web of E-Waste and Climate Change Co-Benefits." Circular Economy 1 (2): 100011.
https://www.sciencedirect.com/science/article/pii/S2773167722000115?via%...
Turaga, R. M. R., Bhaskar, K., Sinha, S., Hinchliffe, D., Hemkhaus, M., Arora, R., Chatterjee, S., Khetriwal, D. S., Radulovic, V., Singhal, P., & Sharma, H. 2019. “E-Waste Management in India: Issues and Strategies.” Vikalpa, 44, no. 3 (2019): 127-162.
https://journals.sagepub.com/doi/10.1177/0256090919880655
Tyagi, Akanksha, Charu Lata, Jessica Korsh, Ankit Nagarwal, Deepak Rai, Sameer Kwatra, Neeraj Kuldeep, and Praveen Saxena. 2022. “India’s Expanding Clean Energy Workforce.” Council on Energy, Environment and Water, Natural Resources Defense Council, and Skill Council for Green Jobs. https://www.ceew.in/sites/default/files/Green-Jobs-Report-Jan27.pdf
UN (United Nations - Department of Economic and Social Affairs Economic Analysis). 2023. “UN DESA Policy Brief No. 153: India overtakes China as the world’s most populous country.”
https://desapublications.un.org/policy-briefs
Wangchuk, Rinchen Norbu. 2021. “Mumbai Firm Recycles 7200 Tons of E-Waste Yearly, Launches Free App for Home Pickup.” The Better India. April 07, 2021.
https://thebetterindia.com/252476/mumbai-e-waste-recycling-discard-dead-...
World Health Organisation, 2023. “Electronic waste (e-waste)”.
https://www.who.int/news-room/fact-sheets/detail/electronic-waste-(e waste)#:~:text=E%2Dwaste%20contains%20multiple%20known,and%20function%20of%20the%20lungs
Zhang, Kai, Jerald L. Schnoor, and Eddy Y. Zeng. 2012. “E-Waste Recycling: Where Does It Go from Here?” Environmental Science & Technology 46 (20): 10861–67.
https://pubs.acs.org/doi/10.1021/es303166s