Council on Energy, Environment and Water Integrated | International | Independent
India reportedly generates approximately four (CPCB 2021) to nine (MoHUA 2021) million tonnes of plastic waste annually, of which 13 to 60 per cent is recycled (CPCB 2021; MoHUA 2021). Some of the remaining plastic waste is processed through co-processing, plastic to road, etc. The rest is managed irresponsibly and is often littered or dumped, leading to environmental degradation. Packaging is the primary driver of plastic waste, representing about 59 per cent of the total plastic consumed in India (PlastIndia Foundation 2023). This demand will only increase with the growth and development of sectors such as pharmaceuticals, retail, fast-moving consumer goods (FMCG), etc., along with demand for plastic in other sectors such as construction and agriculture (FICCI and Accenture 2020).
As per Odisha State Pollution Control Board’s Annual Report on Implementation of Plastic Waste Management Rules, 2016 for the year 2022-23, 65 per cent of the plastic waste generated in Odisha, was recycled. There is an urgent need to effectively tackle the growing problem of plastic waste and reduce reliance on virgin plastic. In this context, a local plastic recycling industry with supportive compliance processes and infrastructure and an enabling policy environment holds immense employment opportunities and market potential.
Jobs overview
● A total of 23,000 direct FTE jobs can be generated through mechanical recycling of 7,000 kilo tonnes of cumulative plastic waste in Odisha during 2024-2030. These estimates are for an ambitious scenario, which assumes that Odisha will serve as a recycling hub for plastic waste in eastern India. In such a scenario, it will be able to process additional waste from neighboring states like Chhattisgarh, Jharkhand, and West Bengal in its recycling facilities.
Market Opportunity
● 1,000 million USD is the revenue potential for 2030 from the mechanical recycling of 1,000 kilo tonnes of plastic waste in Odisha under the ambitious scenario.
Investment Opportunity
● 200 million USD is the investment opportunity (or capital expenditure 6 ) to set up plastic waste recycling capacities of 1,000 kilo-tonnes per annum in Odisha under the ambitious scenario.
Annexure I contains the detailed methodology.
● Prevention of environmental degradation: The proliferation of plastic use and inadequate waste management systems can lead to plastic waste being disposed of in dumpsites or water bodies or burnt. Diverting plastic waste from water bodies can reduce marine pollution, the release of microplastics, and the negative impact on marine ecosystems (OECD 2018). Similarly, plastics disposed of in landfills or dumpsites can degrade and leach into the soil and the water table and reach the food chain, potentially causing health hazards (Bhattacharya et al. 2018). Open burning of plastic waste releases toxic gases such as dioxins, furans, mercury, and polychlorinated biphenyls into the atmosphere, which can cause severe health risks such as heart diseases and aggravate respiratory ailments, among others (Verma et. al. 2016). In this regard, diverting plastic waste towards recycling will prevent indiscriminate disposal and related environmental contamination.
● Reduction in use of virgin plastic: Several recyclers are recycling bottles, both food grade and otherwise, for manufacturers to produce recycled bottles (Verma et al. 2016). Similar applications of recycled plastic can displace the requirement of virgin plastic, reduce oil usage and emissions of greenhouse gases (GHGs) associated with its production (Hopewell et al. 2009), and maximise the life of existing plastic. For instance, studies have shown that the use of a recycled PET bottle of 750 ml instead of virgin PET would reduce the total life-cycle emissions from 446 to 327 g CO2 per bottle, resulting in a 27 per cent relative reduction in emissions (Hopewell et al. 2009, WMW 2008).
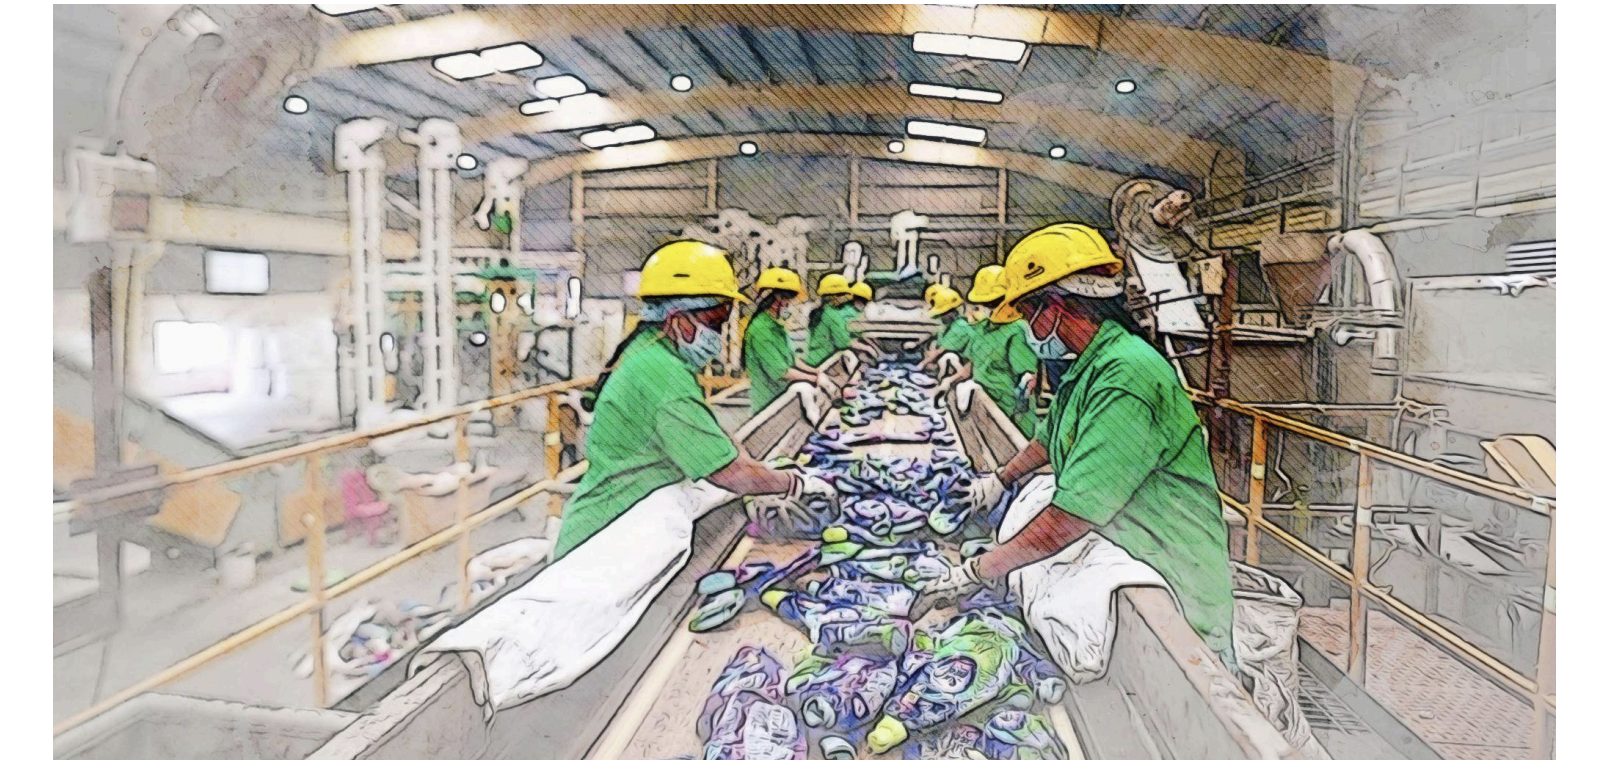
● Arresting migration: Recyclers require unskilled and semi-skilled labour to perform most of the operations in a recycling plant. 9 Unskilled labour with on-the-job training can undertake considerable operations at recycling facilities. Migration is a key survival strategy for millions in rural Odisha (Gram Vikas 2021), with some regions seeing over 89 per cent migration (Labour and ESI Department 2020). In this regard, employment opportunities in the recycling sector can provide local employment to a certain extent and arrest the migration of workers to other states. Moreover, with Odisha as a robust recycling hub, employment opportunities will arise at stages prior to plastic recycling, including primary and secondary collection, segregation and sorting of plastic waste in materials recovery facilities, and transportation to recycling facilities.
Banyan Nation is one of India’s first vertically integrated plastic recycling companies, with a cumulative capacity of 12,000 tonnes (Banyan Nation n.d.; Khanna 2023). The company has developed a data-based platform to track the plastic waste recycling supply chain, which facilitates the integration of the informal sector into its collection operations. This platform has also been extended to municipalities. Banyan Nation processes high-density polyethylene and polypropylene plastic, such as detergent and toilet cleaner bottles. The collected plastic is cleaned using proprietary technology to eliminate contaminants from products and packaging, after which it is recycled and converted into high-quality granules. These are then sold to manufacturers to reduce the consumption of virgin plastic.
1. Role of departments:
● Odisha State Pollution Control Board (OSPCB) - OSPCB to fast-track the issuance of consents and approvals to the recyclers, preferably through its single-window portal, and regularly conduct audits and inspections of the recyclers' facilities to verify the fulfillment of their obligations and generation of extended producer responsibility (EPR) credits corresponding to their capacities.
● Industries Department - Odisha to create new industrial parks or allocate space in existing parks, such as Paradeep Plastic Park 10 for plastic waste recycling (Singh 2021), including for research around technologies to improve recycling processes. Coupled with fiscal and non-fiscal incentives and subsidies, this will encourage recyclers to establish their units in Odisha as they can leverage the shared infrastructure and reduce the investment required to set up a recycling facility. For instance, Rajasthan has created a dedicated industrial area for waste recycling with incentives on goods and services tax (GST), capital subsidy, training subsidy, and exemption on duties, among others. It will be a step forward from the Standard Operating Procedure (SOP) For Decentralised Solid Waste Management in the State of Odisha (amended in 2020 and 2022) issued by the Housing and Urban Development Department (H&UDD). Incentives to manufacturers using recycled materials in their products and packaging can also be explored as an indirect encouragement to the recycling sector.
● Local bodies to undertake a granular quantification and characterisation of plastic waste generated in their jurisdiction to size the recycling capacity needed in the state (CPCB 2015; Shriram Institute for Industrial Research 2020). The local bodies can use this data to enter into long-term contracts with recyclers individually or with proximate local bodies. This model can also be integrated with the EPR system, wherein these recyclers can give EPR credits of recycled plastic to producers, importers and brand owners (PIBOs). Such agreements will assure recyclers of a minimum supply of a particular type, quality, and quantity of plastic waste from authorised channels, thereby promoting accountability and traceability of recycling processes. As the revenue from plastic waste recycling is intertwined with the quality of waste, the local bodies strengthen the segregation and collection mechanisms to minimise contamination of the plastic waste they receive. This must accompany building capabilities of waste management personnel, including those in the informal sector.
● The Housing and Urban Development Department (H&UDD) to identify the quality-related requirements of the recyclers for plastic waste and include them in the existing SOP. This may include washing plastic waste contaminated with food waste at the source by the waste generators so that the recyclers can channel and accept clean plastic waste for recycling. In addition, efforts should be sustained to integrate the informal sector waste pickers into the formal supply chain through different methods, including purchasing plastic from them, employing them in the MRFs, or providing space for sorting plastic waste.
● Central Pollution Control Board (CPCB): The new EPR portal has proven to be extremely challenging to use and to enter the required data. The CPCB could extensively test various features of the EPR portal and consult with stakeholders to resolve their doubts and provide clarification. Further, recyclers and their association, such as Material Recycling Association of India (MRAI) to be consulted while finalising features of such portals to ensure ease of use. Some of the recommendations by the recyclers include an increase in automation to avoid multiple manual entries, avoiding frequent revisions, etc.
2. Potential role of the private sector:
● Recyclers can initiate tie-ups with local bodies in the state with relatively higher segregation levels for the supply of recyclable plastic waste.
● Recyclers should obtain third-party globally or nationally recognised certifications for their recycled plastic to enhance the credibility of their products and increase acceptability (Pretner, Darnall, Testa, and Iraldo 2021). These may include seeking approval from the Food Safety and Standards Authority of India (FSSAI) for food-grade recycled PET or European Certification of Plastics Recycling, among others.
● Recycling associations such as MRAI, etc., should collaborate with the producers and local bodies to collaborate and communicate the requirements of (i) producers on the quality of recycled plastic for major applications and (ii) recyclers from local bodies for the quality of plastic waste required for recycling (Washington State Department of Ecology 2020).
● Producers and brand owners should improve the manufacturing processes, including raw materials used and product design, to support end-of-life recycling of their products and packaging. The current practices of using different grades of polymer together, and mixing plastic with other materials like adhesives, paper, metal, and inks render recycling difficult (Hopewell et al. 2009).
● Issues of waste segregation and supply of plastic waste: Procurement of good quality plastic waste is one of the biggest challenges for recyclers. Plastic waste is collected as part of municipal solid waste, which lacks source segregation, leading to contamination of potentially recyclable waste (Kapur-Bakshi, Kaur and Gautam 2021). The contaminated plastic waste becomes feedstock for co-processing, incineration, waste to energy plants, and plastic to roads or landfills, thereby reducing the feedstock for recycling.
Way forward: Building on their progress under the existing Standard Operating Procedure (SOP) For Decentralised Solid Waste Management in the State of Odisha (amended in 2020 and 2022), H&UDD should enhance their efforts to integrate self-help groups (SHG) and the informal sector associations. This can be done via direct or indirect employment to the informal players or providing secured space for sorting waste and/or sale of plastic. Furthermore, H&UDD, in conjunction with the local bodies and plastic waste recyclers, should initiate training sessions for the informal sector and the sanitation staff on the quality requirements for plastic waste. The recyclers can display the different qualities of plastic waste and take them through the process of quality control maintained by them at recycling facilities.
In addition, the local bodies should facilitate data management at the MRFs, wherein data should be recorded on the quantities of different categories of plastic waste as set forth under the Plastic Waste Management Rules, 2016, and compared with how much of these quantities were ultimately accepted by the recyclers for recycling. Ministry of Housing and Urban Affairs’ (MoHUA) Sansaadhan portal 13 can be used to capture this data and make it available for recyclers. This will help in understanding the quality requirements for recycling, undertake training for the personnel involved in collection, transportation, and at the MRFs along with the informal sector, and reduce the recyclable waste being channelised to the cement plants for co-processing. Based on the performance, incentives can be provided to the SHG members and/or the informal sector. Detailed SOPs can be issued to streamline this process. In addition, this can also improve the feedstock quality and quantity of ‘difficult-to-recycle’ plastic waste as and when the respective recycling technology upgrades (Musso et al. 2022).
Segregation at source in the desired manner can be achieved by bringing behavioral change among the waste generators. Regular and robust door-to-door campaigns must be held to explain source segregation of waste and removal of contamination from the plastic waste to ensure that it remains recyclable. In addition, awareness campaigns can be held through radio jingles, speakers on waste collection vehicles, social media, etc. Incentives such as points that can be claimed at grocery stores, zero waste tags, etc., can be provided to identified households in each ward in the initial months to encourage active participation (Biswas et al. 2021). Further, encouraging onsite or home or community composting by the citizens can be a complementary approach to achieving source segregation of waste.
● Low adoption of recycled plastic due to perceptions of its quality: Several international brands such as Coca-Cola, Pepsi, and Unilever (Paben 2021) are actively and consciously accepting post-consumer recycled plastic bottles to meet their sustainability mandates. On the contrary, domestic producers often perceive recycled plastic to be of lower quality than its virgin counterpart. 14 This perception is driven by the fact that there is a considerable variation in the quality of recycled plastic supplied by recyclers.
Way forward: To overcome this, the recyclers should conduct workshops for producers and their associations, such as the All India Plastics Manufacturers Association (AIPMA), to look beyond pricing and adopt recycled plastics of mutually acceptable grades to promote circularity. Furthermore, the provisions for minimum use of recycled content in plastic packaging under the PWM Rules should be enforced and gradually increased to ensure its consistent uptake.
Producers also state that there is a lack of supply of recycled plastics that meet their unique specifications, especially for packaging (WSDE 2020). In this regard, they can refer to globally accepted certifications such as European Certification of Plastics Recycling, Association of Plastic Recyclers (APR): PCR (Post Consumer Recycled) Certification Program, among others that the recyclers can obtain to ensure the quality of recycled plastic.
● Unfavourable economics of plastic waste recycling: Although the commodity prices for recycled and virgin plastic vary, recycled plastic can sometimes be more expensive than its virgin counterpart, particularly when it is of high quality. 15 The primary reason is the high cost of procuring high-quality, uncontaminated waste and sorting it into different categories, among others, to produce quality recycled plastic. 16 Due to weak market linkages (Singh 2021) and the unwillingness of the clients to pay a premium for recycled plastic, there is hesitation in the uptake of recycled plastic. 17 It should be taken into account that prices of both virgin and recycled plastic fluctuate based on market forces (Lee Julian 2019; Chattopadhyay and Kumar 2020).
Way forward: In order to increase the uptake of recycled plastic and bring stable and regular parity in the costs, various departments, such as the Department of Industries, should support the plastic recycling industry to improve the economics of plastic recycling. Some recommendations include stricter implementation of Plastic Waste Management Rules, 2016 (“PWM Rules”) without relaxations of provisions, creating markets for recycled plastic, setting up plastic or resource recovery parks, and scaling R&D of recycling technologies. Incentives or subsidies should be extended in the form of land, plant and machinery subsidies, exemption from electricity duty, etc., to reduce costs. Further, plastic parks such as Paradeep Park in Odisha can establish links between the upstream and downstream supply chain and facilitate the uptake of recycled plastics by manufacturers. Such a mechanism will also reduce the transportation of recycled plastic, which has been highlighted to be a cost-incurring activity. Plastic parks or resource recovery parks with upstream and downstream industries can also facilitate common infrastructure or facilities, secure supply chains, and improve margins for the recyclers. Policies for industrial promotion and investment facilitation in Odisha, can extend similar benefits to the recycling sector to capture the end-to-end supply chain and ecosystem.
● Environmental risks:
1. Plastic often contains toxic chemicals, and a lack of processes to remove them can result in harmful chemicals being present in recycled plastic. This can expose consumers to chemical contamination from products made from recycled plastic. These risks can be avoided by central regulations setting recycling and chemical safety standards for both virgin and recycled plastic products (Mahesh et al. 2024). Additionally, unscientific plastic waste recycling can increase pollution rather than reduce it. OSPCB should periodically audit recyclers for compliance (GHMC 2020).
2. Low-value plastic and multi-layered plastic, due to their lesser value and non-recyclability when compared to other plastics (Singh 2021), continue to be littered and disposed of improperly. This plastic either ends up in landfills or drainage systems or is burnt, leading to environmental degradation. In this regard, local bodies track the collection of this plastic through their waste management systems and ensure its safe disposal.
The scope of the plastic waste recycling value chain is limited to post-consumer activities that includes purchase of plastic waste (by a procurement team) from different suppliers, unloading of plastic waste from vehicles, storage, washing, shredding, extrusion and pelletisation and packing of recovered materials. These jobs are created at or by a recycling plant.
Activities prior to recycling, which include primary door-to-door collection, sorting of non-biodegradable waste at materials recovery facilities (MRFs), and transportation to recycling facilities, are not included in the current scope of the analysis due to data unavailability. For the purpose of employment estimation, the scope excludes corporate functions of the recyclers, such as accounts, human resources, legal, etc., and ancillary activities related to insurance, banking, chartered accountants, etc. These functions are not directly linked to the operational capacity of the recycler. Therefore, only direct jobs from recycling operations are estimated in this analysis.
● Direct jobs are further converted to a full-time equivalent (FTE). The full-time equivalent or job year is defined as simply a ratio of the time spent by an employee on a particular task/project in a given year to the standard total working hours in that particular year. The FTE formula translates short-term or one-time employment into a full-time equivalent or job-year (Tyagi et al. 2022).
● In this analysis, FTE for recycling operations is the number of workers engaged in the recycling operations in a year divided by the quantity of waste recycled in a year.
● Key informant interviews (KIIs) were conducted with identified stakeholders in the plastic waste recycling ecosystem in order to arrive at the FTE. The interviews focused on the number of workers employed for plastic waste recycling operations, average capacity utilisation, challenges and risks for the ecosystem, skilling requirements, etc.
● The market opportunity is estimated as the revenue accrued by selling recycled plastic pellets/granules or chipboards from multi-layered plastic (MLP).
● Investment opportunity refers to the capital expenditure to be incurred in setting up the plastic waste recycling facilities. This includes the cost of land, building, and machinery.
Three scenarios were developed for estimating the market, investment and employment opportunity. These are business as usual (BAU), policy, and ambitious. These differ in the quantum of waste and recycling targets.
KIIs were conducted with identified players to calculate the plastic waste recycling FTE and estimate jobs.
● A mix of purposive and convenience sampling strategies was used to identify the stakeholders for KIIs.
● Three KIIs were conducted, representing annual recycling capacities between 6,000 to 15,000 tonnes. The stakeholders were engaged in the following activities: purchase of plastic waste from different suppliers, unloading of plastic waste from vehicles, storage, washing, shredding, extrusion and pelletisation, and packing of recovered materials.
● Questionnaires were used to gather information and data from the respondents. The broad heads under the questionnaire included specifications of the recycling plants such as capacity, area, workers deployed for different activities, etc., and stages of recycling. There were also qualitative questions on skill requirements at different stages of recycling, risks associated with the recycling ecosystem, prevalent challenges in the ecosystem, and interventions that can potentially solve them.
Annual FTE for plastic waste recycling is computed as:
Full-time equivalent (per Kilo tonne) = Total Number of worker employed for recycling for recycling operation /
Total waste recycled in the year (in kilo tonne)
Table 1: Annual FTE calculated using data received from the KII
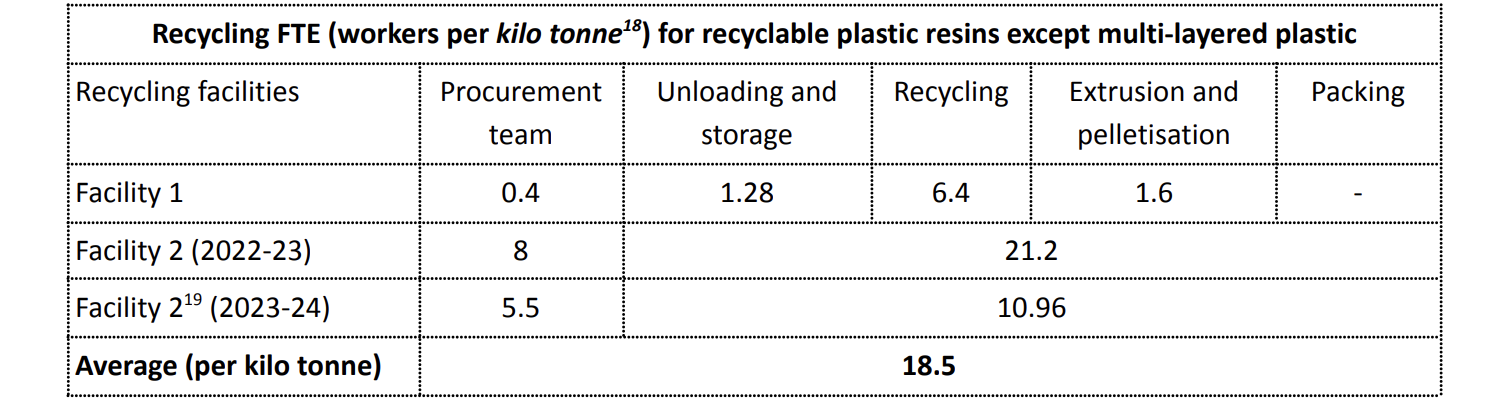
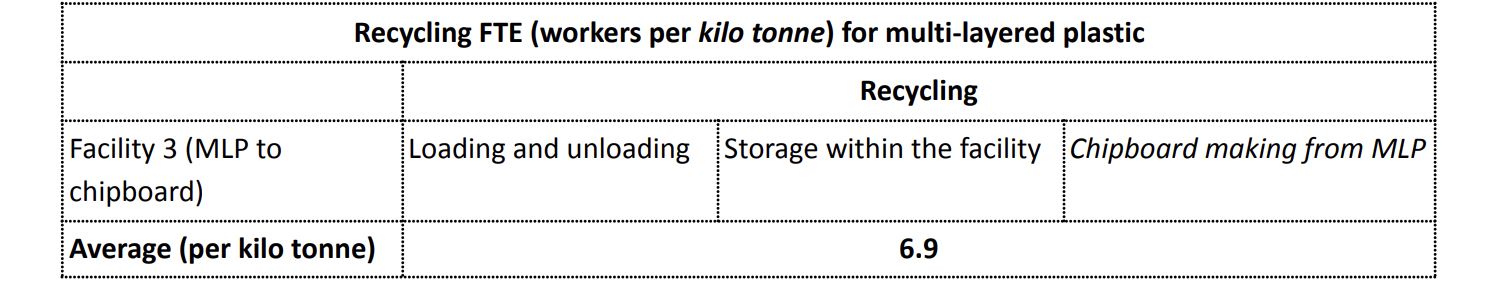
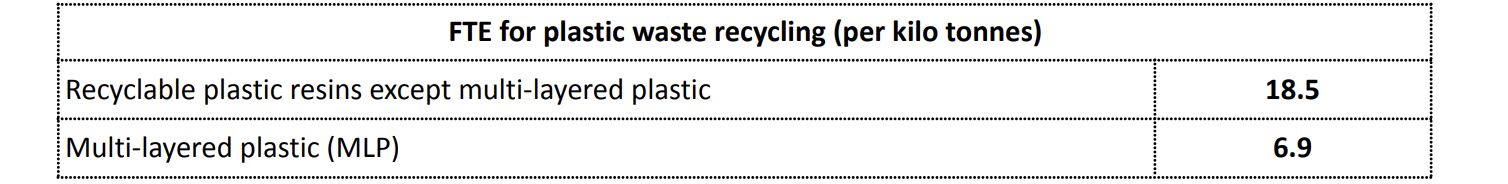
Source: Authors' analysis based on stakeholder consultations
It should be noted that this analysis does not consider any reduction in employment due to increased automation of various recycling operations.
The market opportunity has been estimated from the sale of recycled plastic pellets/granules and chipboards made from MLP, within or outside Odisha. The following methodology was used to calculate the market opportunity across the three scenarios.
● First, the plastic waste generated and/or accumulated in Odisha was projected from 2024-2030 under different scenarios, as discussed in the sections below. Thereafter, recycling rates under these scenarios were applied to calculate the plastic to be recycled. Next, this number was multiplied with recovery rates, applicable for the chosen recycling process, to calculate the quantum of recycled plastic. Lastly, recycled plastic was multiplied with market prices to estimate the revenue from recycling. The market opportunity is therefore, a summation of the quantum of product and price of all recoverable materials from plastic waste:
Market opportunity (USD) = ∑(Recovered material from plastic waste (Kg) ) i * (market price (USD/Kg) )
i indicates the recoverable materials from the plastic waste
USD to INR = 83
● The following sections detail out these three stages:
i. Plastic waste generation
Plastic is categorised into two main categories: thermoplastics and thermosets. Thermoplastics, including resins such as PET, PE, PVC, PP, and PS, which are recyclable, while thermosets such as ABS (Acrylonitrile Butadiene Styrene) PU (Polyurethane), etc., present greater recycling challenges. The model categorises the plastic waste into PET, PE, PVC, PP, PS, MLP and Others.
Table 2: Composition of plastic waste
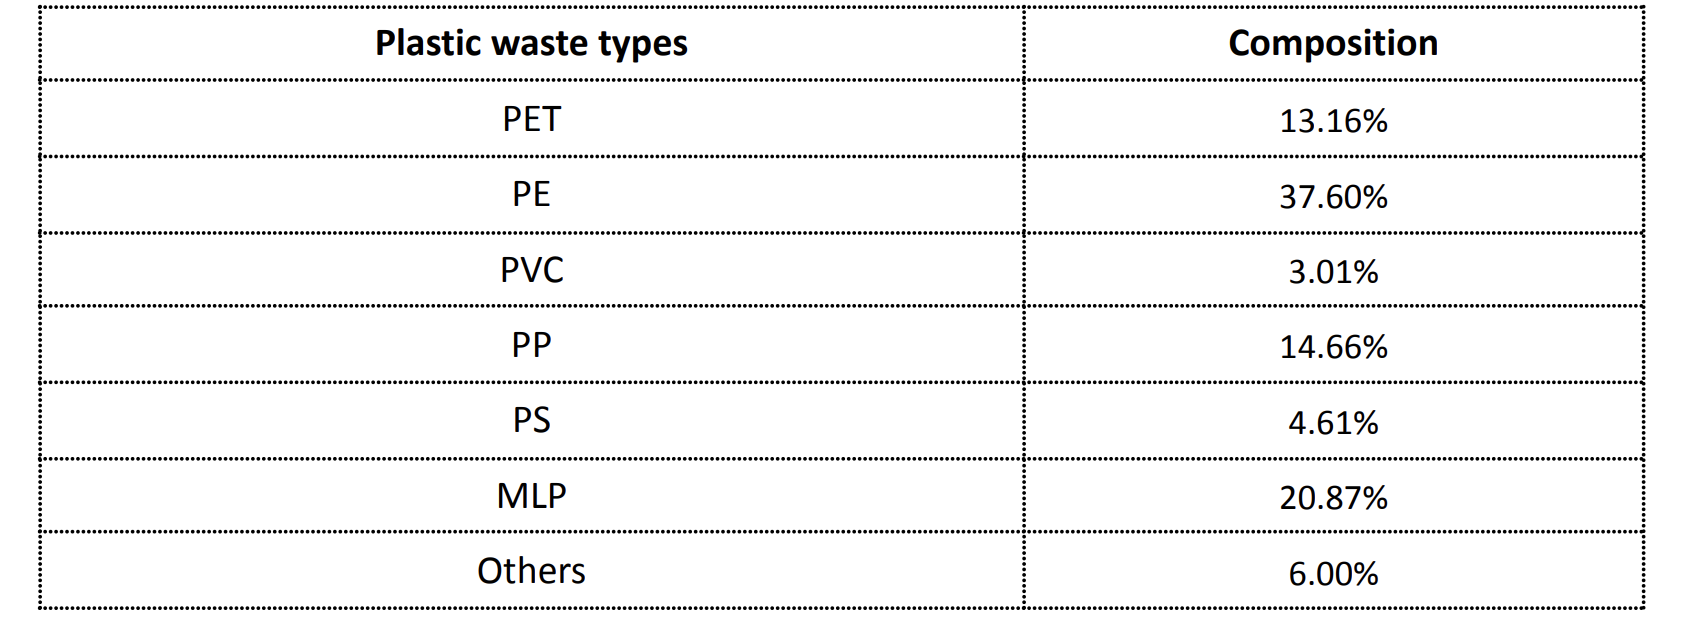
Source: CPCB 2015, CPCB 2024
As per the Central Pollution Control Board (CPCB) report on assessment and characterisation of plastic waste generation (CPCB 2015), 6 per cent of the plastic waste is of the “Others” category, which includes thermoset plastic. The "Others" category has not been considered as a part of this analysis. The remaining 94 per cent has been considered for the current analysis, and has been calculated based on CPCB 2015 and CPCB’s Draft Standard Operating Procedure (SOP) for Characterization and Assessment of Plastic Waste Generation (CPCB 2024). Due to data unavailability of plastic waste into different categories for Odisha, India level composition has been used for state-level analysis.
ii. Recycling and recovery rates
It is assumed that all the plastic waste generated will be collected. Thereafter, recycling rates were applied to calculate the plastic waste quantum to be recycled. Scenario specific recycling rates are detailed in the sections below.
To calculate the quantum of recycled plastic that will be recovered post recycling, plastic waste quantity of each resin is multiplied with respective recovery rates. As more than 90 per cent of plastic waste is recycled mechanically (Shankar et al. 2022), this study models mechanical recycling. The recovery rates have been taken from literature and shown in the table below (Antonopoulos 2021):
Table 3: Recovery rates of plastic recycling
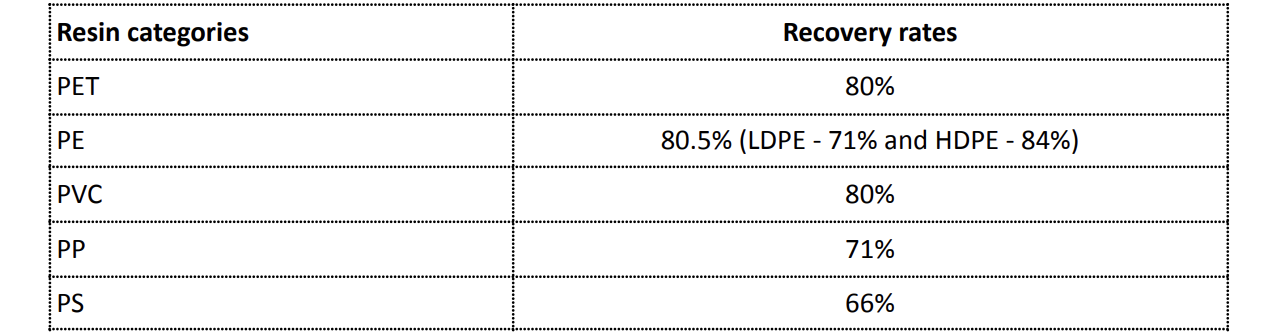

Source: Antonopoulos 2021, stakeholder consultations
Note: PET - polyethylene terephthalate, PE - polyethylene, PVC - polyvinyl chloride, PP - polypropylene, PS - polystyrene and MLP - multi-layered plastic.
The recovered materials are then multiplied with the current market prices of the recycled plastic based on the different resin types on a per tonne basis to arrive at the market opportunity.
The current prices of the recovered plastic from recycling plastic waste have been taken from primary consultations and secondary sources, primarily from IndiaMart. Since the prices vary with color and form, an average price based on the varied prices has been considered for different resins. The current prices are kept constant for the assessment period (2024 to 2030). It should be noted that these prices are subject to market fluctuations on a regular basis and any change in these prices will directly impact the market opportunity.
Table 4: Prices of recycled plastic
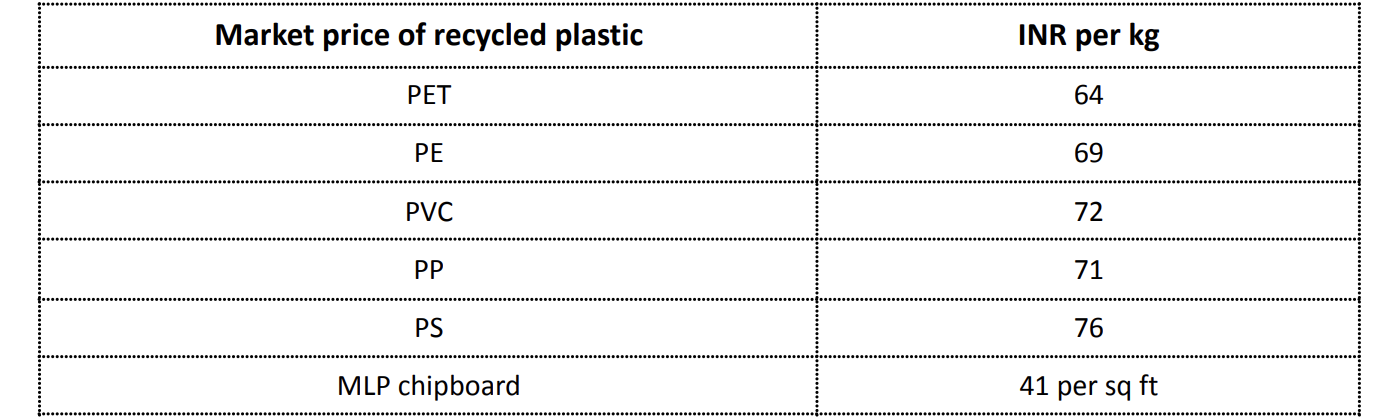
Source: Stakeholder consultations, IndiaMart
Scenarios for market opportunity
1. Business as usual (BAU) scenario
The BAU scenario builds on the CPCB and OSPCB reported data on plastic waste generated and recycled to estimate the market opportunity.
○ Waste generation
The plastic waste generated in Odisha for the BAU scenario for the period 2016-2023 has been taken from the CPCB and OSPCB Annual Reports on the Implementation of the Plastic Waste Management Rules, 2016 (PWM Rules). Thereafter, plastic waste generation has been projected using a compound annual growth rate (CAGR) based on the period 2019-23, i.e., 5.87 per cent as set out below. The CAGR is taken for 2019-23 since there appears to be a significant rise and dip in the prior years which could be due to reporting or collection related reasons.
Table 5: BAU – Plastic waste generation and its projection till 2030
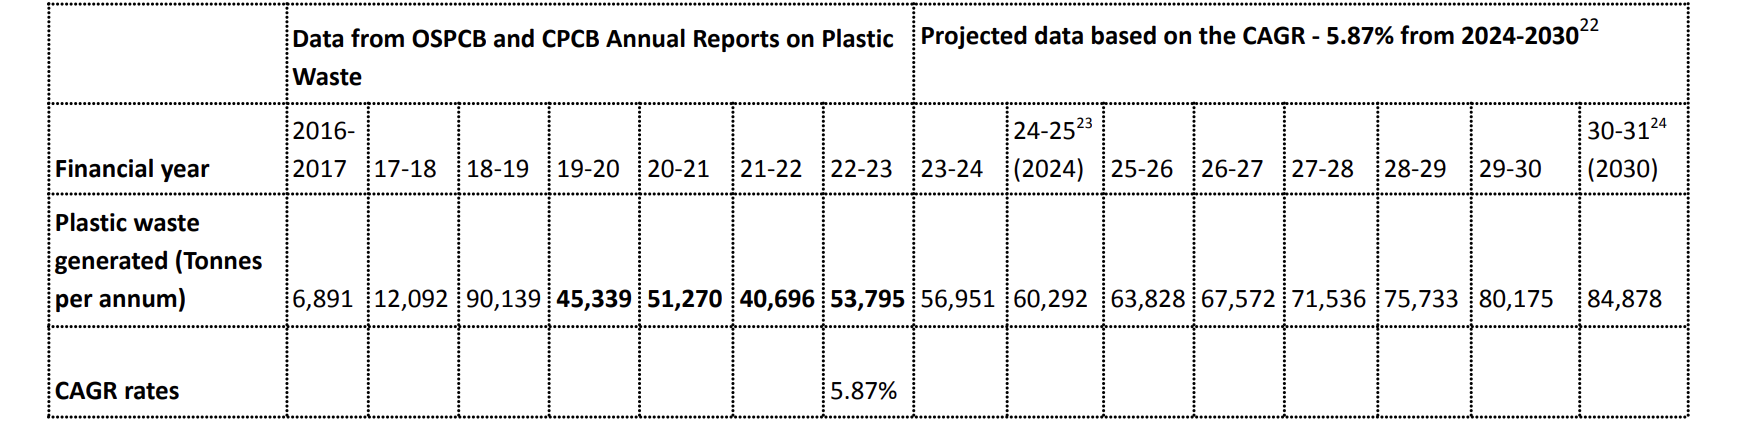
Source: Plastic Waste Annual Reports of OSPCB and CPCB and authors’ analysis on them
○ Waste recycling
As per the OSPCB Annual Report on Implementation of PWM Rules for the year 2022-23 (OSPCB 2023), approximately 65 per cent of the plastic waste generated is recycled in the state. The report also suggests that Odisha has nine registered plastic waste recyclers, out of which only two could be identified through desk research.
Therefore, under the BAU scenario it is assumed that the 65 per cent recycling rate remains constant for the assessment period 2024-2030 for all plastic resins except MLP. Given that MLP is currently mostly channelised to cement plants for co-processing, any opportunity from MLP recycling is assumed to be currently nil. In this context, the market opportunity for the BAU scenario for the assessment period of 2024-2030 cumulatively is 151 million USD.
Note: It should be noted that this analysis does not consider any inflow or outflow of plastic waste from the state of Odisha.
2. Policy scenario
The policy scenario models the demand and lifecycle of plastic packaging to estimate the plastic waste generated in Odisha. It also uses the EPR targets mentioned under the PWM Rules to estimate market opportunity.
○ Waste generation
The plastic waste generated in Policy scenario is calculated by life cycle modelling of plastic consumed for packaging. Currently, in India, the demand for different resins is increasing at varied rates as set out in the table below (PlastIndia Foundation 2023). This demand rate is kept constant for the assessment period (2024 to 2030) and any change in this demand will directly impact the market opportunity.
Table 6: Plastic resin growth rates and share of packaging in the demand
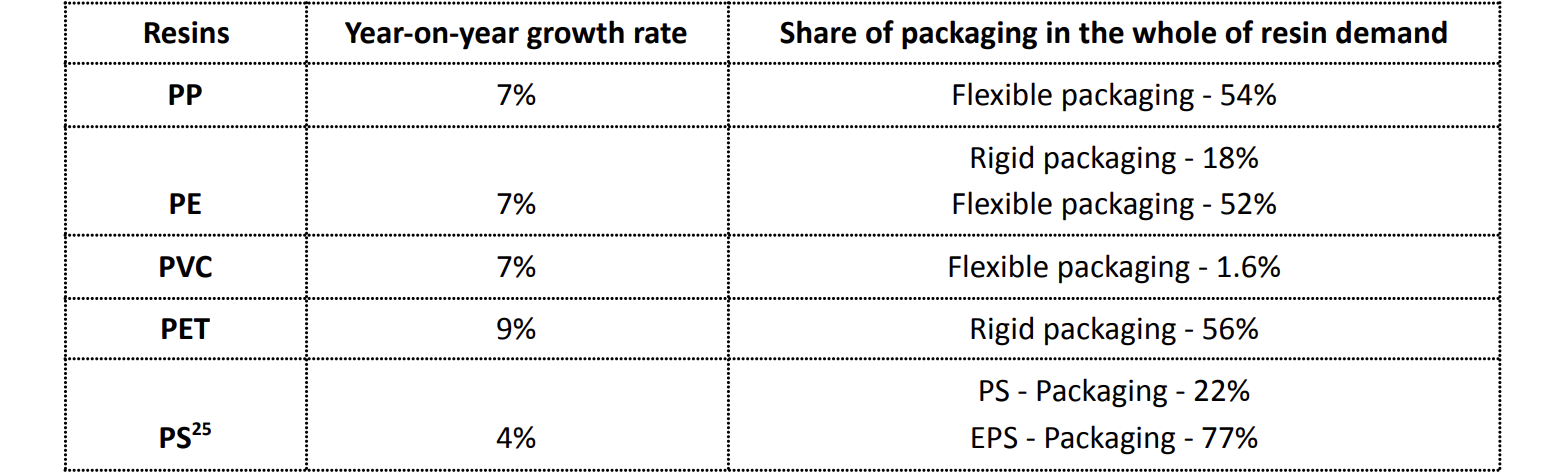
Source: PlastIndia Foundation 2023
Plastic packaging has a life of one year before it is disposed of as waste (Singh 2021). Therefore, the demand for plastic packaging is calculated under different resins. The resin demand at an India level for 2022-23 was obtained from secondary sources (PlastIndia Foundation 2023), and the year-on-year growth rates were applied to project the demand over 2023-2030.
Table 7: Plastic resin demand till 2030
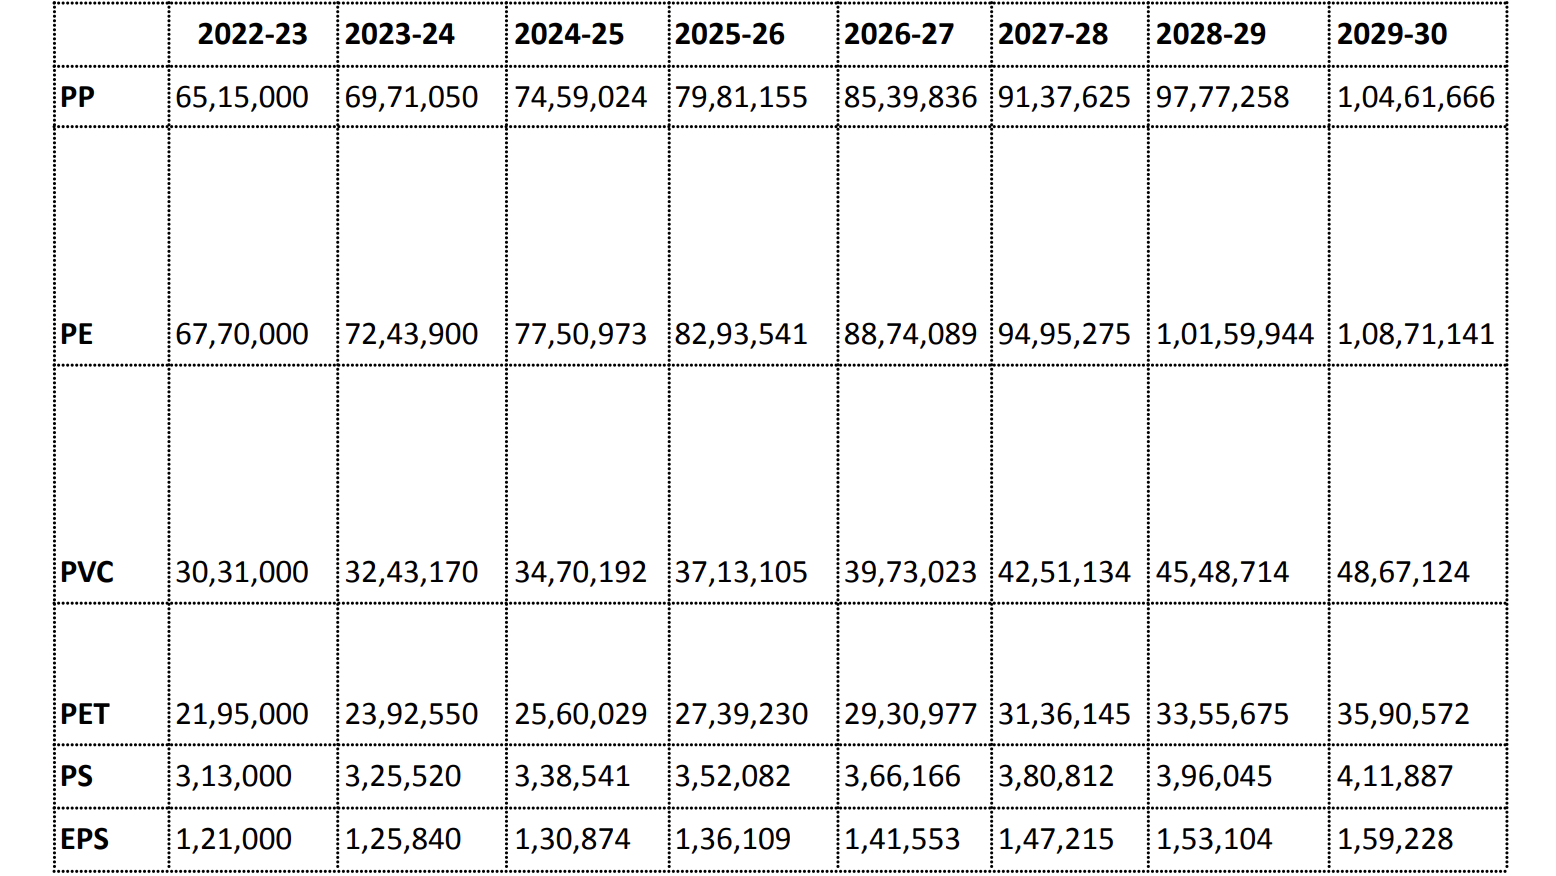
Source: Authors’ analysis based on the data from PlastIndia Foundation 2023
Based on the demand, the share of packaging, and its lifetime before its disposal, plastic waste was calculated at an India level. In order to estimate the packaging waste for Odisha, we calculated the share of Odisha’s plastic waste out of India’s plastic waste as per the CPCB and OSPCB Annual Reports on plastic waste, which came to 1.77 per cent, as set out below:
Table 8: Odisha’s share of plastic waste in India
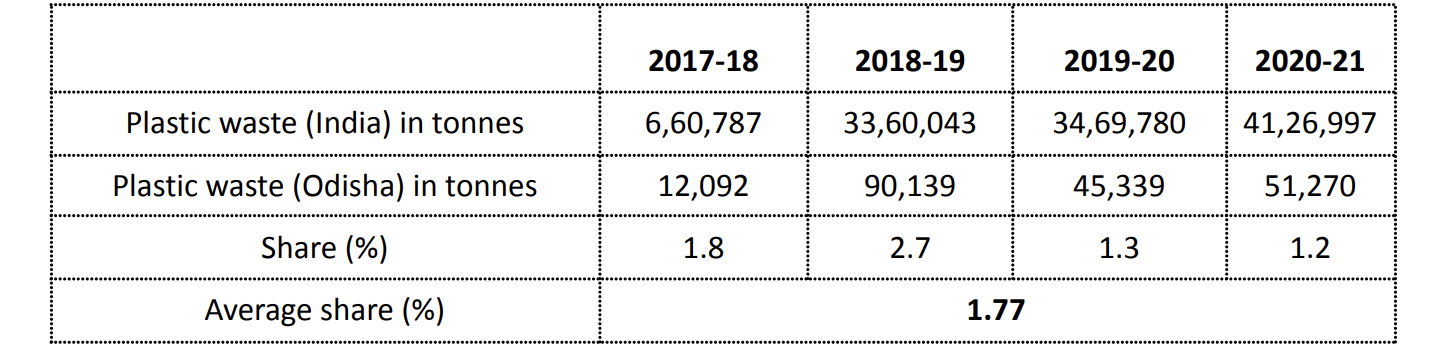
Source: Authors’ analysis based on the Plastic Waste Annual Reports of OSPCB and CPCB
Table 9: Projected annual plastic packaging waste for Odisha (in tonnes)
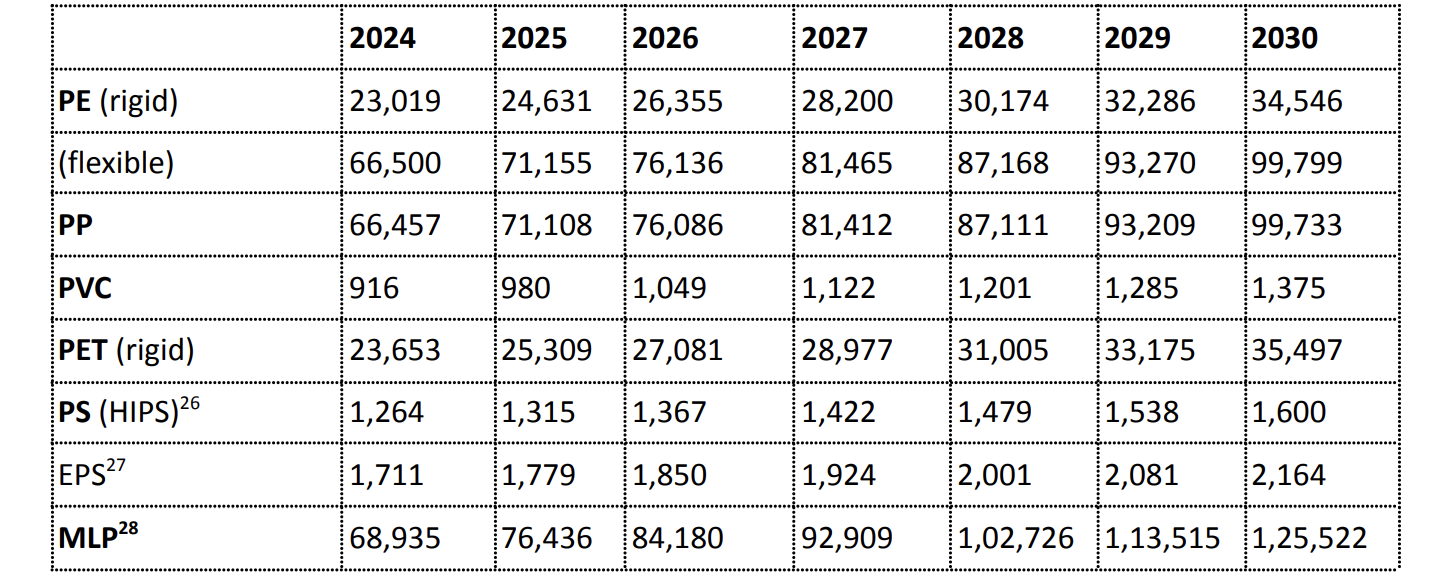
Source: Authors’ analysis based on the data from CPCB, OSPCB, and PlastIndia Foundation 2023
○ Waste recycling
Under the PWM Rules, producers, importers, and brand-owners (PIBOs) introducing plastic packaging in the market are obligated to comply with the extended producer responsibility (EPR) targets. The obligation of a minimum level of recycling of plastic packaging for PIBOs is set out below:
Table 10: Recycling targets
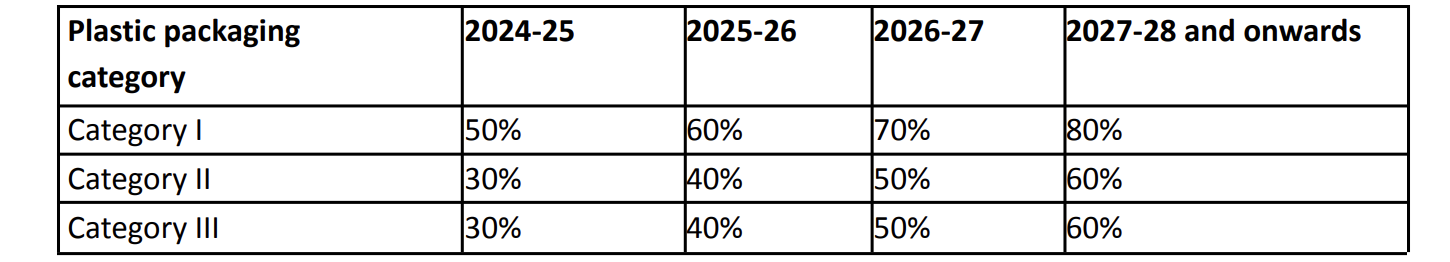
Source: Plastic Waste Management Rules, 2016 (and its amendments)
These recycling rates have been applied to the plastic packaging waste generated in Odisha for the assessment period 2024-2030. In this context, the market opportunity for the policy scenario for the assessment period of 2024-2030 cumulatively is 925 million USD.
Note: It should be noted that this analysis does not consider any inflow or outflow of plastic waste from the state of Odisha.
3. Ambitious scenario
Under the ambitious scenario, Odisha is projected to emerge as a strategic node for plastic waste recycling in eastern India. For this, it is assumed that plastic waste from neighbouring states like Jharkhand, West Bengal, and Chhattisgarh will be channelised to Odisha. The recycling rates are considered to be the same as provided under the PWM Rules for plastic packaging under EPR.
○ Waste generation
To calculate the plastic waste generated in Odisha, Jharkhand, West Bengal and Chhattisgarh, a life cycle analysis was undertaken. The demand for plastic in India is obtained from PlastIndia Foundation, 2023. CAGR of 10.7 per cent is calculated from the period of 2010-21 and used to project plastic demand till 2030 in India.
Table 11: India’s total plastic demand
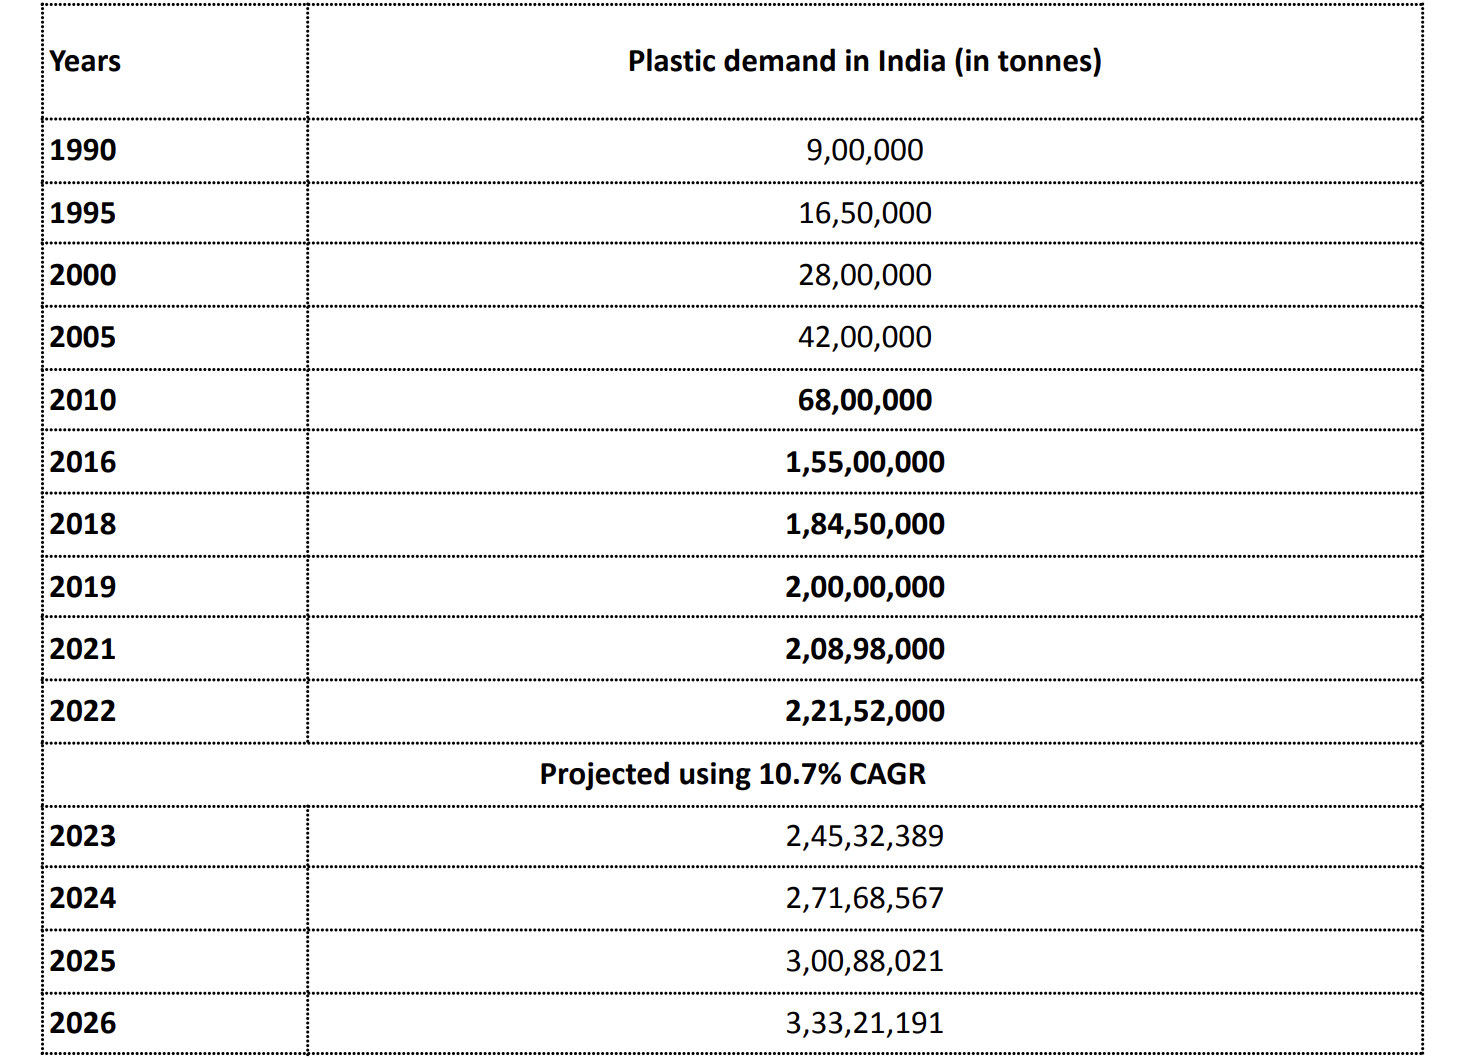
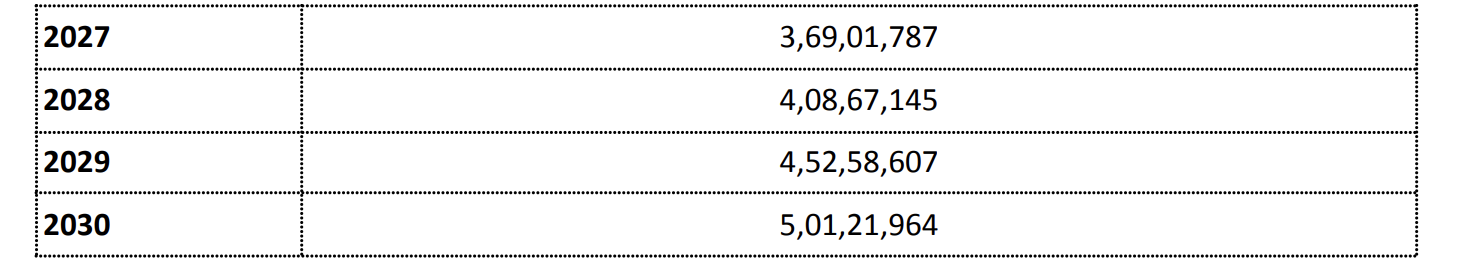
Source: PlastIndia Foundation 2023 and authors’ analysis based on it
Thereafter, sector-wise consumption of plastic and the approximate life of the plastic consumed in different sectors before it is disposed of, (Singh 2021; Filipe et al. 2023) is used to calculate the plastic waste generated at a national level.
Table 12: Sectoral consumption and life of plastic in different sectors
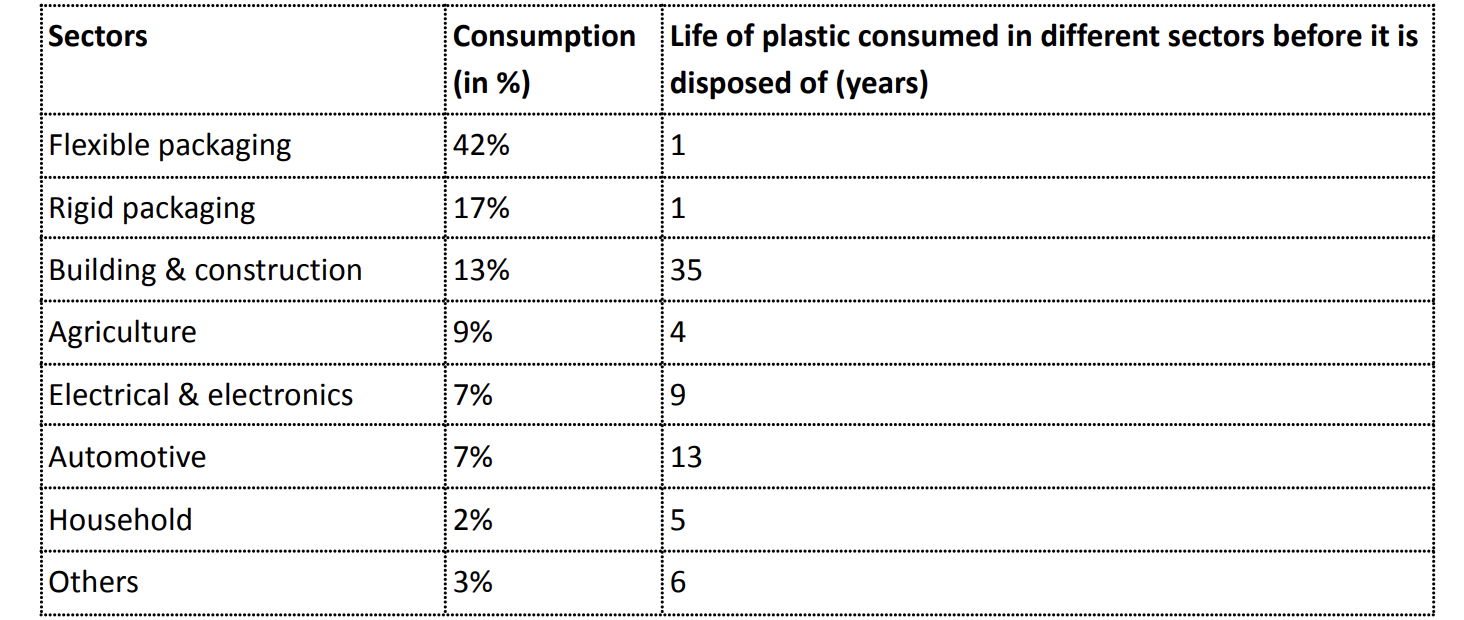
Source: Singh 2021; Filipe et al. 2023
Table 13: Plastic waste generated in India (in tonnes) till 2030

Source: Authors’ analysis based on the above tables
Table 14: Proportion of India’s plastic waste for Odisha, Jharkhand, West Bengal, and Chhattisgarh
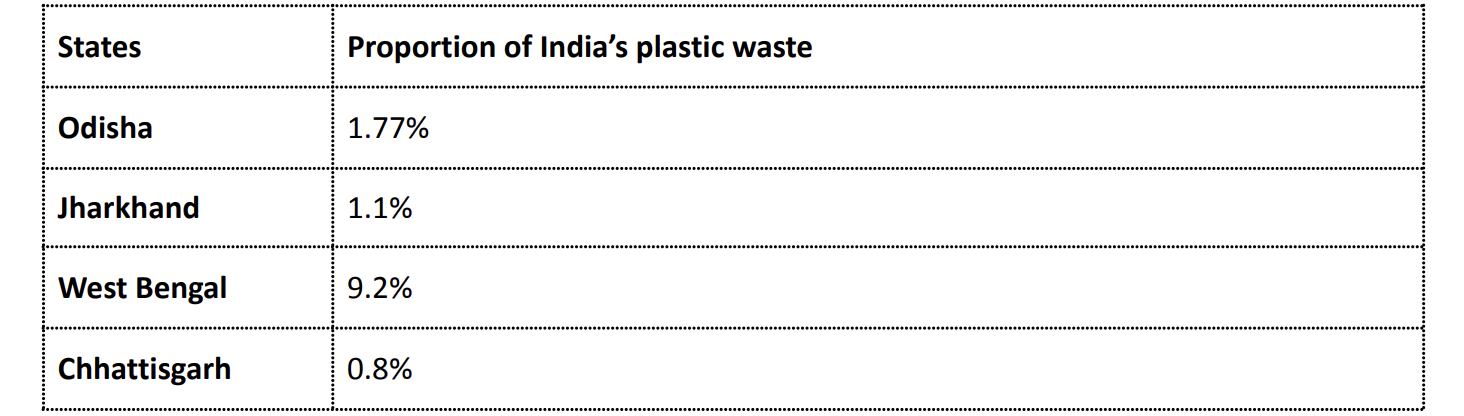
Source: Authors’ analysis based on the CPCB reported plastic waste generation for the years 2017-21
Under this scenario, 50 per cent of the plastic waste generated in Jharkhand, West Bengal, and Chhattisgarh is aimed to be channelised in Odisha for recycling. This is not to suggest that these states will not further build their capacities but to showcase the competitive opportunity for an early mover. When a state overcomes technical constraints and builds recycling capacities with favorable ecosystems, it can attain economies of scale which will allow it to process additional waste than that generated within its boundaries. Additionally, the assumption of the flow of 50 per cent of plastic waste from the above-mentioned states is because the states’ current recycling capacities are much less than 50 per cent of its generation, as per our estimations below.
○ Waste recycling
For Odisha: In addition to the recycling of plastic packaging waste as per the policy scenario, the remaining plastic waste is recycled as per the minimum recycling targets of Categories II and III as set out under the PWM Rules.
For Jharkhand, West Bengal and Chhattisgarh: The plastic waste is channelised and aggregated from other states in Odisha and is recycled as per the minimum recycling targets of Categories II and III as set out under the PWM Rules.
Based on this, the total waste to be recycled under the ambitious scenario is:
Table 15: Plastic waste to be recycled in Odisha
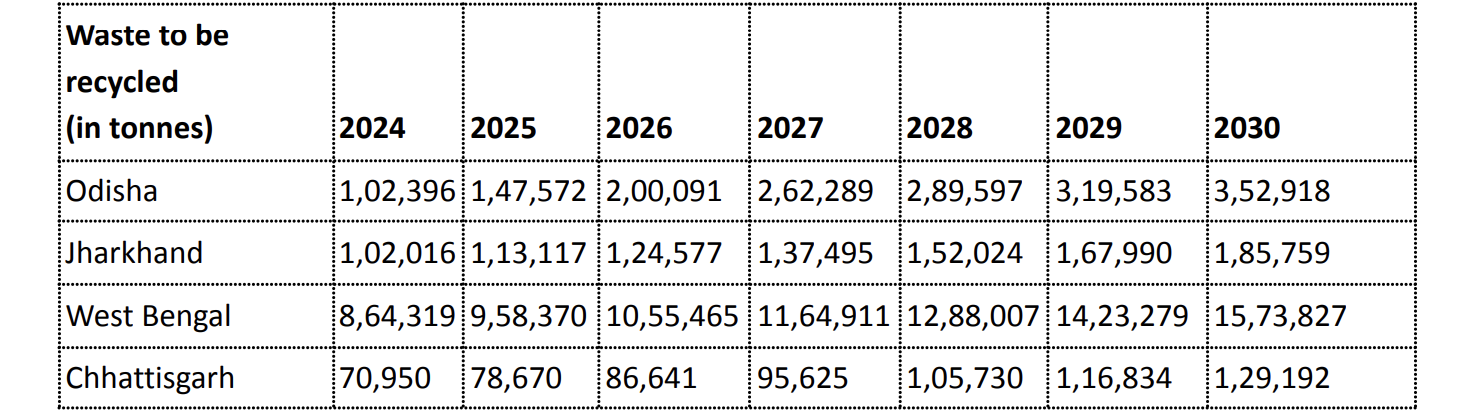
Source: Authors’ analysis
Thereafter, based on the plastic waste composition as set out above, the recovery rates of different resins are applied to calculate the market potential. In this context, the market opportunity for the ambitious scenario for the assessment period of 2024-2030 cumulatively is 4,738 million USD.
Note: It should be noted that this analysis does not consider any inflow or outflow of plastic waste from the state of Odisha, except as mentioned above.
The FTE calculated for recycling-related operations is used on plastic waste generated under various scenarios. The results are as follows:
- Under the BAU scenario, the total cumulative jobs for the assessment period 2024-2030 is 744 for recycling 239 kilo tonnes of plastic waste.
- Under the policy scenario, the total cumulative jobs for the assessment period 2024-2030 is 3,823 for recycling 1,271 kilo tonnes of plastic waste.
- Under the ambitious scenario, the total cumulative jobs for the assessment period 2024-2030 is 22,566 for recycling 6,678 kilo tonnes of plastic waste.
Investment opportunity is the capital expenditure (capex) to be incurred in setting up conventional mechanical plastic waste recycling facilities under different scenarios. This includes the cost of land, building, and machinery. The capex has been calculated based on secondary and primary sources:
○ For machinery: Reference was made to a project report on plastic waste recycling (Samadhan 2019) for the rates on machinery, which was estimated to be approximately 84 USD per tonne. (refer to Annexure II).
○ For land: Reference was made to one KII, wherein the recycling facility was set up in an area of 4 acres for 12,000 tonnes per annum. Land rates were taken from Odisha Industrial Infrastructure Development Corporation’s (IDCO) website as an average of land rates of Bhubaneswar, Cuttack and Paradeep (Annexure II).
○ For building: Reference was made to the KIIs of two stakeholders whose average built-up area was 95,000 sq ft for 12,500 tonnes per annum. Building costs were received from another KII (Annexure II).
The overall capex under these assumptions is Rs. 14,167 or 170.7 USD per tonne.
The recycling capacity and number of facilities are sized to the maximum waste generated in Odisha, that is, waste generated in the year 2030.
Table 16: Capex required under different scenarios
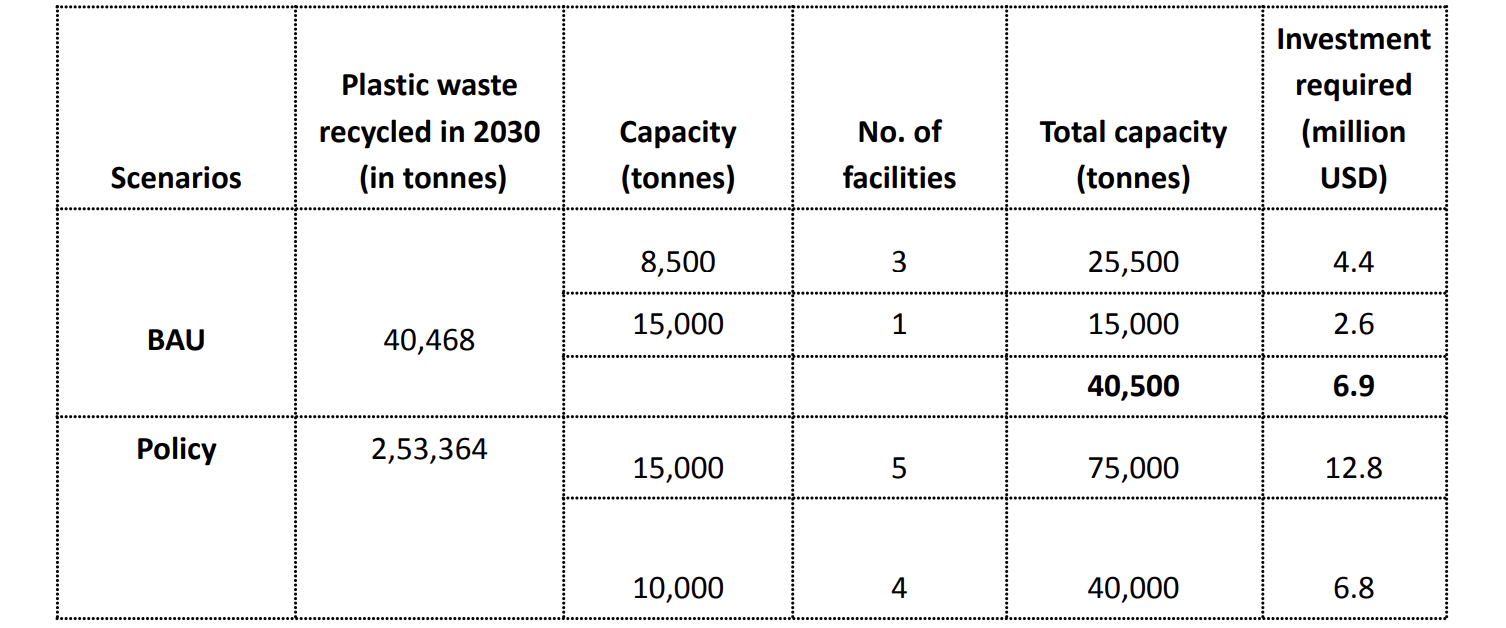
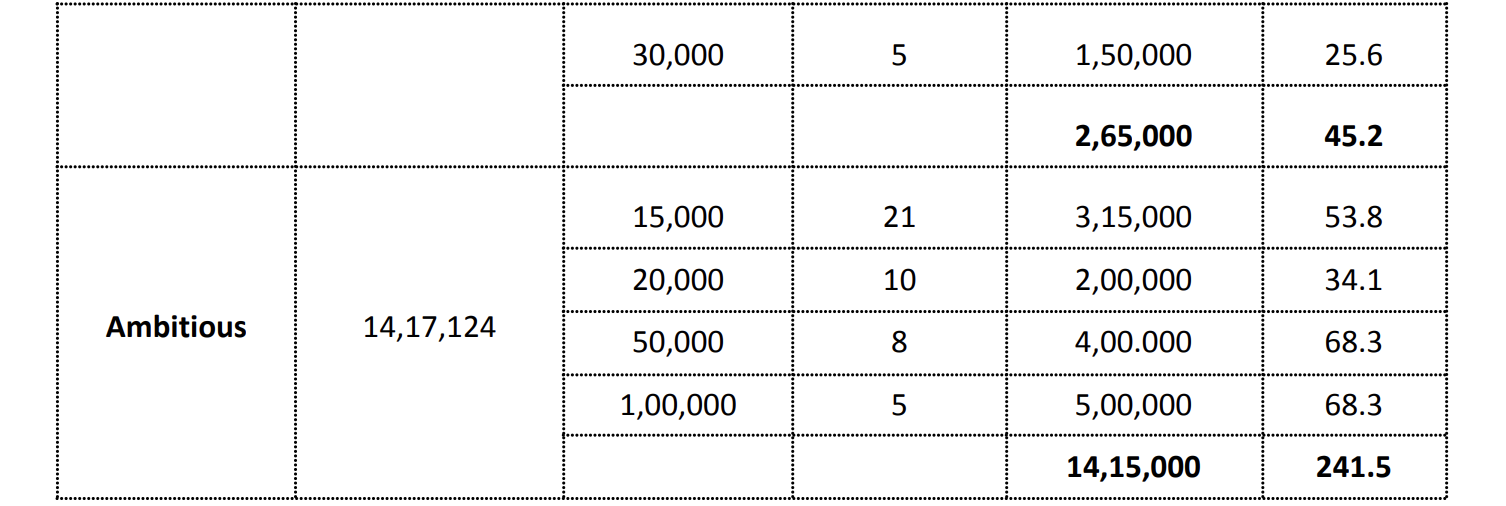
Source: Authors’ analysis
The number of recycling plants and their capacities are indicative to showcase the investment potential.
1. Machinery and equipment for a 300 tonnes per annum plastic recycling facility is mentioned in the table below. While most of the costs have been taken from Samadhan, 2019, these are adjusted based on current market rates.
Table 17: Machinery and equipment cost
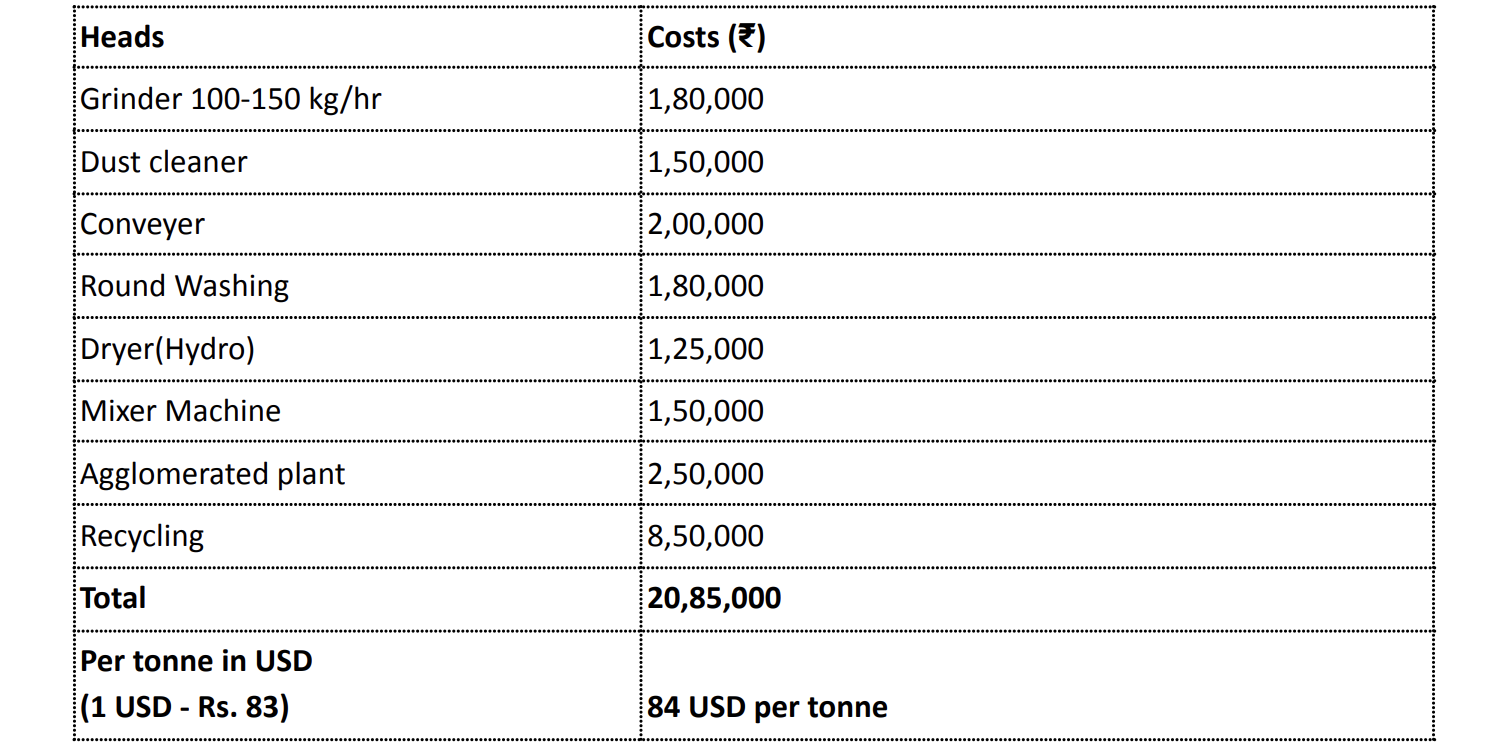
Source: Samadhan 2019, IndiaMart, Exporters India
2. Land rates
Table 18: Average rates of Bhubaneswar, Cuttack and Paradeep Industrial Estates
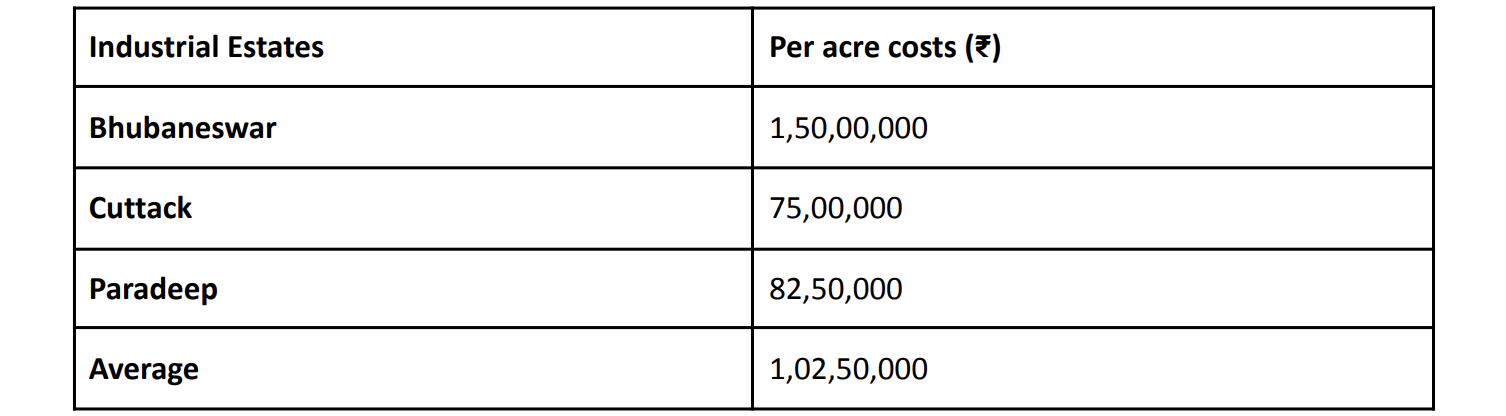
Source: IDCO n.d.
As discussed above, 4 acres area is required for 12,000 tonnes per annum, which will be as per the average rates cost about Rs. 4,10,00,000. Therefore, based on this, the per tonne land cost would be approximately Rs. 3,417 and the area required will be 14.5 sq ft per tonne.
Table 19: Built up area for waste recycling
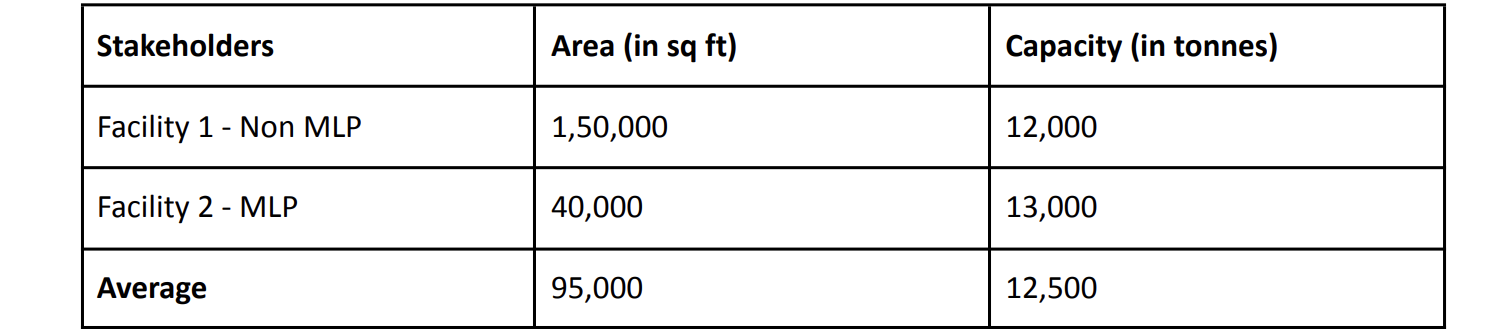
Source: Stakeholder consultations
Since the KIIs are limited, we have considered an average of the two facilities for MLP and non-MLP recycling for estimating the average area of a recycling facility. Based on the above table, the built-up area required for the management of per tonne of plastic waste is 95,000/12,500 - 7.6 sq ft.
Antonopoulos Ioannis, Giorgia Faraca and Davide Tonini. 2021. “Recycling of post-consumer plastic packaging waste in the EU: Recovery rates, material flows, and barriers.” Waste Management (126) 2021 694-705. https://doi.org/10.1016/j.wasman.2021.04.002.
https://www.sciencedirect.com/science/article/pii/S0956053X21001999
Banyan Nation. n.d. Accessed on January 20, 2024. https://www.banyannation.com/
Bhattacharya, R R N Sailaja, Kaushik Chandrasekhar, M V Deepthi, Pratik Roy, and Ameen Khan. 2018. “Challenges and opportunities - Plastic waste management in India.” New Delhi: TERI.
https://www.teriin.org/sites/default/files/2018-06/plastic-waste-managem...
Chattopadhyay, Shourjomay and Dr Nandini Kumar. 2020. “A Circular Plastics Economy Strategy for India.”
https://sustainabledevelopment.in/wp-content/uploads/2020/06/1589884216M...
Biswas, Atin, Kuldeep Chaudhary, Richa Singh, Shailshree Tewari, Siddharth Singh and Subhasish Parida. 2021. “Waste-Wise Cities: Best practices in municipal solid waste management.” https://www.niti.gov.in/sites/default/files/2021-12/Waste-Wise-Cities.pdf New Delhi: Centre for Science and Environment and Niti Aayog.
CPCB. 2015. "Assessment & Characterisation of Plastic Waste Generation in 60 Major Cities.” Accessed on January 10, 2024.
https://cpcb.nic.in/displaypdf.php?id=cGxhc3RpY3dhc3RlL1BXXzYwX2NpdGllc1...
CPCB. 2021. “Annual Report 2020-21 on Implementation of Plastic Waste Management Rules, 2016.”
https://cpcb.nic.in/uploads/plasticwaste/Annual_Report_2020-21_PWM.pdf
CPCB, 2024. “Draft Standard Operating Procedure (SOP) for Characterization & Assessment of Plastic Waste Generation.” Accessed on June 01, 2024.
https://cpcb.nic.in/openpdffile.php?id=TmV3c0ZpbGVzLzEwNl8xNzA3NzQxNzQ5X...
FICCI and Accenture. 2020. “Strategies for sustainable plastic packaging in India.”
https://ficci.in/event_details/27312
Filipe, Susana, Paulo Mira Mourão, Nazaré Couto, and Davide Tranchida. 2023. "Towards a Sustainable Future: Advancing an Integrated Approach for the Recycling and Valorization of Agricultural Plastics" Polymers 15, no. 23: 4529.https://www.mdpi.com/2073-4360/15/23/4529
Gram Vikas. 2021. “Labour Migration from Rural Odisha”. Bhubaneswar: Gram Vikas.
https://www.gramvikas.org/wp-content/uploads/2021/09/Jagannathprasad-Blo...
Greater Hyderabad Municipal Corporation (GHMC). 2020. “Enhancing Circular Economy Perspectives - Plastic Waste Management Strategy and Action Plan for Greater Hyderabad Municipal Corporation.”
https://www.iges.or.jp/en/publication_documents/pub/policysubmission/en/...
Hopewell, Jefferson, Robert Dvorak and Edward Kosior. 2009. “Plastics recycling: challenges and opportunities.” Philosophical Transactions of the Royal Society B: Biological Sciences 364(1526): 2115–2126. doi: 10.1098/rstb.2008.0311.
Kapur-Bakshi, S., M. Kaur and S. Gautam. 2021. “Circular Economy for Plastics in India: A Roadmap.” New Delhi: The Energy and Resources Institute.
https://www.teriin.org/sites/default/files/2021-12/Circular-Economy-Plas...
Khanna, Naresh. 2023. “Banyan Nation Pioneers Digital Ecosystem for Plastic Recycling in India.” December 01, 2023.
https://packagingsouthasia.com/she-safety-health-and-environment/sustain...
Labour and ESI Department, Government of Odisha. 2020. “Social Mapping of Migrant Workers in Odisha.”
https://nluo.ac.in/storage/2024/08/NLUO_-Annual-Report_2024.pdf
Lee, Julian. 2019. “Recycled Plastic Is Now More Expensive Than PET. That’S Not Just an Economic Problem.” The Print, October 7, 2019.
Lee, Julian. 2019. “Recycled Plastic Is Now More Expensive Than PET. That’S Not Just an Economic Problem.” The Print, October 7, 2019.
Mahesh, Priti Banthia, Dr Anjali S. Nair and Vinod Kumar. 2024. “Is Plastic Recycling Safe.” New Delhi: Toxics Link.
https://toxicslink.org/wp-content/uploads/2024/03/Is%20Plastic%20Recycli...
Ministry of Housing and Urban Affairs (MoHUA). 2021. “Circular Economy in Municipal Solid and Liquid Waste.”
https://mohua.gov.in/pdf/627b8318adf18Circular-Economy-in-waste-manageme...
Musso, Chris, Zhou Peng, Andrew Ryba, and Jeremy Wallach. 2022. “Beyond the bottle: Solutions for recycling challenging plastics.”
https://www.mckinsey.com/industries/chemicals/our-insights/beyond-the-bo...
N, Voulvoulis, Kirkman R, Giakoumis T, Metivier P, Kyle C, and Midgley V. n.d. “EXAMINING MATERIAL EVIDENCE the CARBON FINGERPRINT.”
https://www.imperial.ac.uk/media/imperial-college/faculty-of-natural-sci...
Odisha Industrial Infrastructure Development Corporation (IDCO). n.d. Industrial Estate Details.
https://portal.idco.in/Reports/IEstatistics.aspx
OECD. 2018. “Improving Markets for Recycled Plastics Trends, Prospects and Policy Responses.” Paris: OECD.
https://search.oecd.org/environment/waste/Policy-Highlights-Improving-Ma...
Paben, Jared. 2021. “Coca-Cola and Others Report Using More Recycled Plastic.” Resource Recycling News, December 7, 2021.
https://resource-recycling.com/recycling/2021/12/07/coca-cola-and-others...
PlastIndia Foundation. 2023. “Plastics Industry Status Report India 2021-22 & 1H 2022-23 Update.”Z
https://plastindia.org/plastic-industry-status-report/report-india
Pretner, Gaia, Nicole Darnall, Francesco Testa, and Fabio Iraldo. 2021. "Are consumers willing to pay for circular products? The role of recycled and second-hand attributes, messaging, and third-party certification." Resources, Conservation and Recycling 175 (2021): 105888.
https://www.sciencedirect.com/science/article/abs/pii/S0921344921004973
Shankar R., D. Khan, R. Hossain, Md. T. Islam, K. Locock, A. Ghose, V. Sahajwalla, H. Schandl and R. Dhodapkar. 2022. “Plastic waste recycling: existing Indian scenario and future opportunities.” International Journal of Environmental Science and Technology. 20: 5895–5912 (2023).
https://link.springer.com/article/10.1007/s13762-022-04079-x
Shriram Institute for Industrial Research. 2020. “Assessment and Characterization of Plastic Waste in NCT of Delhi”. New Delhi: Shriram Institute for Industrial Research.
https://environment.delhi.gov.in/sites/default/files/environment/univers...
Siddharth Ghanshyam Singh. 2021. “Plastic Recycling: Decoded.” New Delhi: Centre for Science and Environment. https://www.cseindia.org/plastic-recycling-decoded-10885
Tyagi, Akanksha, Charu Lata, Jessica Korsh, Ankit Nagarwal, Deepak Rai, Sameer Kwatra, Neeraj Kuldeep, and Praveen Saxena. 2022. “India’s Expanding Clean Energy Workforce.” Council on Energy, Environment and Water, Natural Resources Defense Council, and Skill Council for Green Jobs. https://www.ceew.in/sites/default/files/Green-Jobs-Report-Jan27.pdf
Verma, Rinku, K.S. Vinoda, M. Papireddy and A.N.S. Gowda. 2016. “Toxic Pollutants from Plastic Waste- A Review.” Procedia Environmental Sciences 35 (2016):701-708.
https://linkinghub.elsevier.com/retrieve/pii/S187802961630158X
Washington State Department of Ecology (WSDE). 2020. “Recycled Content Use in Washington.”
https://apps.ecology.wa.gov/publications/documents/2007023.pdf
Waste Management World (WMW). 2008. “WRAP study reveals carbon impact of bottling Australian wine in the UK.”
https://waste-management-world.com/artikel/wrap-study-reveals-carbon-imp...