Council on Energy, Environment and Water Integrated | International | Independent
+15 to 40: More hot days each year in India by 2050
+5: More very warm nights in the last decade—rising faster than hot days
3 in 4: Indians already at high or very high heat risk
Summer is about to get much worse. We looked at how the number of annual unusually hot days (temperature above 35℃) would change across India by 2050:
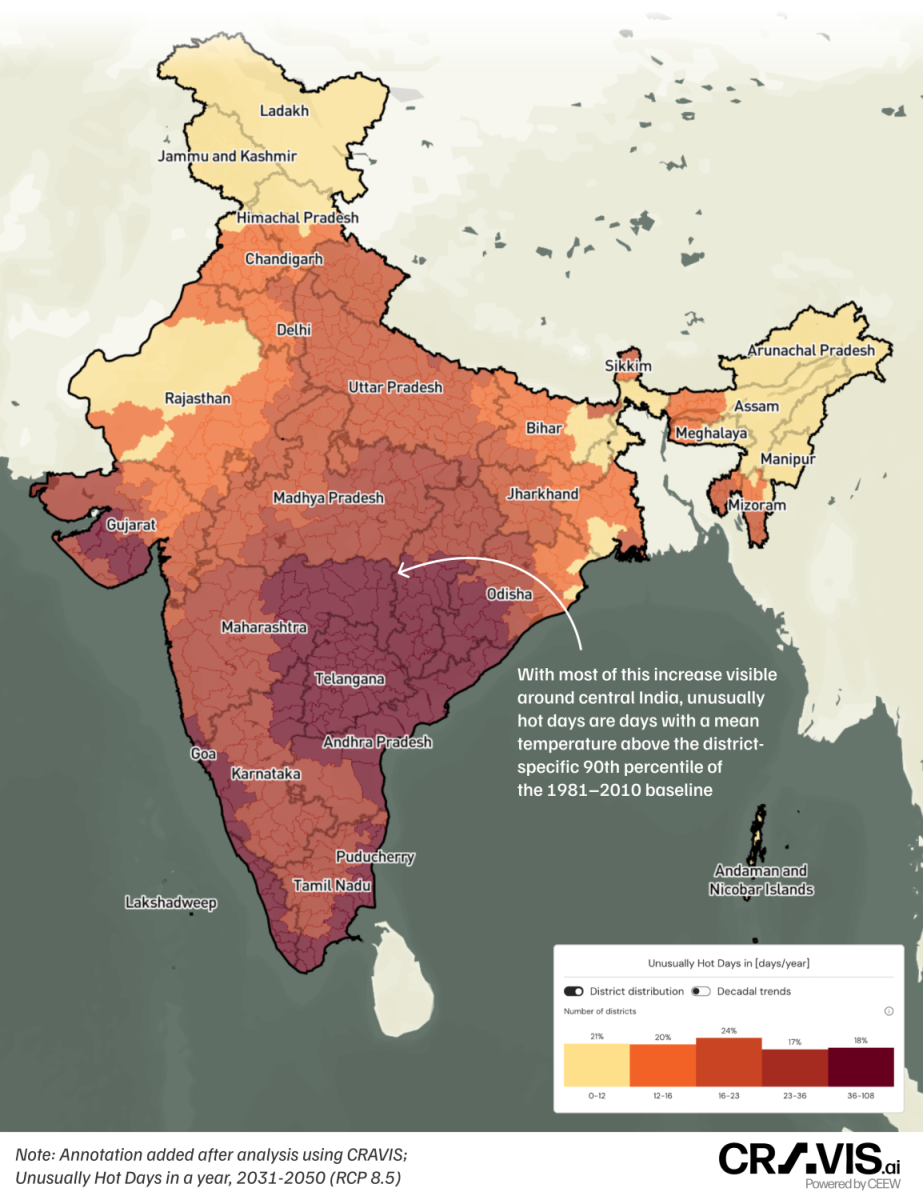
According to projections from CRAVIS—CEEW’s AI-powered climate intelligence platform—India could see an additional 15 to 40 unusually hot days each year by 2050, compared to the 1981–2010 baseline. Unusually warm nights are also projected to rise by 20–40 days annually in several regions. Much of this will be concentrated in and around central and coastal India, with implications for cooling demand, electricity load, infrastructure performance, and economic resilience.
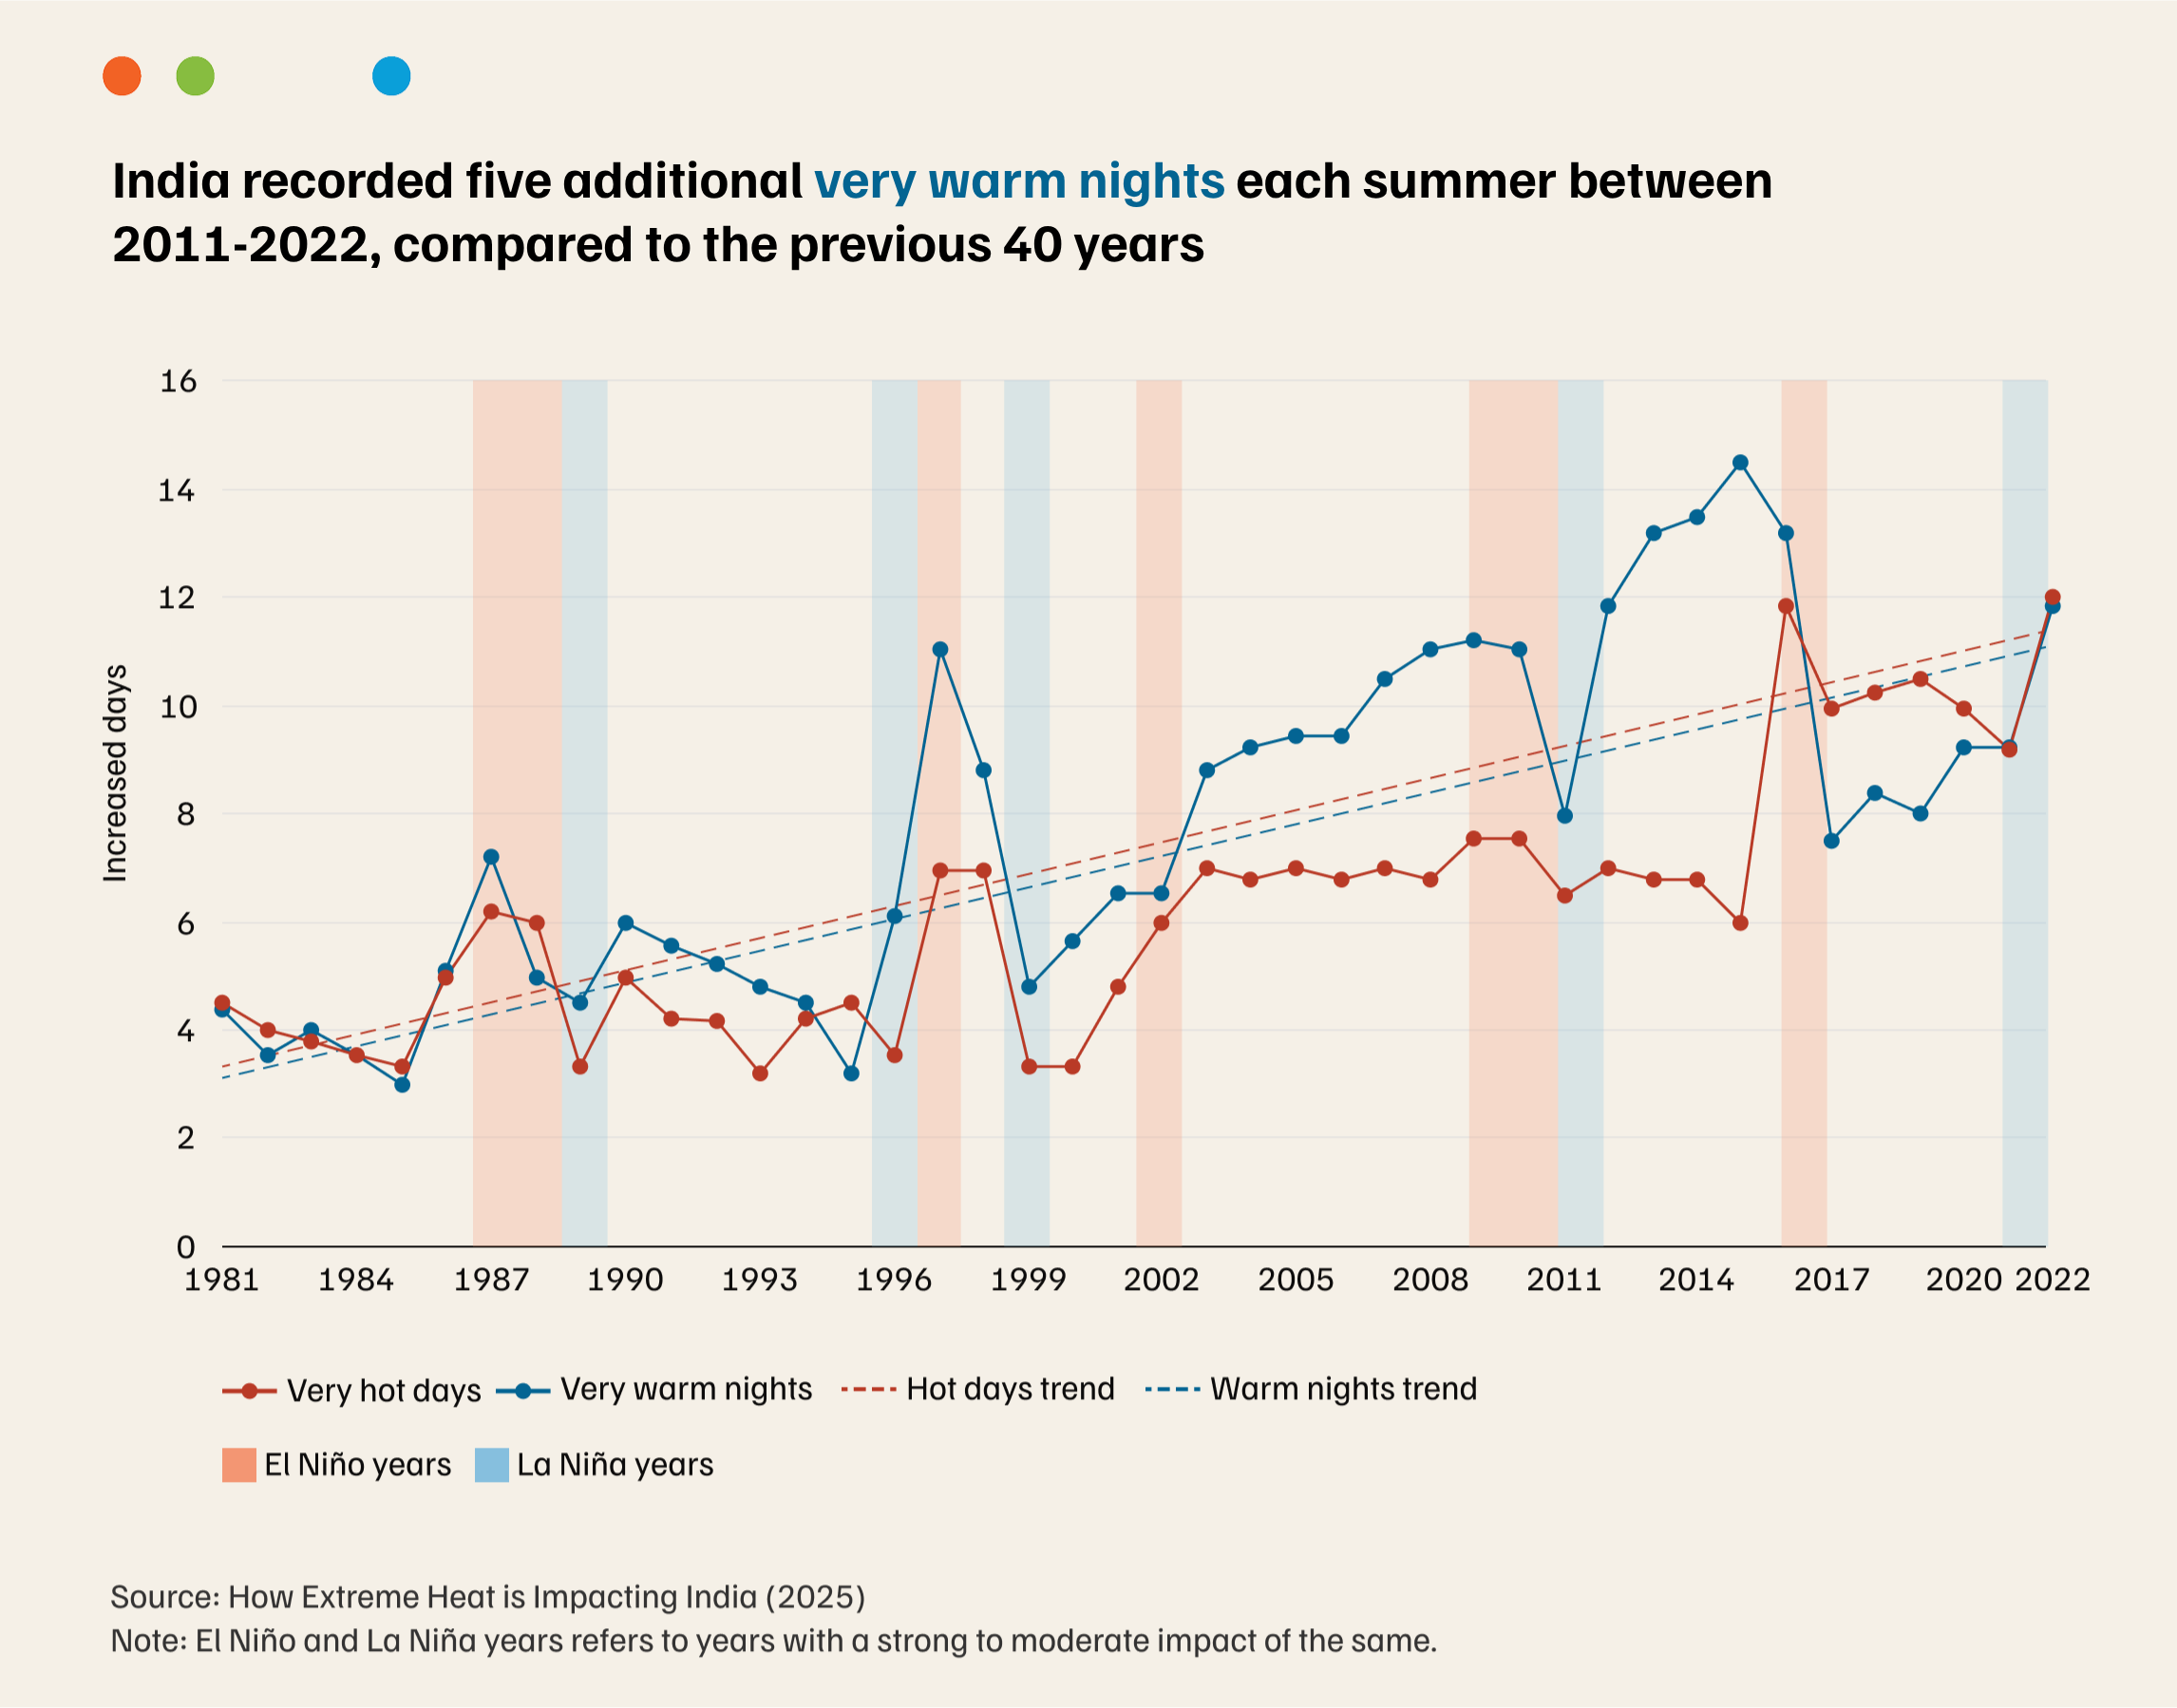
The chart above shows how extreme heat has changed across India over the past four decades. Over the last decade, India has recorded five more very warm nights each summer compared to earlier decades. What stands out is the divergence: very warm nights are rising faster than very hot days, particularly over the last decade. Both are defined as temperatures exceeding the 95th percentile of historical data, but their impacts are not the same. Nights are a reset button: it is when people, infrastructure, and ecosystems recover from daytime heat stress. Warm nights interrupt that recovery and the body’s ability to cool down. Heat accumulates over time, increasing health risks and reducing resilience. In cities like Delhi, this shift is becoming harder to ignore. Warmer nights are projected to rise from around 180 days a year today to over 210 in the next 25 years—equivalent to an additional month of cooling demand.
What's coming: El Niño is expected to form again in late 2026. The chart shows that during strong El Niño years, such as 1997 and 2016, both very hot days and very warm nights rose sharply above average. Reduced rainfall and drier conditions during these years tend to intensify heat extremes. If this pattern repeats, 2027 could be particularly intense.
Heat risk is not what a thermometer shows. It is what that heat does to people. It combines three factors: how intense the heat is, how many people are exposed to it, and how vulnerable they are. Heat risk combines temperatures with indicators such as population density, building density, green cover, relative humidity, health vulnerabilities, access to cooling, housing quality, outdoor labour exposure, etc.
CEEW's first-of-its-kind district-level assessment—covering 734 districts and 35 indicators—found that nearly 76% of India's population lives in districts already facing high to very high heat risk. The burden falls hardest where dense populations and existing health vulnerabilities overlap. When these forces converge, they strain public health systems, disrupt livelihoods, and expose structural inequalities that are otherwise less visible.
What's being done: CEEW has supported 142 Indian cities across 8 states and UTs to develop heat action plans, aiming to reach 300 by 2027. It also now hosts the newly launched South Asia Heat and Health Hub, an initiative under the WHO–WMO Climate and Health Joint Programme, funded by Wellcome. The Hub brings together five coordinating partners—CEEW, Sustainable Futures Collaborative, NRDC India, BRAC James P. Grant School of Public Health, and UNESCAP—working in tandem with IITM and IMD. The regional network aims to share evidence, strengthen early warning systems, and scale what works.
One question for you
What is the first sign that heat is affecting your daily life—sleep, work, commute, water, power cuts, or health?
Written by: Shreya Kapoor
Research by: Vishwas Chitale, Shravan Prabhu
Charts by: Poojil Tiwari
Scroll into UpChart, our data-focused LinkedIn emailer that connects dots