Council on Energy, Environment and Water Integrated | International | Independent
Suggested citation: Elango, Sabarish, Dharshan Siddarth Mohan, Himani Jain, Hemant Mallya, and Virendra Ade. 2025. What Drives Vehicle Ownership Costs in India? A Segment-wise Analysis for India’s Road Transport. New Delhi: Council on Energy, Environment and Water
This report assesses the most cost-effective fuel options across vehicle segments to support evidence- based policymaking and a market-driven transition toward transport sector decarbonisation. It evaluates and compares the total cost of ownership (TCO) for various vehicle types and fuel technologies across Indian states. TCO captures the full lifecycle cost of purchasing, operating, and reselling a vehicle, providing a comprehensive metric for comparing fuels. The analysis spans both current and projected costs for petrol, petrol-hybrid, diesel, CNG, electric, LNG, hydrogen internal combustion, and hydrogen fuel cell vehicles.
Given that the Indian market is highly cost-conscious—particularly in the commercial vehicle segment—understanding cost drivers such as capital costs, taxes and fees, fuel prices, fuel economy, annual mileage, loan terms, resale value, maintenance, and insurance is critical. This report identifies the lowest-cost fuel option for each vehicle category and state, both today and in the future.
The emergence of electric vehicles (EVs) has significantly shifted the focus toward the Total Cost of Ownership (TCO), driving a broader and more strategic evaluation of long-term vehicle expenses across the automotive industry. Consumers use TCO analysis, either directly or indirectly, to make informed, long-term vehicle purchase decisions. This analytical approach reveals the true costs of operating and maintaining vehicles throughout their life cycle, moving beyond the simple purchase price to uncover hidden expenses and opportunities. This analysis has proven particularly valuable for evaluating emerging vehicle technologies. For instance, when comparing electric vehicles (EVs) with traditional combustion engines, TCO analysis pinpoints exactly when and under what conditions these technologies reach cost parity. Several studies have used TCO as an instrument to investigate the uptake of different powertrain types, especially EVs (Hagman, et al. 2016; Liu, et al. 2021; Wu, Inderbitzin and Bening 2015; Palmer, et al. 2018; Bubeck, Tomaschek and Fahl 2016).
In the context of the Indian automobile market, where consumers are highly cost-conscious, TCO plays a significant role in purchase decisions. It includes upfront downpayment costs, taxes, road tax, operating expenses including energy, maintenance, and insurance costs, and the resale value, providing a holistic assessment of costs incurred.
The following are the major parameters of TCO:
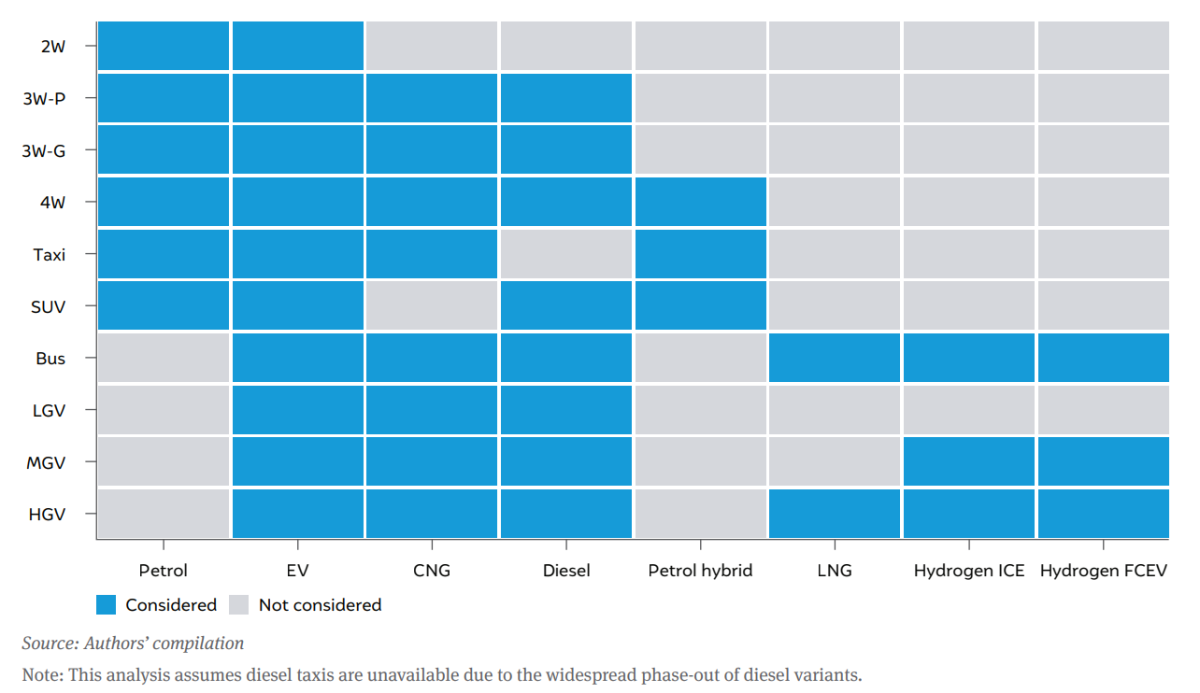
Our study compares the TCO of different fuel types within ten distinct vehicle segments, shown in Figure ES1.
Figure ES1 Vehicle segments and fuel types considered in our analysis
Green hydrogen FCEVs may be more viable for long-distance, heavy duty operations, offering refuelling times comparable to diesel while eliminating tailpipe emissions. However, green hydrogen FCEV trucks are currently six times more expensive than diesel trucks. Therefore, parallel research efforts are required to accelerate this transition and realise the potential of hydrogen in long-haul transportation.
The government can create a consortium comprising OEMs, policymakers, researchers and scientists to prioritise and foster innovation and research and development. Such an initiative would not only drive technological advancements, but also ensure India remains globally competitive and aligned with international standards in emerging technologies.
The advent of electric vehicles (EVs) has brought a renewed focus on the total cost of ownership (TCO) concept, prompting a comprehensive evaluation of long-term vehicle expenses across the automotive industry. The TCO is the cost incurred per kilometre over the life of the vehicle for buying, driving, maintaining and selling a vehicle. It is a broad metric that sheds light on the total costs incurred while owning a vehicle over its lifecycle, looking beyond comparisons of only the capital cost at the time of purchase.
Calculating the TCO is essential for transport sector modelling and policymaking, as it allows for more precise long-term cost projections and impact evaluation of different policies (e.g., fuel taxes, subsidies, or emissions regulations) on the overall cost of various transport options. Comparisons in TCO also allow stakeholders to predict the adoption of new technologies and fuels based on the projected change in costs. By factoring in various costs over time, TCO helps in evaluating and modelling financial risks associated with different transport options. Several studies have used TCO as an instrument in investigating the uptake of different powertrain types, especially EVs (Hagman, et al. 2016; Liu, et al. 2021; Wu, Inderbitzin and Bening 2015; Palmer, et al. 2018; Bubeck, Tomaschek and Fahl 2016).
India has one of the largest and fastest-growing automobile industries in the world. Mohan et al (2025) examined the growth potential of various vehicle types based on expected changes in population and GDP. The study found that the total vehicle stock in the country is likely to grow by 2.2 times between 2023 and 2050. In this study, we use TCO to gauge the likelihood of energy transitions occurring in the transport sector, i.e., shifts from petrol/diesel to CNG, to electric, and also to green hydrogen. Based on prevailing and expected prices of vehicles, fuels, annual maintenance, etc., we evaluated the likely inflection points for such fuel transitions for each vehicle category considered by the Mohan et al (2025) study. We followed the guiding principle that in a highly cost-conscious and largely economically sensitive market, consumers will directly (in the case of fleet operators) or indirectly (in the case of individual consumers) make a purchase decision based on TCO.
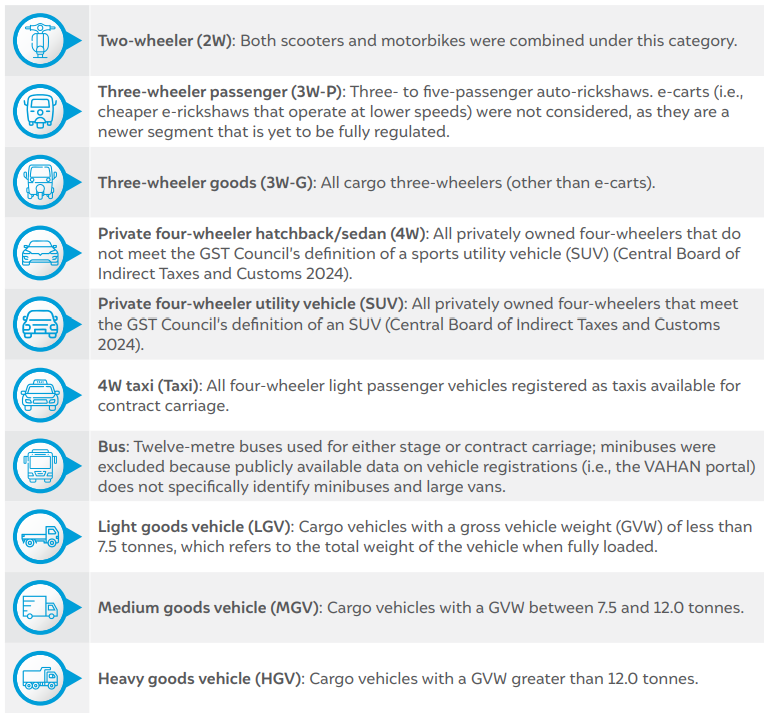
The vehicle categories (i.e. segments) considered in this study are broadly classified into ten:
We considered agricultural vehicles like tractors and tillers to be out of the scope of our analysis, as they perform specific tasks in each sector that do not necessarily amount to ‘transportation’. Specialised vehicles like disabled-carriage vehicles, fire tenders, etc. were not included as they form a very small part of the overall vehicle stock.
The powertrain types considered include the conventional ones (petrol, diesel, CNG) and also newer technologies (LNG, hybrid, electric, green hydrogen). We considered LNG as an option for buses and HGVs as they enable travel over longer distances using natural gas compared to CNG vehicles. We considered petrol-electric hybrids in the analysis even though there are only a few models on sale today, as there are plans to introduce more affordable hybrids by simplifying and indigenising the technology (Sorabjee 2024). For hydrogen-fuelled vehicles, we considered both green hydrogen fuel cell electric vehicles (H₂ FCEV) and green hydrogen internal combustion engine (H₂ ICE) vehicles. While the former is the more advanced and more efficient technology, the latter is substantially cheaper and can be produced by adapting existing engine designs and manufacturing facilities, thus bringing green hydrogen to the market more quickly. We analysed green hydrogen-fuelled vehicles in only the bus, medium- and heavy duty segments as an option to minimise refuelling times; for smaller vehicles, electrification is cheaper and much more energy efficient. The CNG option for twowheelers is not considered in this study, as it is currently limited to a single OEM, and market adoption has yet to be ascertained. Table 1 shows the vehicle categories and their fuel types considered in this analysis.
Table 1 Vehicle categories and powertrains considered in this analysis
| S. No. | Notation | Segment | Considered fuel types |
|---|---|---|---|
| 1 | 2W | Two-wheeler | Petrol, electric |
| 2 | 3W-P | Three-wheeler passenger | Petrol, diesel, CNG, electric (and legacy LPG) |
| 3 | 3W-G | Three-wheeler goods | Petrol, diesel, CNG, electric (and legacy LPG) |
| 4 | 4W | Private four-wheeler hatchback/sedan | Petrol, diesel, CNG, electric, petrol hybrid |
| 5 | SUV | Private four-wheeler utility vehicle | Petrol, diesel, electric, petrol hybrid |
| 6 | Taxi | Commercial 4W | Petrol, CNG, electric, petrol hybrid (including legacy diesel)* |
| 7 | Bus | Bus (12-metre) | Diesel, CNG, LNG, electric, hydrogen internal combustion engine (ICE), hydrogen fuel cell electric vehicle (FCEV) |
| 8 | LGV | Light goods vehicle; GVW < 7.5 tonnes | Diesel, CNG, electric |
| 9 | MGV | Medium goods vehicle; 7.5 < GVW < 12 tonnes | Diesel, CNG, electric, hydrogen ICE, hydrogen FCEV |
| 10 | HGV | Heavy goods vehicle; GVW > 12 tonnes | Diesel, CNG, LNG, electric, hydrogen ICE, hydrogen FCEV |
Source: Authors' compilation
*Note: This analysis assumes diesel taxis are unavailable due to the widespread phase-out of diesel variants.
The total lifetime costs of owning a vehicle can be broadly categorised into capital costs and operating costs. The capital costs include the upfront cost of buying a vehicle (or the capital expenditure, CAPEX), the taxes imposed by the central and state governments (goods and services tax, (GST) central excise and service tax, (cess) and road tax), and the interest payments (in case of a loan). The operating costs comprise fuel expenses, maintenance and insurance, recurring road tax (in the case of commercial vehicles), and battery replacement cost (in the case of EVs). The capital and operational costs are quantified for the vehicle types identified in Table 1 for future years from 2024 to 2050.
While the CAPEX and the fuel costs are the most significant components of the TCO, solely examining these two factors would not capture the intricacies between different powertrains. The upfront cost to buy a vehicle might be a burden in the initial years, but over a longer ownership period of 10 to 15 years, recurring costs such as insurance, maintenance, repair, and road tax gain more significance. So, it is imperative to establish sound methodologies to quantify these cost components to gain a holistic perspective of the TCO.
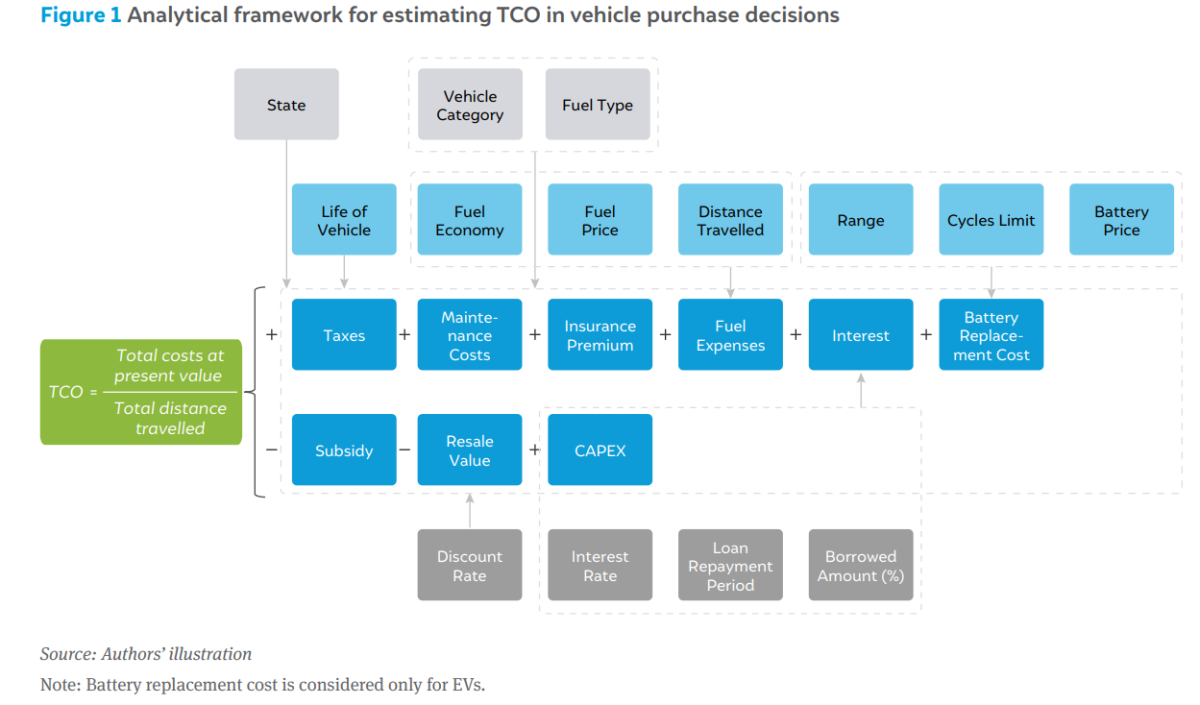
The scope of this study is to estimate the TCO of different vehicle segments and their powertrains at a state level, and to compare powertrains within a vehicle segment. The TCO framework incorporates diverse parameters, some demonstrating uniformity across states; others displaying regional variability. Standardised parameters include CAPEX, interest payments, discount rate, resale value, GST and cess, and fuel economy. State-specific parameters include road tax, subsidies, and fuel prices. This comprehensive approach enables us to factor in state-level nuances in determining the cost of owning a vehicle.
We obtained data on the model-wise sales for the year 2022–23 across vehicle segments from reports published by the Society of Indian Automobile Manufacturers (SIAM 2023). We used the top 90 per cent of best-selling models in each vehicle segment to calculate the weighted average prices reported by automotive websites (such as Carwale, BikeWale, TrucksDekho, etc.). These prices are given in Annexure 1. Then, for each state, we calculated the final price paid by the consumer (on-road price) by adding the GST and cess set by the central government, and the road taxes and subsidies set by the state governments (CEEW-CEF n.d., MoPNG 2024).
For simplicity, we assumed that the costs of vehicle types that use established technologies and fuels (such as petrol, diesel, CNG, and LNG) will be constant for the projected years. For newer technologies and fuels (such as EV, petrol hybrid, hydrogen ICE, and hydrogen FCEV), we assumed that the CAPEX would decrease over time due to reduction in battery and component costs, and technological improvements in fuel-cell vehicles. These assumptions largely hold true because the analysis is on a real currency basis. The only change in costs is due to the technical and commercial efficiency gain in green technologies. Any changes in material input, labour and other manufacturing costs will largely equally impact fossil or green fuel alternatives. We also assume that given the high maturity of ICE engines and the focus on green technology development, there might not be any significant improvement in ICE engine efficiency in the future.
Fuel costs often form the bulk of the TCO, especially for public vehicles like taxis, trucks and buses that cover long distances every day. In our analysis, we have six types of fuels: petrol, diesel, CNG, LNG, electricity, and green hydrogen. The following subsections explain the methods for projecting the fuel prices. The fuel prices used in the model are provided in Annexure 2: Fuel price assumptions and projections.
Petrol, diesel, CNG, and LNG
For petrol, diesel, CNG, and LNG, we used price build-up models that consider various costs and taxes along the supply chain to different states. This enables analysis of the impact of taxes and import prices.
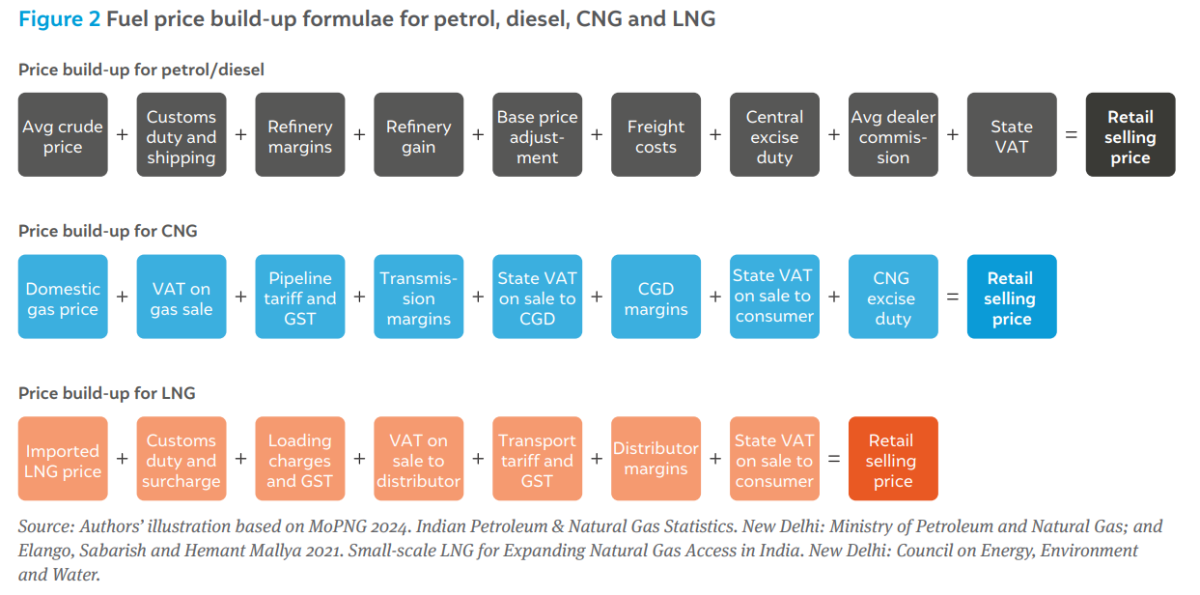
Figure 2 shows the price build-up formula for petrol, diesel, CNG and LNG. For petrol and diesel, the price build-up formula and data were obtained from MoPNG (2024). We assumed the past 10-year average crude price of 80 USD/bbl for all future years for the baseline estimation. We calibrated our price estimates by comparing the calculated retail selling prices with the actual retail selling prices in different states reported in 2023. We factored differences at a state level using an adjustment factor that accounts for differences in refinery outputs, margins, and freight costs.
For natural gas, retail price formulae or their components are not clearly defined in any publicly available reports. Thus, for CNG and LNG, we prepared internal price build-up formulae, building on existing CEEW research published in 2021 (Elango and Mallya 2021). Data on gas prices and taxes were obtained from MoPNG (2024) and Petroleum Planning and Analysis Cell (2024). We assumed dealer margins based on the financial reporting of different leading gas transmission and city gas distribution (CGD) companies (GAIL India Ltd 2023, Mahanagar Gas Limited 2023, Indraprastha Gas Limited 2023, Adani Total Gas Limited 2023).
Electricity
For electricity, we considered both residential electricity prices across different states and EV charging-specific tariffs for the states that have set them. Reports published by the Power Finance Corporation Limited (2022) provided the residential electricity prices as the average revenue per unit sold. The Bureau of Energy Efficiency (n.d.) provided the state-specific tariffs for EV charging stations for those states that have notified the same. We assumed that, by 2050, these input power tariffs will be 25 per cent lower due to dedicated access to cheaper renewable power, and lower energy storage costs.
For these public charging stations, we calculated the approximate tariff for three categories of chargers—3–9 kW AC (for 2W, 3W, and 4W); 10–30 kW DC and AC (for 4W and LGV), and >50 kW DC (for bus, MGV, and HGV)—based on the cost of setting up and operating charging stations (Cars24 2024, Shah 2019, DIYguru n.d., BSES Rajdhani Power Limited n.d.). On account of varied sources, we assumed capital costs of INR 50,000, INR 250,000, and INR 1.25 million for each of the above charger capacities respectively, with a 30 per cent overhead for miscellaneous equipment. We assumed annual operating costs to be about 35 per cent of the total capital costs (primarily going towards land leases). We also considered a revenue margin of 10 per cent.
Based on comparing EV charging tariffs with charging service providers Statiq (n.d.), we assumed that the 3–9 kW and 10–30 kW chargers have an effective capacity utilisation factor of 22 per cent (30 per cent for 18 hours/day and 350 days/year), which rises to 54 per cent (75 per cent for 18 hours/day and 350 days/year) by 2050. In 2024, electricity tariffs for the 3–9 kW category across all states range from INR 8.7/kWh to INR 18.2/kWh. Assuming a discount rate of 10 per cent, this range is projected to decrease to a range from INR 4.9/kWh to INR 11.8/ kWh by 2050. For the 10–30 kW category, the tariff is currently between INR 8.2/kWh and INR 17.7/kWh and will decline to a range from INR 4.7/kWh to 11.6/kWh by 2050.
We assumed the 40–100 kW chargers to have an effective capacity utilisation factor of 29 per cent (30 per cent for 24 hours/day and 350 days/year), which rises to 72 per cent (75 per cent for 24 hours/day and 350 days/year) by 2050. In 2024, the electricity tariffs for the 40–100 kW category across all states range from INR 9.8/kWh to INR 19.1/kWh, declining to a range from INR 5.3/kWh to INR 12.1/kWh by 2050.
Green hydrogen
We obtained the current prices of green hydrogen for states having good solar and wind-solar hybrid generation potential (Mallya, et al. 2024). Based on the declining price trends expected, we assumed that the green hydrogen production costs will be USD 2–2.5/kg (depending on the state) in 2030, declining to about USD 1.5–1.9/kg by 2040 and USD 1.0–1.3/kg by 2050.
Similar to the electricity tariff calculations, we developed a model to calculate the cost of green hydrogen refuelling based on equipment and operating costs (Melaina and Penev 2013; Hecht and Pratt 2017; Eißler, et al. 2023). Publicly available data on refuelling costs in the present day typically indicate costs higher than USD 10/kg; this is due to the very small scale of refuelling networks and very low utilisation rates, such as in the state of California in the U.S. (Weeks and Soria 2024).
We took the green hydrogen compressor and storage costs given by Eißler, et al. (2023) for a 350-bar compressor. We referred to Hecht and Pratt (2017) for the capital costs of other equipment; we recalculated these costs for a larger station dispensing 1,000 kg H₂/day. We took five per cent of the total capital costs to be the annual operating costs. We assumed that the utilisation rate of the stations rises from 30 per cent in 2030 to 80 per cent by 2050. Based on these assumptions, and a discount factor of 10 per cent, we calculated the levelised cost of dispensation to be USD 2.2/kg in 2030, linearly declining to USD 0.8/kg by 2050. The overall costs of delivered green hydrogen thus range from USD 4.2/kg in 2030 to USD 1.8/kg in 2050.
To calculate the annual fuel expenses for a given vehicle, we need the typical annual mileage (i.e., kilometres travelled) and the fuel economy (i.e., kilometres travelled per litre of fuel). We collected data on the real-world fuel economy of various vehicles on sale currently using information provided by reliable automotive reviewers (such as Autocar India), automotive information websites (like CarDekho, ZigWheels, etc.) or from studies (where up-to-date reviews were not available).
Table 2 Average fuel economy figures for different vehicle types
| Vehicle segment | Petrol (km/l) |
Petrol hybrid (km/l) |
Diesel (km/l) |
CNG (km/kg) |
LNG (km/kg) |
Electric (km/kWh) |
H2ICE (km/kg) |
H2FCEV (km/kg) |
|---|---|---|---|---|---|---|---|---|
| 2W | 45.0 | 38.0 | ||||||
| 3W-P | 25.0 | 30.0 | 35.0 | 15.0 | ||||
| 3W-G | 30.0 | 30.0 | 35.0 | 15.0 | ||||
| 4W | 14.0 | 20.0 | 18.0 | 20.0 | 7.0 | |||
| SUV | 9.0 | 18.0 | 12.0 | 5.0 | ||||
| Taxi | 14.0 | 20.0 | 18.0 | 20.0 | 7.0 | |||
| Bus | 5.5 | 6.5 | 6.5 | 1.0 | 10.0 | 16.6 | ||
| LGV | 17.3 | 16.5 | 5.8 | |||||
| MGV | 7.7 | 9.1 | 9.1 | 1.5 | 12.0 | 20.0 | ||
| HGV | 5.0 | 5.9 | 5.9 | 0.8 | 9.1 | 15.1 |
Source: Authors’ compilation from various sources
Table 2 shows the average fuel economy values considered for each vehicle type. We considered values for annual mileage based on the typical daily usage patterns of different vehicle segments. For instance, 2W are used primarily for commuting (distances vary between urban and rural regions), with increasing utilisation for food and courier delivery services. On the other hand, taxis, buses and trucks drive for much longer distances every day, as they are sources of income for their owners and operators.
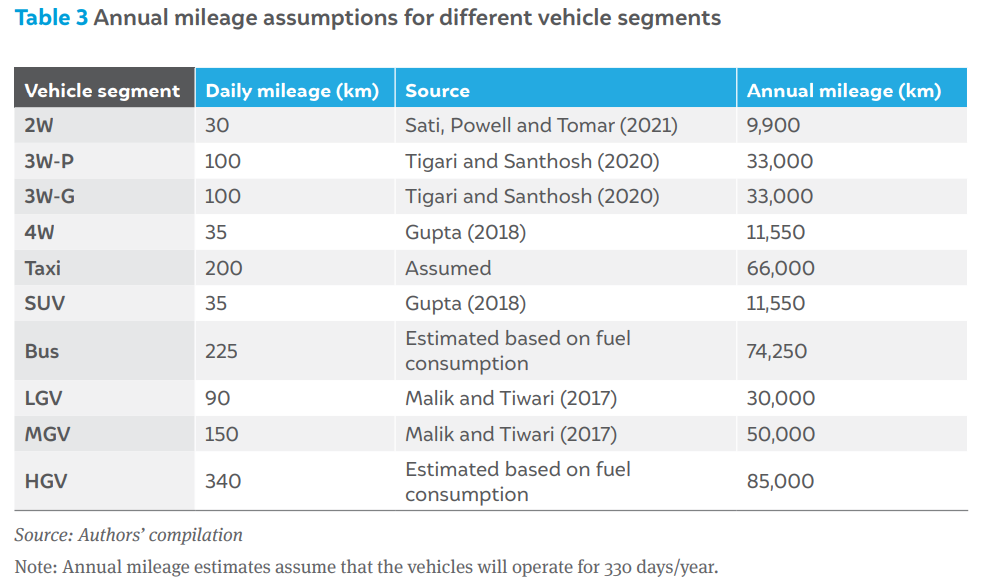
Table 3 shows the vehicle segment-wise daily and annual mileage assumptions. There is no country-wide survey data that provides such data across vehicle segments. Using regional survey data or data from specific case studies causes inaccuracies in the overall fuel demand. For example, we observed mismatches between the calculated versus total annual fuel demand given by MoPNG (2024). Using the segment/fuel-wise vehicle stock data from Mohan, et al. (2025), we tried to roughly estimate the total national fuel demand for past years for each vehicle segment using the formula:
Annual fuel demand = Vehicle stock ×Average fuel economy / Annual mileage
To correct any mismatches observed in the calculated versus actual total petrol and diesel consumption, we adjusted the mileage assumptions for different vehicle segments.
For all vehicle segments except bus, LGV, MGV, and HGV, we assumed that 20 per cent of the capital cost is paid by the buyer as a down payment, while the remaining 80 per cent is paid as monthly instalments. For the four aforementioned segments, we assumed that the entire cost of the vehicle is paid through instalments, and no amount is paid upfront.
We also considered the salvage value of the vehicle at the end of its useful life based on a fixed depreciation rate of 10 per cent from the capital cost. The average number of ownership years is derived from the medium survival rates, where the average ownership period corresponds to the point at which 50 per cent of registered vehicles in each segment are removed from the vehicle stock (Guttikunda 2024).
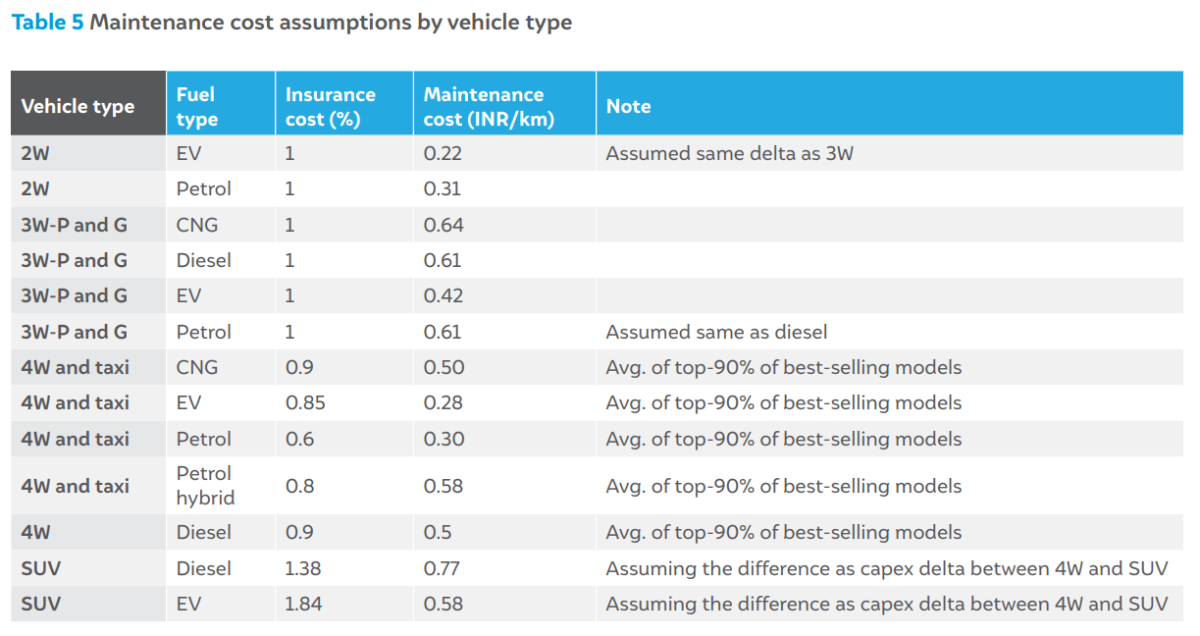
Each vehicle type has different maintenance and servicing costs, depending on the complexity of the drivetrain, number of parts, wear and tear based on typical usage, etc. Internal combustion engine (ICE) vehicles have a larger number of moving parts compared to electric vehicles, thus having greater requirements for regular maintenance. However, EV batteries (which constitute a substantial portion of the vehicle cost) may need replacement after around 2,500 charge cycles (the batteries degrade with repeated cycles of charging and discharging, thus reducing range). We therefore considered annual maintenance costs in INR/km, along with battery replacement costs once or twice over the life of the vehicle (calculated based on the vehicle’s range and number of charge-cycles it would undergo to cover the annual mileage assumptions in Table 3).
Authors’ compilation from Argonne National Laboratory 2023; Vijaykumar, et al. 2021; Altigreen n.d., and OTO 2024
Please see page 24 of the pdf file attached above for the rest of the vehicle types.
Based on the parameters mentioned in Section 2, we were able to calculate the TCO for each fuel type in a given vehicle category for different states for each year till 2050. This section shows the comparisons of TCO for various vehicle segments for all the states.
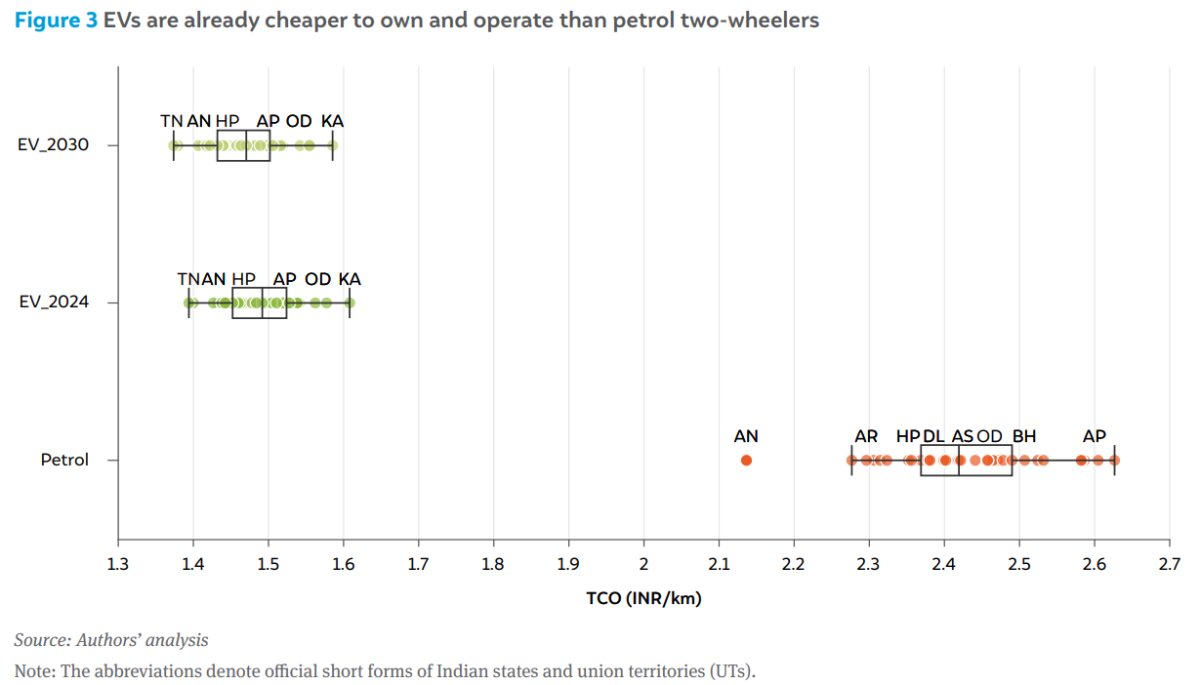
Figure 3 shows the TCO comparison for two-wheelers. Already, in 2024, electric 2W are cheaper on a TCO basis than their petrol counterparts. The estimates include the subsidies outlined under the PM e-drive scheme (actual values in 2024 and assumed values till 2026). The relative lack of EV model options, higher upfront costs, concerns around reliability and accessibility of charging infrastructure are among the major reasons why the share of electric two-wheelers in total sales is still low.
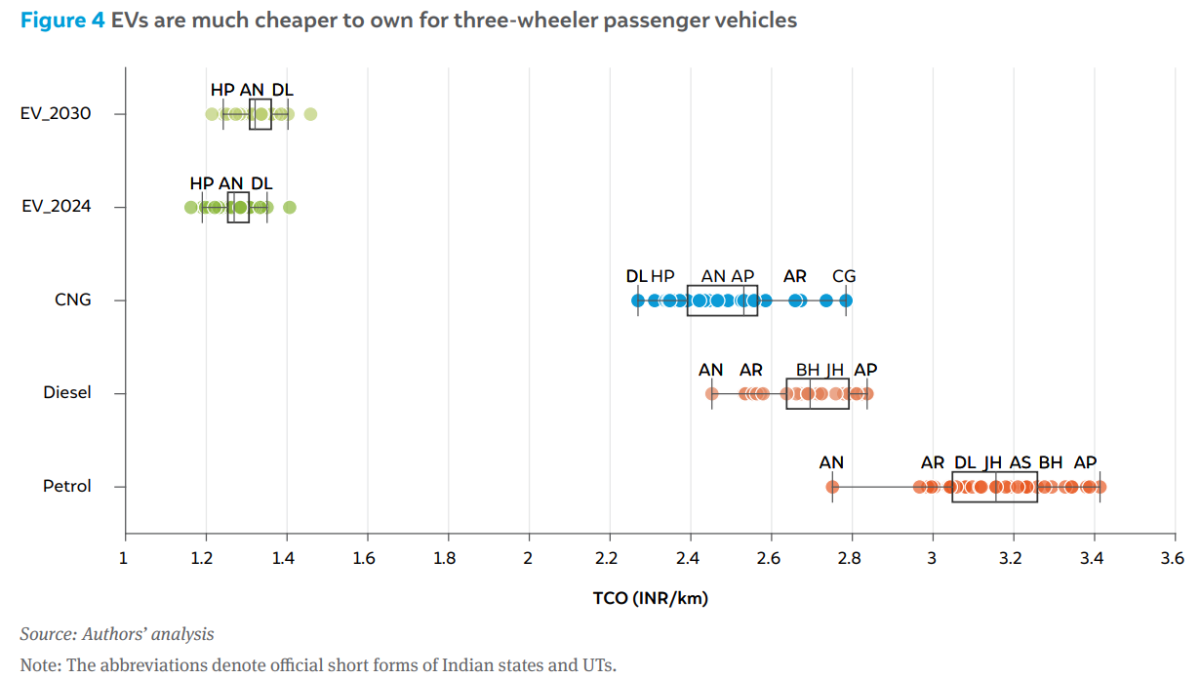
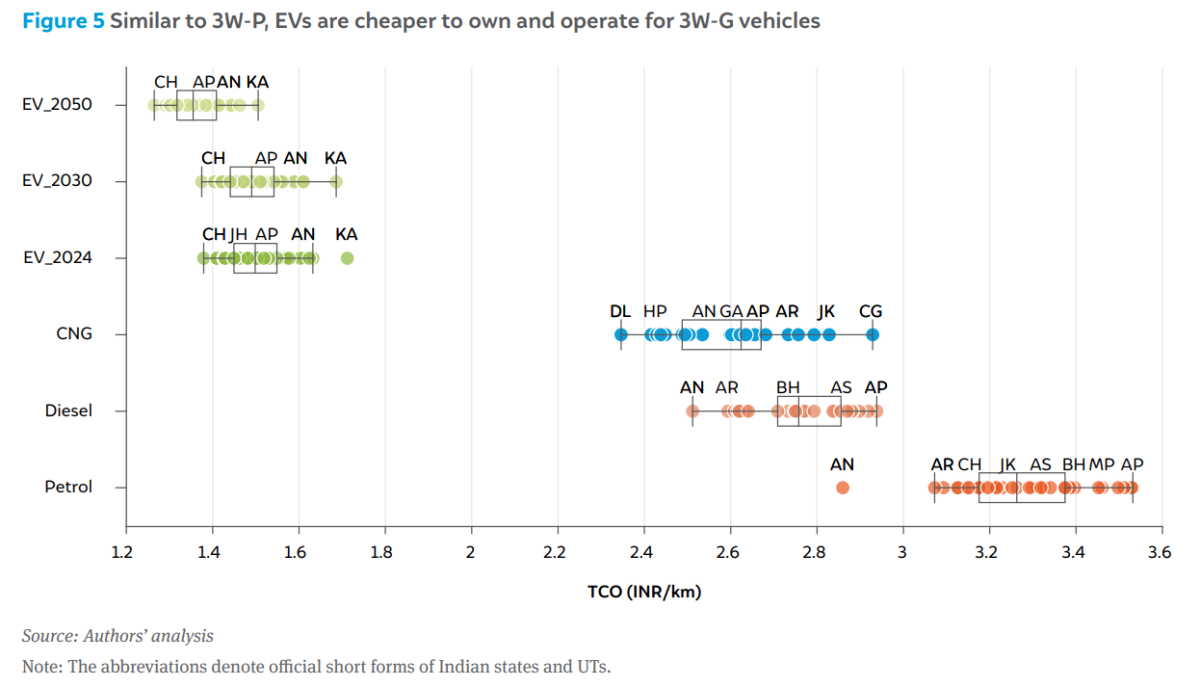
The comparisons in Figure 4 and Figure 5 show that, among the conventional fuels, CNG is a cheaper option for three-wheelers on average compared to petrol and diesel. However, EVs are again much cheaper on a TCO basis in 2024. The EV TCO could increase slightly towards 2030 and beyond; we assumed that the PM e-Drive subsidies will be gradually phased out. By 2050, we assumed that the charging tariffs would decline due to higher charger utilisation factors and lower input power costs (because of higher RE penetration in the grid and more dedicated RE and storage-based charging stations).
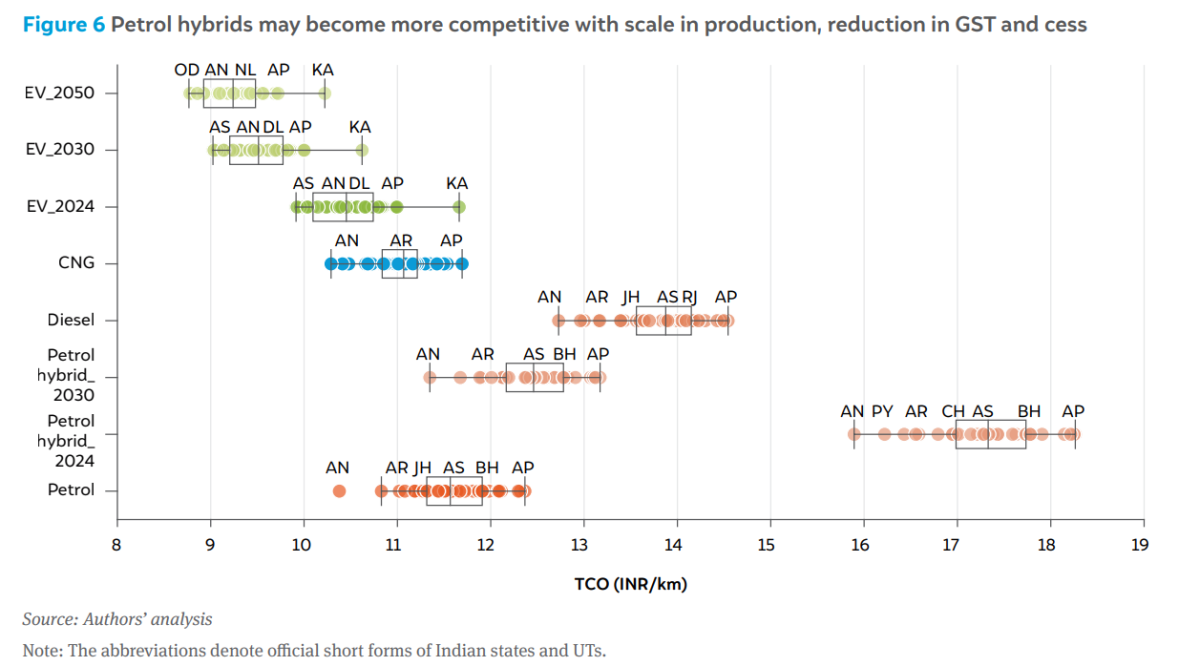
For four-wheelers, too, EVs are cheaper on a TCO basis than other fuels in many states. The low GST and compensation cess rates for EVs (at 5 per cent instead of 37–43 per cent) has greatly reduced the CAPEX premium. Thus, EV purchase decisions are likely constrained by charging infrastructure, range anxiety, and reliability concerns, and not prices in these states. However, in some states such as Karnataka, due to higher charging tariffs and lack of road-tax waivers for EVs, the TCOs for CNG and petrol are more competitive. Petrol-electric hybrid vehicles, often considered a good compromise between ICE and EV, are significantly more expensive, mainly due to the high GST and compensation cess (at 43 per cent), making them uncompetitive in this segment against EVs. However, hybrids may still play an important role beyond 2030 as a compromise option between pure-ICE and pure-EV in many states where the hybrid TCO is competitive against CNG and petrol. Note that the CAPEX (i.e., down payment and financing costs) of diesel vehicles are high because diesel engines are now generally restricted to more premium vehicles; of the top-90 per cent best-sellers, the average price of petrol vehicles was INR 952,000, whereas that of diesel vehicles was INR 1,385,000.
For the SUV segment, petrol and diesel will continue to remain much cheaper than their counterparts for the foreseeable future; petrol hybrids have a competitive TCO in some states where the fuel prices are higher. However, the high EV TCO in 2024 is because of a lack of models on sale in the competitive price segments of INR 2–3 million (20–30 lakh). Several OEMs are planning to launch new EV models in this segment by 2030; the TCO then becomes cheaper on average than other options. However, considering that this segment consists of mainly aspirational vehicle buyers, we do not expect the lower EV TCO to be an important deciding factor in sales.
For the taxi segment, running costs play a bigger role in the TCO than the capital costs, as taxis have a much higher annual mileage compared to private cars. This makes EVs substantially cheaper to own for taxi drivers; however, they are limited by insufficient public chargers and long recharging times. The next cheapest option is CNG; taxis running on this fuel are widely adopted in cities and districts that have a good CNG refuelling infrastructure. By 2030 and beyond, petrol hybrids may become another important option in some states where CNG availability is limited.
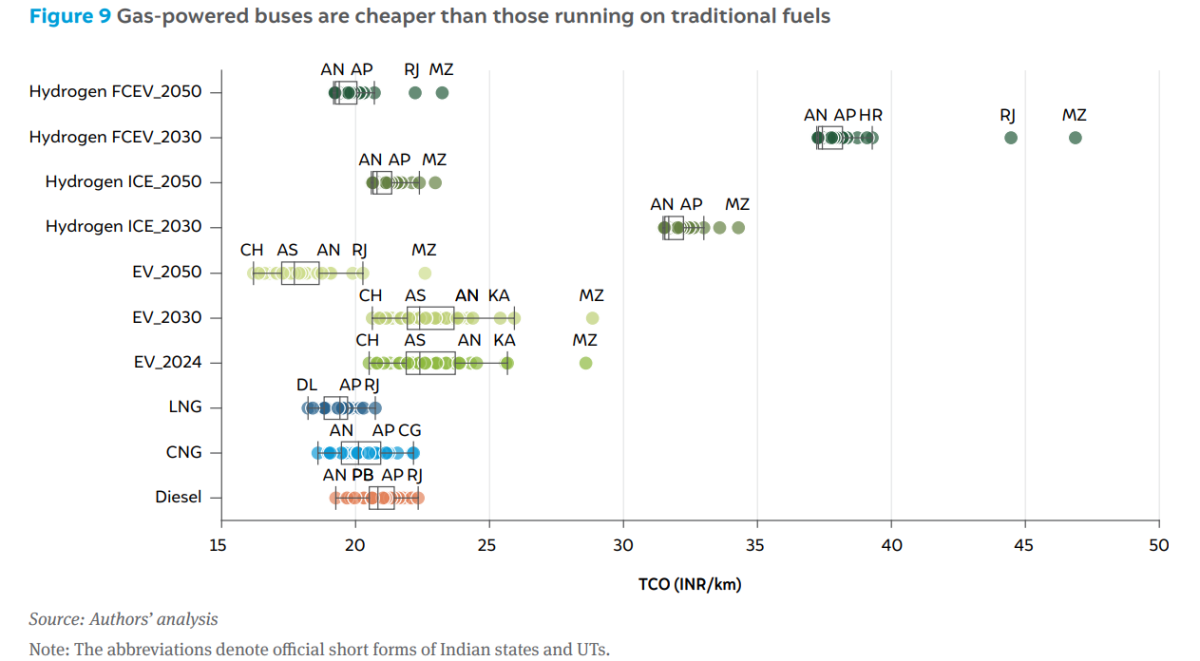
Our analysis (Figure 9) indicates that the TCO of e-buses needs to reduce significantly to compete with diesel buses. The capital cost of e-buses is still much higher than diesel or CNG buses, even by 2030. Beyond 2030, we expect the e-bus TCO to decline, with larger-scale domestic manufacturing. Buses powered by CNG and LNG have a lower TCO on average than diesel buses but are limited by the respective distribution infrastructure. Hydrogen-powered buses remain uncompetitive till the late 2040s, post which H₂ FCEV buses have a lower TCO than H₂ ICE buses due to their higher fuel efficiency.
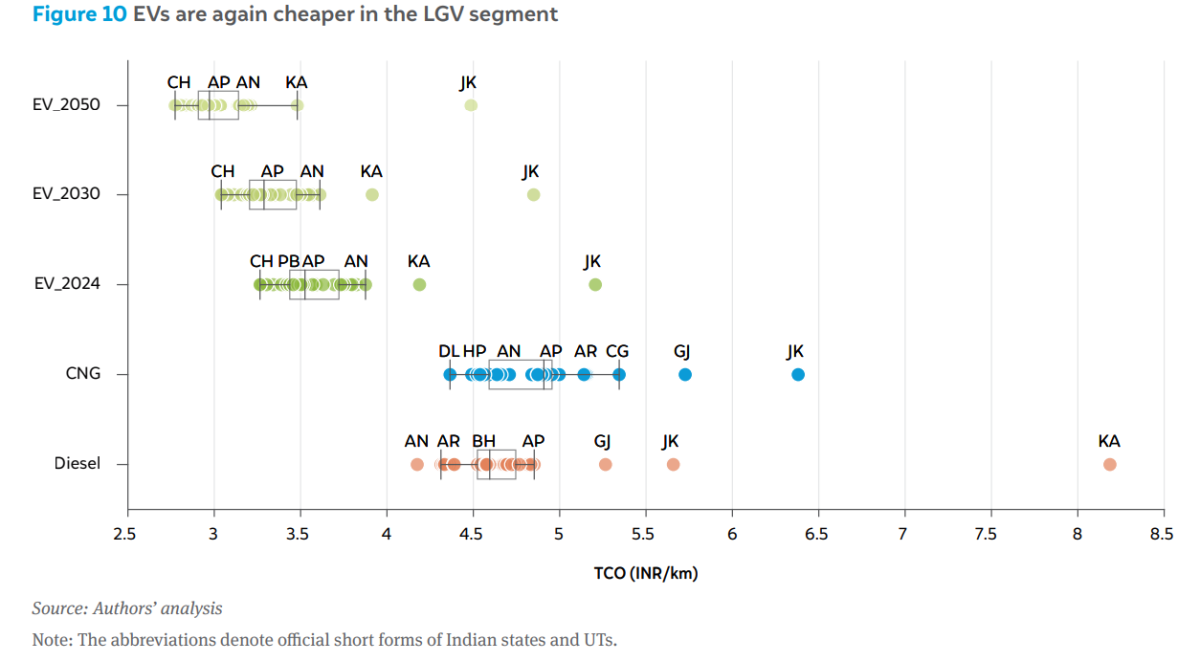
For LGVs, the comparison is like that of 3W-G, with EVs being much cheaper already in 2024. The usage patterns of LGVs, being primarily for short trips in more urbanised regions (also like 3W-G), make them more suitable for an EV transition. Fleet operators of LGVs have a greater scope to adopt EVs, as they can also deploy charging stations in their own premises based on the fleet size, utilisation, and routes, making it more economical. For smaller operators, the higher upfront cost, lack of familiarity with EV operations/charging and relative lack of access to public fast chargers may prove detrimental.
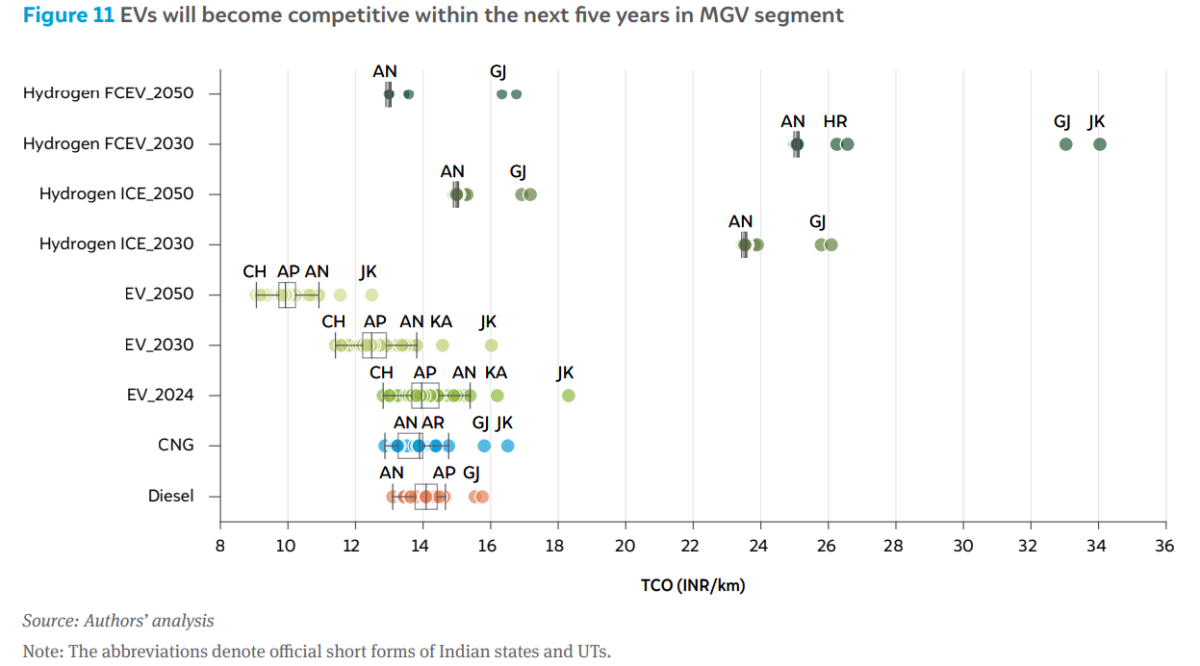
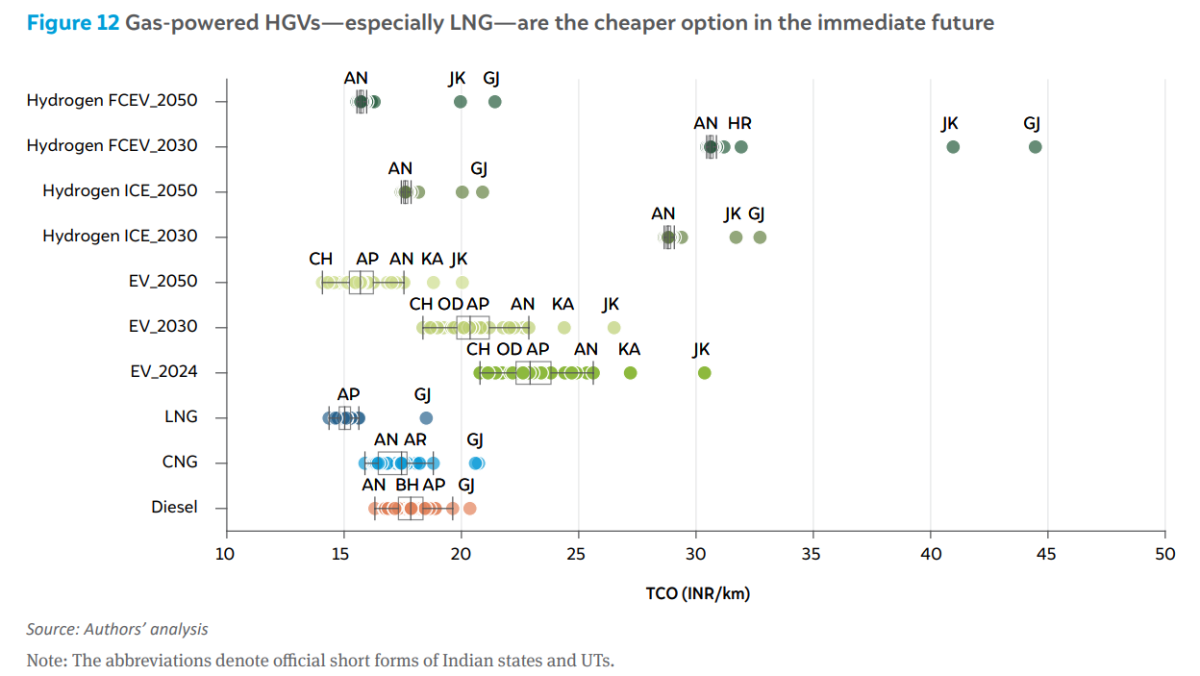
For M&HGVs, as seen in Figure 11 and Figure 12, EVs are more expensive than diesel, CNG, and LNG in 2024. At present, LNG is the cheapest fuel for HGVs, but refuelling infrastructure is nearly non-existent. While the TCO of electric M&HGVs will decline to become competitive beyond 2030, EV trucks will still be limited by a substantially lower range than diesel or natural gas-powered trucks (~250 km per charge vs ~600–800 km per refill). Thus, for the lower TCO to translate into market adoption, fast-charging capacity for heavy duty vehicles needs to be expanded significantly, and new battery technologies with higher energy density need to be commercialised.
In addition, dedicated charging infrastructure needs to be deployed with lower input costs of power (e.g., using dedicated RE and storage power plants instead of using grid power at commercial prices) to reduce the charging tariffs. We anticipate the cost of hydrogenfuelled trucks to also decline steeply, considering the investments being made by Indian industry on green hydrogen. Post 2040, hydrogen fuel-cell electric trucks may become a suitable choice for long-distance routes, while electric trucks will get deployed on intradistrict, short-haul segments.
Given the numerous parameters involved in estimating the TCO, and the uncertainties surrounding the lack of reliable data, we conducted a sensitivity analysis on some of the critical parameters of the TCO. These include annual distance travelled, maintenance cost, vehicle CAPEX, and fuel economy. Annual distance travelled and maintenance cost were adjusted by increasing them by 50 per cent and 100 per cent and reducing them by 50 per cent from the base case. Vehicle CAPEX and fuel economy were varied by ±10% and ±20% from the base case. This section presents the sensitivity results for selected vehicle categories and parameters. For each vehicle category, the state with the highest vehicle stock from Mohan, et al. (2025) and the parameter with the maximum deviation was chosen for illustration purposes.
Figure 13 illustrates the TCO difference between petrol and electric 2W in Uttar Pradesh under varying annual distance scenarios. The smallest TCO difference between petrol and EV TCO was observed in the 50 per cent lower scenario at INR 0.65 per km. As the distance driven increases, the cost gap widens, reaching INR 0.95 per km for the base case and INR 1.06 per km for the 50 per cent higher distance scenario. This indicates that as you drive longer, EV becomes the most affordable option for two-wheelers. For EV, a 50 per cent reduction in distance travelled leads to an 85 per cent increase in TCO, while a 50 per cent increase in distance results in 28 per cent decrease in TCO. For petrol, a 50 per cent reduction increases TCO by 38 per cent, and 50 per cent increase reduces TCO by 12 per cent. These trends indicate that EVs benefit more from higher usage as the other fixed costs (like CAPEX) are spread over more kilometres. In contrast, petrol 2W experience a comparatively smaller cost benefit with increased usage due to their higher running costs.
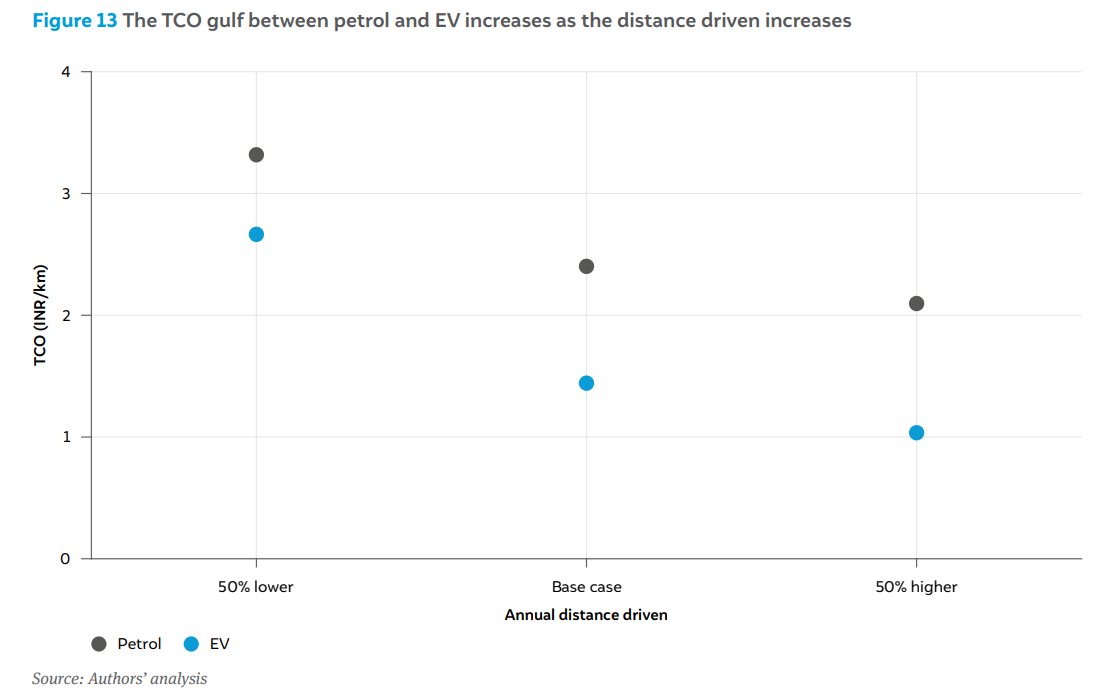
Figure 14 describes the impact of annual distance travelled on the TCO for different fuels in Maharashtra. When the distance travelled is reduced by 50 per cent, CNG emerges as the most cost-effective option. Among all fuel types, the rise in TCO due to lower distances is highest for EVs and lowest for petrol. Conversely, when distance increases, the TCO reduction is most significant for EVs and least for petrol. If the distance driven is reduced by 50 per cent, the TCO increases by 83 per cent for EVs, 71 per cent for CNG, 72 per cent for diesel, 77 per cent for petrol hybrid, and 58 per cent for petrol. As the distance travelled increases, EVs become the cheapest option, with a TCO reduction of approximately 28 per cent. These trends indicate that CNG is the more cost-effective option for lower usage, while EVs provide cost benefits for high-mileage users. In contrast, petrol and diesel remain relatively stable and do not offer significant cost benefits with changes in distance.
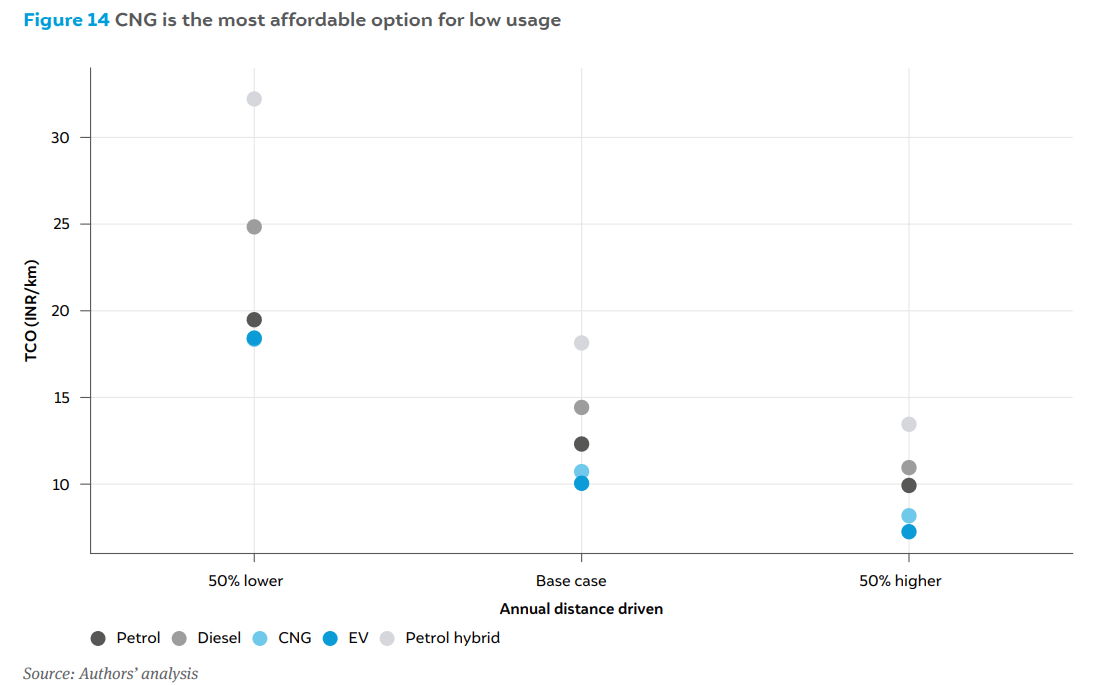
Figure 15 illustrates the effect of distance travelled and maintenance costs on TCO for different fuels in Madhya Pradesh. Similar to four-wheelers, EVs experience the highest TCO increase when distance decreases, while diesel is the least affected. Conversely, the reduction in TCO due to higher distances is highest for EVs and lowest for diesel. Diesel, CNG, and LNG remain in a similar cost range if the distance is lowered, with CNG and LNG being the cheapest and EV the most expensive. As distance increases, the cost gap between CNG, LNG, and diesel widens. The most affordable option is LNG, followed by CNG and diesel. Electric vehicles have the highest TCO in both the base case and 50 per cent lower distance scenario, and it only marginally pips diesel if the distance travelled increases by 50 per cent.
In the case of maintenance costs, reduction in TCO due to lower maintenance costs is most significant for LNG and CNG, with decreases of 18 per cent and 17 per cent respectively, while EVs show the smallest reduction at 8 per cent. Similarly, an increase in maintenance leads to proportional rise in TCO, with LNG increasing by 18 per cent, CNG by 17 per cent, and EV by 8 per cent. For every 50 per cent change in maintenance costs, the impact on TCO is 17 per cent for CNG, 18 per cent for LNG, 16 per cent for Diesel, and 8 per cent for EV. Electric vehicles remain the most expensive option in all scenarios except one, where higher maintenance costs cause them to slightly surpass diesel, making them the third most affordable option after LNG and CNG.
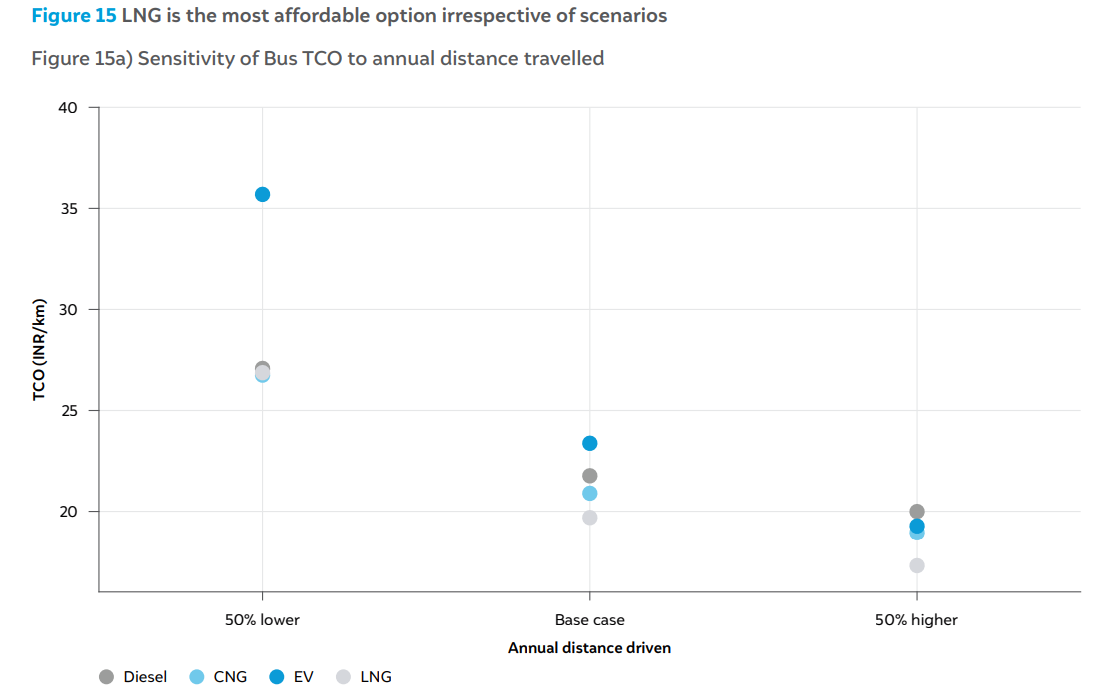
Figure 16 illustrates the effect of distance and maintenance on the TCO for different fuels in Maharashtra. Electric vehicles experience highest TCO reduction with increased distance, while diesel sees the smallest impact. Similarly, EVs also have the highest TCO increase when distance is reduced, with diesel being the least affected. Regardless of distance travelled, EVs remain the most affordable option across all scenarios. The maintenance cost has a minimal impact on TCO for this vehicle category, as fluctuations affect all fuels in similar proportions.
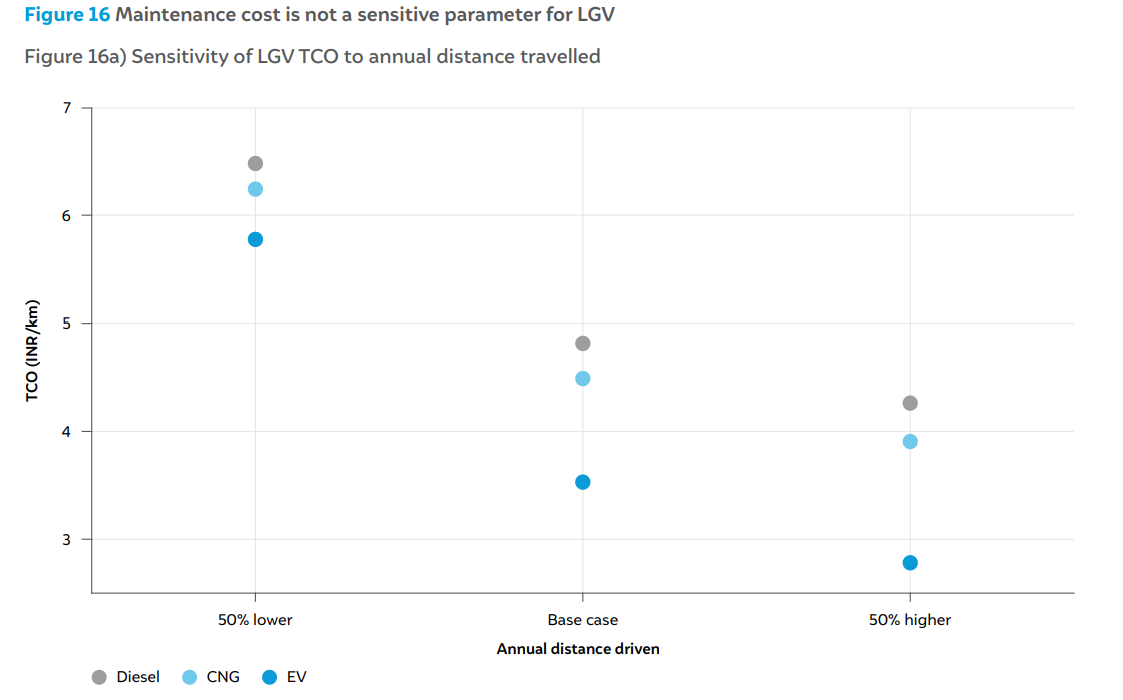
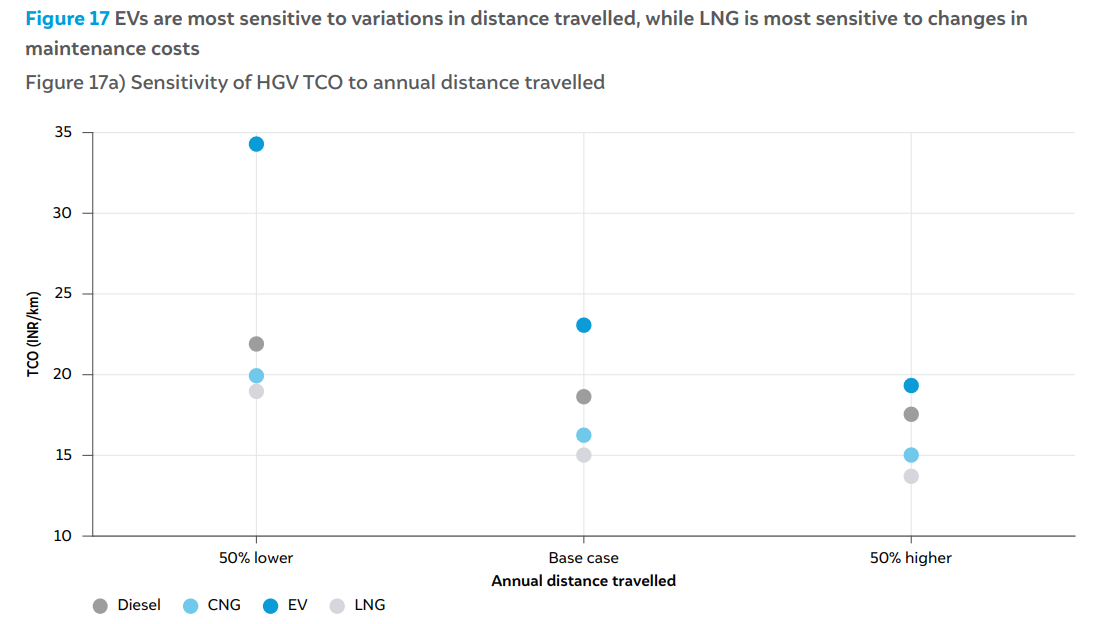
Figure 17 describes the impact of annual distance travelled and maintenance costs on TCO for different fuels in Maharashtra. The HGV category follows a similar pattern to LGVs, where EVs are the most impacted by distance travelled, while diesel is the least affected. As distance increases, the cost gap narrows between EV and other fuels, but even with a 50 per cent higher distance than the base case, EVs still remain the most expensive option, whereas LNG remains the most affordable option across all scenarios; LNG and CNG are the most sensitive to maintenance cost variations, while EVs are the least affected. For every 50 per cent variation in maintenance costs, the impact on TCO is 19 per cent for LNG, 17 per cent for CNG, 14 per cent for diesel, and 7 per cent for EV. As maintenance costs increase, the cost gap narrows between EV and other fuels, yet LNG remain the most economically viable option in all cases.
Our analysis has presented a comparison of total cost of ownership across different vehicle categories and fuel types for different states. The following sections discuss the overall findings and limitations.
Capital costs
Fuel costs
Fuel economy and annual mileage
Vehicle life
Maintenance costs
Since the goal of this study is to compare the costs of various powertrains within a vehicle segment, we have excluded certain cost parameters that are consistent across fuel types within a segment. For example, staff costs are a key component in calculating the TCO for a bus, but this cost remains unchanged regardless of powertrain, so it has been excluded. Similarly, toll charges are part of the TCO, but they have been consistent across fuel types within a segment.
Our comparisons show that for most vehicle segments, EVs are cheaper to own than their ICE counterparts by a fair margin. Among ICE powertrains, CNG and LNG are typically cheaper than average than petrol and diesel vehicles. Thus, for economically conscious buyers, which form a large portion of India’s automobile market, alternate fuel vehicles are already more promising.
However, in all cases, the lack of suitable public infrastructure likely constrains the demand growth for these vehicles, apart from other considerations like driving range, reliability, recharging time, etc. For example, in the case of CNG, those states and districts that have a substantial number of CNG stations are seeing high levels of such vehicle registrations, especially in the commercial segment (VAHAN 2024). With expanding CNG infrastructure, demand for the fuel will rise due to the lower TCO.
In the case of EVs, segments such as 2W and 3W are already seeing surging registration numbers driven by the lower TCO. The difference in TCO of EVs versus other fuels is highest for these two segments. For 4W, the EV TCO is similar to CNG and petrol TCO; consumers may prefer the conventional fuels as the upfront cost is low and refuelling infrastructure is more widespread. For taxis, the EV TCO is much lower than both petrol and CNG. In Delhi, for example, electric taxis are able to compete with CNG equivalents as there are widespread charging hubs. However, in other regions, EV taxis are yet to become popular. For larger vehicles like trucks and buses, efforts are needed to make the TCO more competitive with traditional fuels. Higher levels of indigenisation of EV powertrains and local production of cost-competitive batteries are required to reduce the capital costs.
Petrol hybrids are a good middle-ground option, as they offer a compromise between range and efficiency, but they suffer from high GST rates, making them less competitive. A revision in GST rates for hybrids for specific segments like taxis may be evaluated.
The TCO of LNG is the lowest for HGVs. Dedicated road-freight corridors can be established in those road routes/districts that are in proximity to LNG terminals; LNG trucks can have a range of over 1,000 km on a single tank, making regular routes viable.
On hydrogen, given the fact that the TCO becomes cheaper only beyond 2040, efforts can perhaps be focussed on FCEV powertrain indigenisation rather than H₂ ICE as the former is much more energy efficient. Hydrogen-fuelled vehicles may make sense only for longdistance, heavy duty operations, where battery EVs may be limited by range, weight, and charging time.
The Total Cost of Ownership (TCO) is a metric that captures the complete lifecycle cost of owning and operating a vehicle. It includes the initial purchase cost, taxes and fees, financing, fuel expenses, maintenance, insurance, and resale value. TCO provides a holistic basis for comparing the cost-effectiveness of different vehicle types and fuel technologies over time.
TCO is calculated by summing all expenses over the vehicle’s lifetime in present value terms and dividing by the total distance driven. This yields the total cost of ownership per kilometre, enabling consistent comparison across fuel types within a vehicle segment.
Our analysis shows that EVs are already more economical to operate in the two- and three-wheeler segments. For four-wheelers, EVs are cost-effective in states where low electricity tariffs help offset higher upfront costs. In other vehicle segments, EVs are expected to become cheaper to run within the next five to ten years as battery and vehicle costs continue to decline.
Hydrogen is better suited for long-distance, heavy-duty applications such as buses and heavy goods vehicles (HGVs). In these segments, hydrogen (either internal combustion or fuel cell) is expected to become economically viable by the late 2030s. With adequate hydrogen supply and supporting infrastructure, there is a strong potential for uptake of hydrogen vehicles in India.
How Secure is India’s Energy Future?
Unlocking the Potential for a Gas-Based Economy in India
Advancing India’s Green Steel Transition
CO₂ Pipeline Network for Carbon Capture and Storage in India

Bharat Cleantech Manufacturing Platform: Green Hydrogen Indigenisation Pathways