Council on Energy, Environment and Water Integrated | International | Independent
Suggested citation: Mohan, Dharshan Siddarth, Sabarish Elango, Hemant Mallya, Himani Jain, and Anannya Jha. 2025. What is Fuelling India’s Road Transport Sector? Projecting District-Level Energy Demand. New Delhi: Council on Energy, Environment and Water.
This report presents an estimation of energy demand from the transport sector in different districts till 2050. This report integrates three components: the vehicle stock model (VSM), which projects district- level vehicle stock; the total cost of ownership (TCO) model, which compares ownership costs across fuel types within vehicle segments; and the fuel choice model (FCM), which allocates future vehicle registrations in each segment to fuel types based on TCO outcomes, survey-based adoption rates and refuelling infrastructure constraints. The study provides insights into regional shifts in energy demand, supporting informed decisions on infrastructure planning for refineries, battery manufacturing, EV charging, and gas refuelling. Additionally, this report also offers projections on the evolving landscape of fuel tax revenues.
India’s road transport sector faces a critical transition period with multiple competing fuels and technologies, such as the incumbent petrol and diesel, and newer options like compressed natural gas (CNG), liquefied natural gas (LNG), electricity, and green hydrogen.
The sector needs to balance multiple challenges:
Our transportation fuel forecasting model (TFFM) is the first comprehensive model that allows for district-level analysis and projections of vehicle stock and energy demand from road transport. The study provides actionable insights for multiple stakeholders:
Our model facilitates a comprehensive understanding of shifting energy demand patterns across different regions, enabling informed decision-making on infrastructure development priorities and targeted policy interventions. It will help address planning challenges for refinery capacity, battery manufacturing, CNG/LNG refuelling stations, and EV charging stations. Additionally, the model will also provide valuable insights into the evolving dynamics of fuel tax revenues over time.
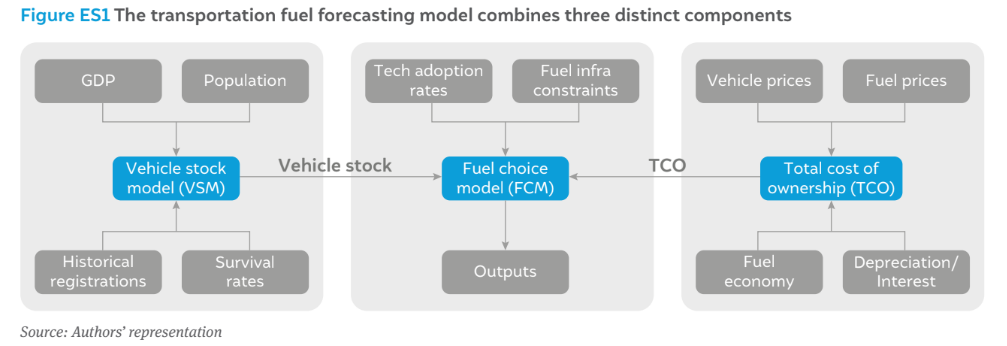
The TFFM projects energy demand from eight different fuels and 10 vehicle segments at a district level by combining three components, as shown in Figure ES1.
The steps then repeat for the next cheapest fuel option and so on till all new registrations in that vehicle segment are allocated to the available fuel types.
Using the above process, we arrived at the district-level vehicle stock by fuel type. Based on the assumptions of fuel economy and annual mileage (Elango, Mohan, et al. 2025), we calculated the demand for each of the eight fuel types in each district in the country.
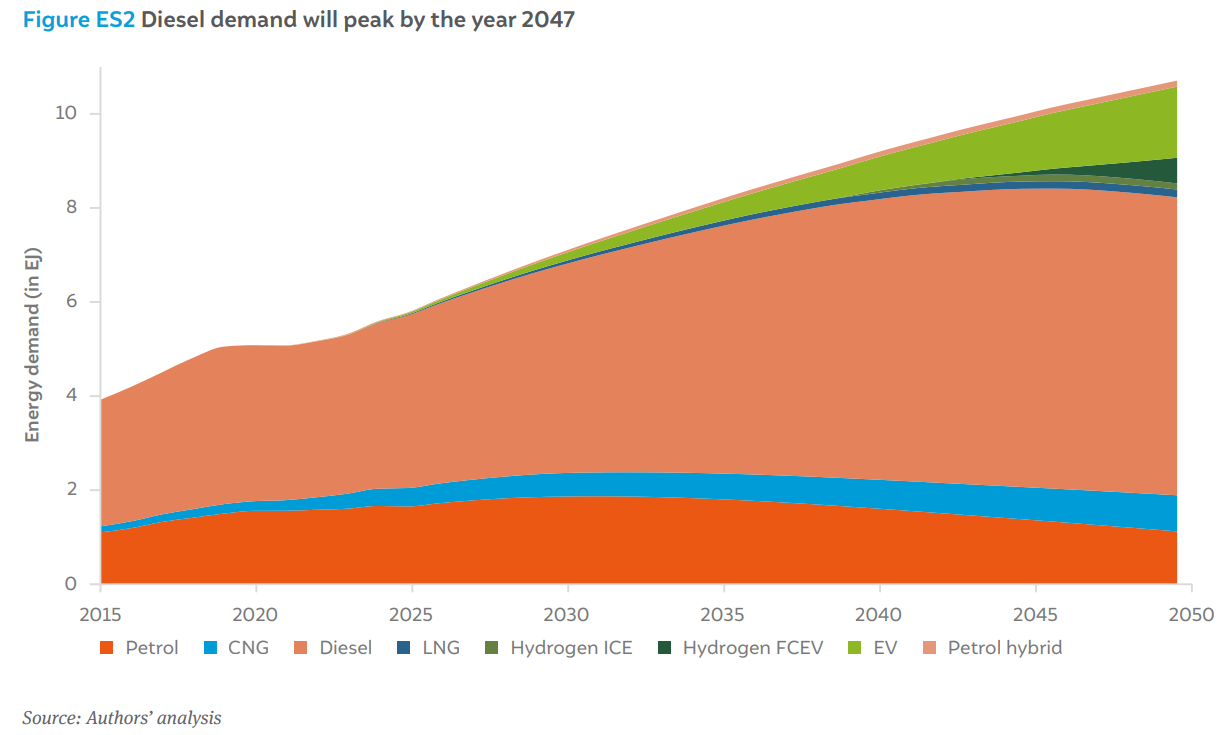
According to our projections, the total energy demand from road transport is projected to double from 5.3 Exajoule (EJ) (2023) to 10.7 EJ (2050), as shown by Figure ES2. In the baseline scenario, we expect diesel to still form a large portion of the demand, accounting for nearly 60 to 65 per cent of the total energy demand, as the bus and heavy goods vehicle (HGV) segments do not transition to EVs due to range and infrastructure limitations. Diesel demand starts declining only in the late-2040s (in 2047 with a peak demand of 6.4 EJ) once hydrogen fuel cell-electric vehicles (FCEVs) gain market share. In contrast, petrol demand peaks by 2032 with a peak demand of 1.9 EJ, as most petrol-powered vehicles in the two-wheeler (2W), three-wheeler (3W) and four-wheeler (4W) segments switch to EVs as they are cheaper to own and run overall.
At a state level, our projections indicate shifts in demand patterns between 2023 and 2050 (Figure ES3). Northern states, especially Uttar Pradesh, will see the largest growth in energy demand due to a large, still-growing population and lower gross domestic product (GDP) per capita levels at present. The demand share of Uttar Pradesh increases from 10.1 per cent (2023) to 18.3 per cent (2050). On the other hand, the shares of southern states like Tamil Nadu, Karnataka, Telangana, and Kerala decline as their populations will peak sooner.
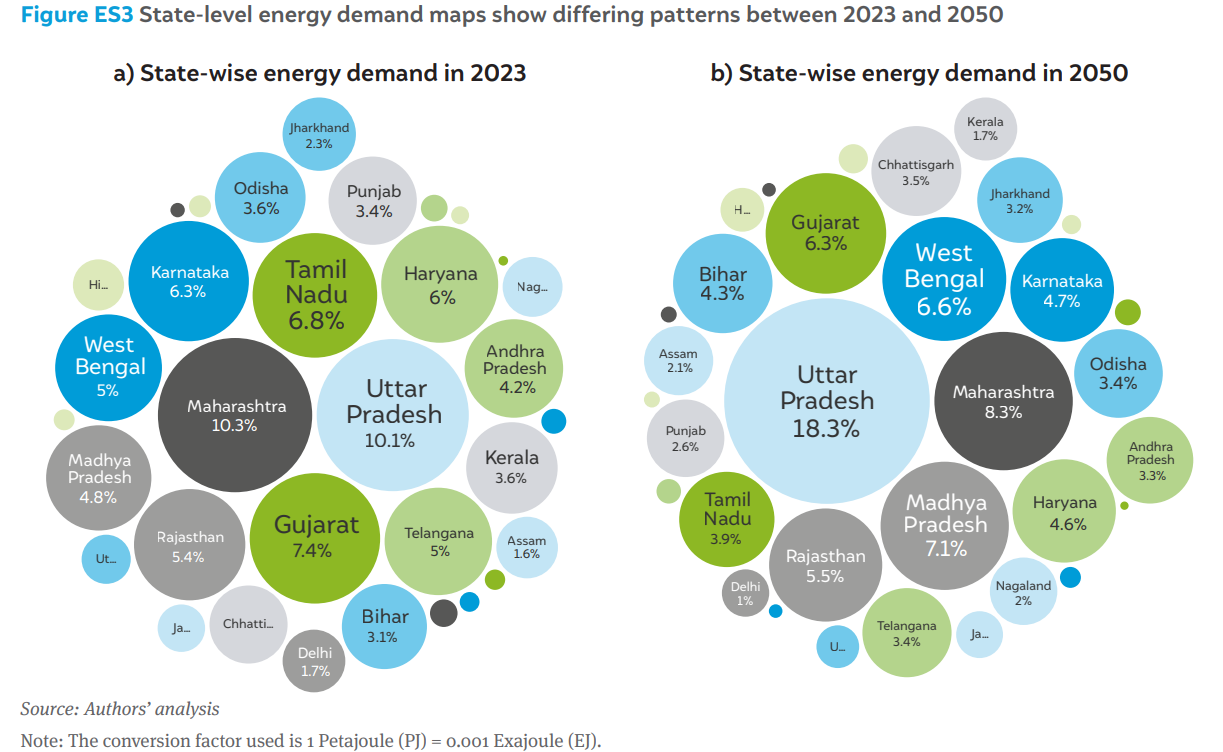
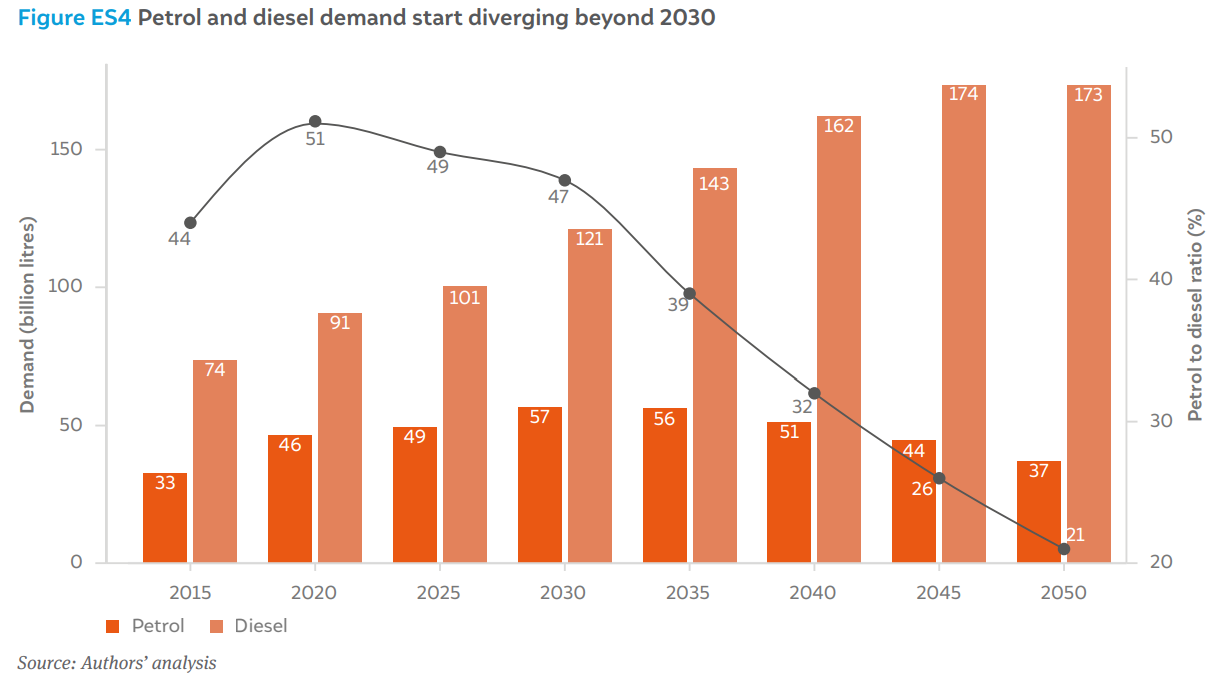
Figure ES4 shows the change in demand for petrol and diesel over the projection period and reveals a diverging demand pattern. The ratio of petrol to diesel demand starts declining steadily beyond 2030; this trend could make it difficult for refineries to meet the diesel demand in their current configuration, which has limited flexibility to change the product mix.
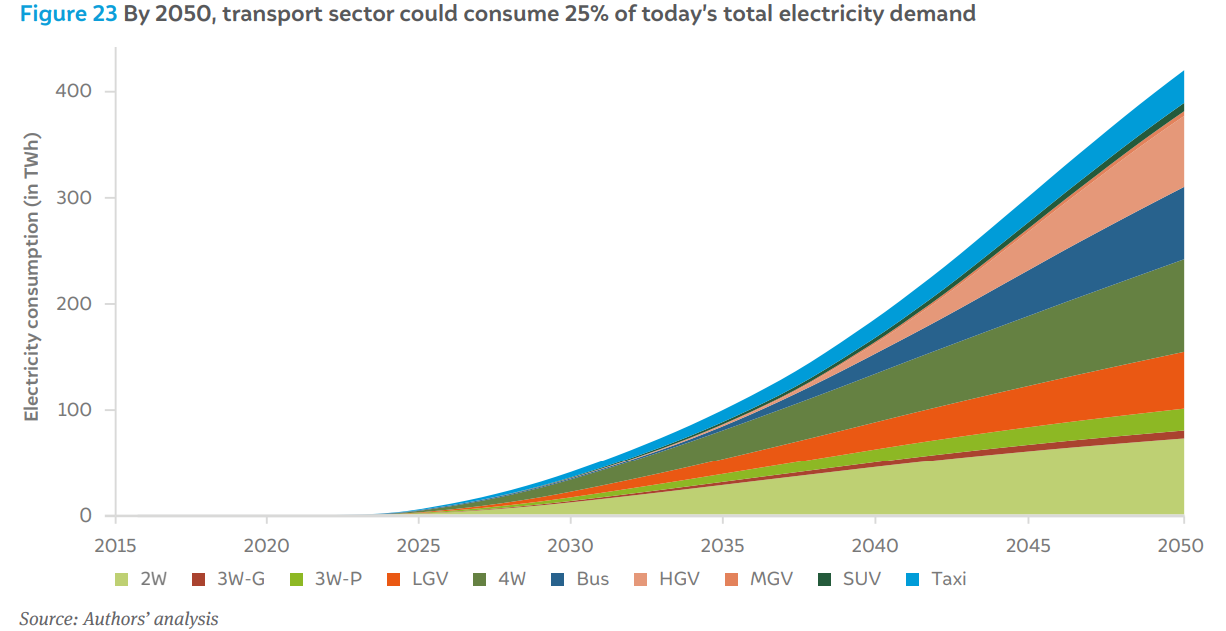
Even though the share of electricity in the energy demand rises to only 14 per cent by 2050, the equivalent electricity demand of 420 TWh in 2050 (Figure ES5) is significant—it is a quarter of India’s generation of 1,734 TWh in 2023–24 (NITI Aayog 2024).

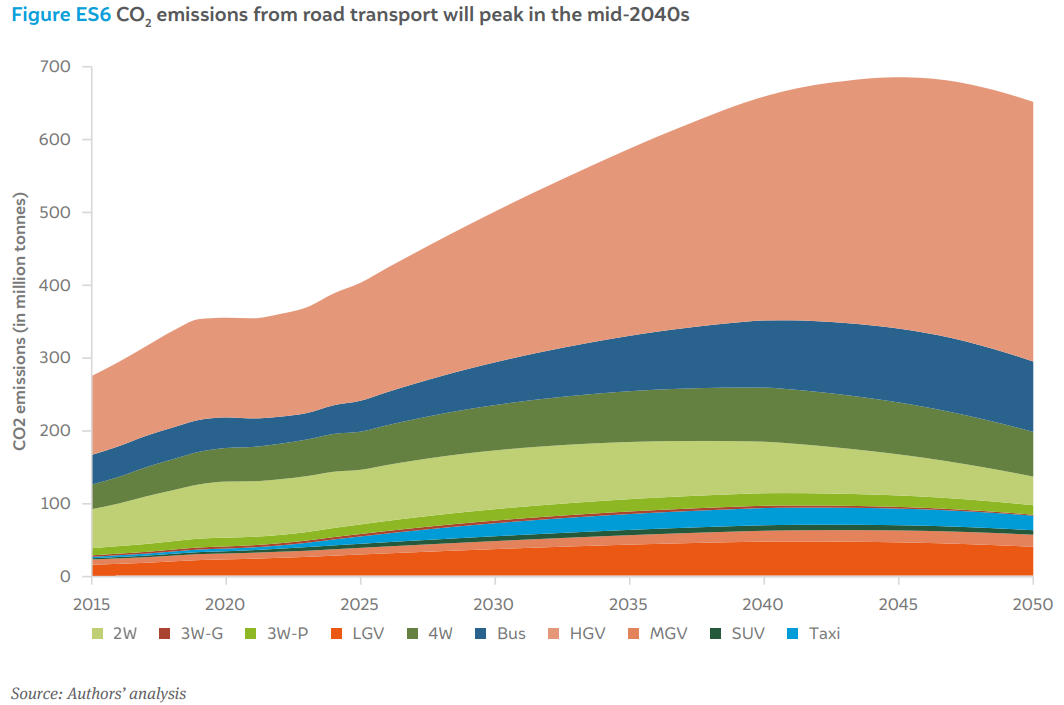
CO2 emissions from road transport peak at 685 Mt by 2045 before starting to decline (Figure ES6). Heavy vehicles (especially HGVs) remain the biggest challenge; HGVs contribute more than half of the CO2 emissions annually post-2040, indicating the need for dedicated policies and regulations to accelerate the energy transition for this segment.
India’s diverse automotive landscape encompasses a wide array of vehicles, from twowheelers to heavy duty trucks, powered by an increasingly varied mix of fuel options. Traditional fossil fuels such as petrol and diesel continue to dominate. However, with the rapid pace of technological innovation, alternatives like natural gas (CNG and LNG), green hydrogen (H₂), and electric powertrains are gaining traction and competing to define the future of mobility in the world’s most populous nation.
The uncertainty about the transition affects various stakeholders in the following ways:
In 2021, road transport accounted for 14 per cent of total final energy consumption, and 92 per cent of all transport-related energy demand, of which 95 per cent is covered by petrol and diesel. Other fuels, such as natural gas and electricity, still play a minor role. To fulfil most of this energy requirement, India imported 232.5 Mt of crude oil (87.7 per cent of its total requirement) in 2023–24. Given this context, transportation sector decarbonisation becomes crucial to meets India’s net-zero target of 2070, while ensuring it becomes ‘Atmanirbhar’ (selfreliant) for its energy needs.
To achieve its 2070 net-zero target and reduce emission intensity by 45 per cent by 2030 (compared to 2005 levels), the Indian government is actively implementing various measures. However, as the world’s fourth-largest crude oil refiner, with an installed refining capacity of more than 250 million tonnes per annum (Mtpa), India is simultaneously planning to expand this capacity to 300 Mtpa by 2028 (S&P Global 2025). Of this, projects accounting for nearly 37 Mtpa are set to be commissioned between 2024 and 2026. This capacity expansion requires careful planning, as the rapid adoption of alternative fuels could lead to stranded assets, rendering the additional refining capacity underutilised or obsolete over time.
Natural gas is increasingly being viewed as a cleaner transition fuel. As of December 2023, India has approximately 33,347 km of authorised natural gas pipelines, with 24,723 km operational and 10,498 km under construction (Petroleum and Natural Gas Regulatory Board [PNGRB] 2024). Expanding the pipeline network requires a thorough understanding of current offtake and projections of future geographic demand to ensure optimal utilisation of the upgraded capacity.
However, the expansion of gas infrastructure also presents the challenge of a simultaneous dual transition: first, from petrol and diesel to natural gas, and second, from fossil fuels to electricity. If natural gas serves only as a transitional fuel, poor utilisation of the infrastructure after the shift to electricity could pose significant challenges in recovering the capital invested.
In 2017–18, road transport accounted for nearly nine per cent of the total national emissions (GHG Platform India n.d.). For India to meet its net-zero emissions target, decarbonisation of road transport is important, as it will also experience significant demand growth in the coming decades. Electrification is a crucial lever for minimising vehicular emissions. The government is actively promoting electric vehicles (EVs) through schemes such as Faster Adoption and Manufacturing of Hybrid and Electric Vehicles in India (FAME), and pilots like the National Highway for Electric Vehicles (NHEV) to expand charging infrastructure along highways. Accelerating EV adoption requires addressing current infrastructural deficiencies and understanding how public perceptions of these challenges impact adoption rates.
In passenger transport (2W, 3W, cars, and buses), where electrification is considered key to decarbonisation, it is crucial to assess and project the rise in electricity demand and its impact on the grid. A shift towards renewables is necessary, along with grid and storage infrastructure upgrades, to ensure that mobility transitions are truly green. Investment in public charging infrastructure is essential and making the choice between fast and slow charging is a critical consideration. Additionally, the assessment of technologies such as battery swapping and sodium-ion batteries will be crucial for shaping the future of EV adoption.
Electrification of freight poses significant challenges due to battery capacity, size and weight limitations, which can reduce a vehicle’s payload. Green hydrogen is viewed as a potential solution for decarbonising freight movement, particularly for medium- and heavy duty vehicles (MDVs and HDVs), which are among the heaviest emitters. To accelerate this transition, the government has launched the National Green Hydrogen Mission (NGHM), aiming to position India as a hub for green hydrogen.
However, scaling up hydrogen usage presents its own set of challenges. It requires expensive high-pressure or cryogenic storage systems. Burning hydrogen in internal combustion engines (ICE) is inefficient compared to fuel cells, and India currently lacks significant experience in manufacturing fuel-cell powertrains. Indigenising this technology will demand substantial investment in research and development to scale up production. Moreover, widespread hydrogen adoption will only be feasible if production costs are reduced enough to make it cost-competitive.
Therefore, in order to develop coherent policies that accelerate the process of decarbonisation of road transport, it is essential to assess future energy demand and fuel-mix compositions, to align the infrastructure development with long-term sustainability goals. This study combines India’s segmental vehicle stock calculated by analysing the historical stock (Mohan, et al. 2025), and the total cost of vehicle ownership across fuel choices (Elango, Mohan, et al. 2025). Together with a fuel choice model that incorporates infrastructure constraints, technology adoption rates, and scenario-based assumptions, these components form a comprehensive transportation fuel forecasting model (TFFM) that projects future energy demands across different vehicular segments and regions. The model aims to provide policymakers and industry stakeholders an analytical tool to identify the most effective pathways to achieve sustainable decarbonisation of India’s road transport sector.
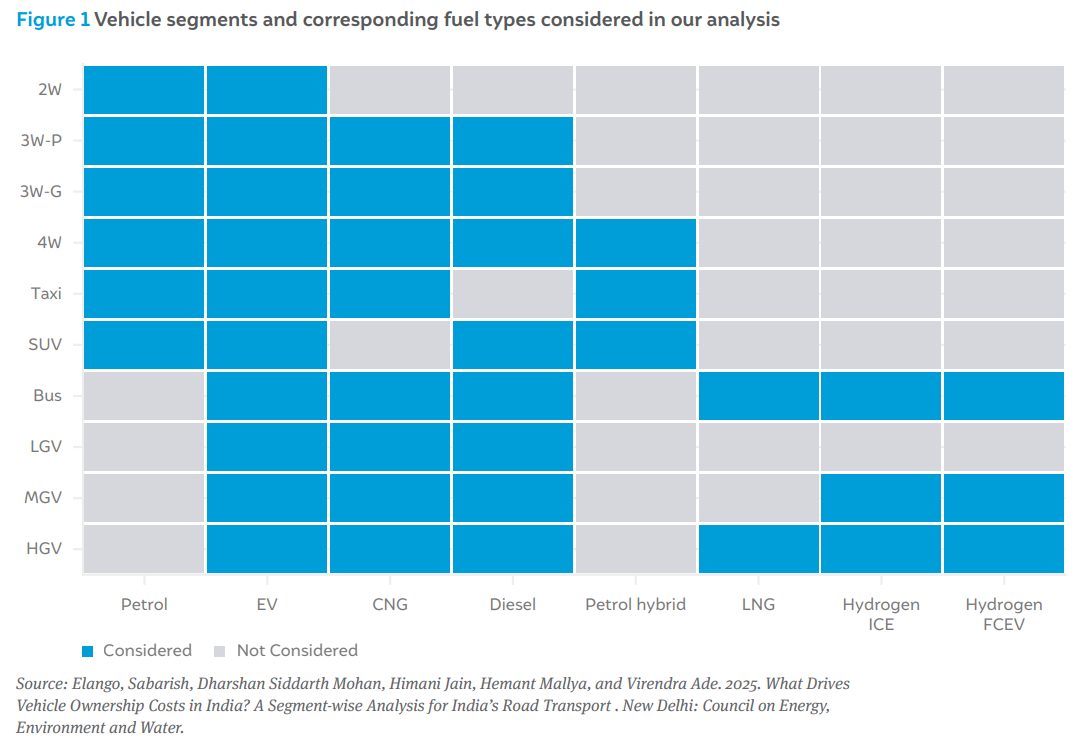
Mohan, et al. (2025) calculated the vehicle stock till 2050 at a district level for the ten vehicle segments given in Figure 1. Elango, Mohan, et al. (2025) calculated the TCO for the different fuels available to each vehicle segment (now and in future).
Several studies have utilised similar methods for vehicle stock projections, using GDP per capita-based Gompertz projections for overall stock in different vehicle segments (IEA, IIT-D, CEEW, Tsinghua University). Fuel-wise stock calculations were made using logit models that consider TCO, range anxiety and charging time (for EVs), model availability, etc. These logit models calculate the probability of adopting different fuel types based on consumer surveys on the importance of each of these parameters (Keith, Struben and Naumov 2020; Hess, et al. 2009).
However, obtaining probabilities through consumer surveys has some limitations:
The cited studies have tried to mitigate for these issues by:
However, in the Indian context, since important future technologies like EVs and H₂ vehicles are in the nascent stages of adoption or development, obtaining revealed preferences or actual market data is not possible. Therefore, for our study, we obtained anticipated adoption rates from a survey of transport sector experts for electric and hydrogen vehicles, while the adoption of other fuel types was limited by the projected refuelling infrastructure growth. The sections below detail the structure and methodology of the overall model, the expert survey, and the infrastructure constraints.
Figure 2 shows the structure of the TFFM, including all three components. Mohan, et al. (2025) and Elango, Mohan, et al. (2025) discuss the VSM and TCO calculations in detail. In short, the VSM projects vehicle registrations and vehicle stock across districts for each year till 2050 using historical registrations data and GDP per capita projections. The TCO calculator finds the cheapest fuel option for each vehicle segment in each year till 2050 based on projections of vehicle prices, fuel prices, maintenance costs, fuel economy, annual mileage, etc.
This report introduces the FCM, which takes the future annual registrations and yearly TCO data to project the fuel-wise registrations and stock. The projections of fuel choice use two parameters—adoption levels of new technologies in each year (based on an expert survey on anticipated consumer preferences and perceptions), and the presumed build-out of refuelling/ recharging infrastructure (for newer technologies like CNG, LNG, electric, and green H₂).
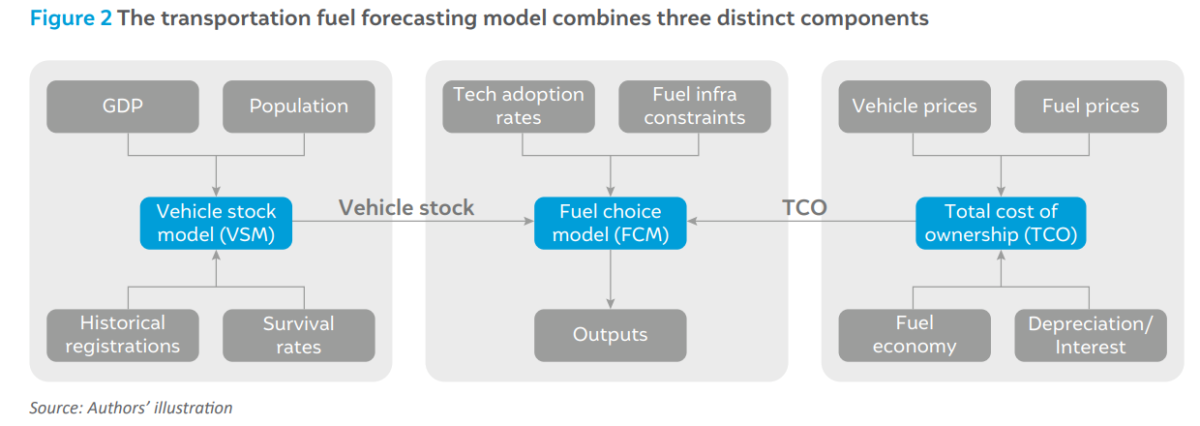
The decision-making process employed by the FCM assigns fuel types to newly registered vehicles in each segment by following three steps:
The steps then repeat for the next cheapest fuel option and so on till all new registrations in that vehicle segment are allocated to the available fuel types. We took a TCO-first approach in the FCM; a bulk of new registrations are two-wheelers and commercial vehicles (Mohan, et al. 2025), segments that are highly price-sensitive in India (Taj, et al. 2025). Thus, the cheapest fuel types within a vehicle segment get first priority for new registrations, and are then constrained by the adoption rate and refuelling/recharging infrastructure.
The below subsections provide more information on the consumer preference survey of transport sector experts and refuelling capacity modelling.
Of the seven different fuel types we considered, two are incumbent fuels with widespread adoption in the present day—petrol and diesel. CNG, while well adopted in select cities such as Mumbai and Delhi, remains relatively uncommon across much of the country. Four other fuels—petrol-hybrid, LNG, electricity, and hydrogen—are more unconventional, and are uncommon. Of these, two stand out for being markedly different from the rest in terms of powertrain design, operation, refuelling infrastructure, and nascency in the market— electricity and hydrogen.
As mentioned in Section 2, obtaining consumer preferences for newer and unconventional technologies and fuels through a consumer survey has several limitations. Therefore, for our analysis, we obtained anticipated consumer preferences only for EVs and H₂ vehicles from a survey of transport sector experts from academia, think-tanks, industry, and government.
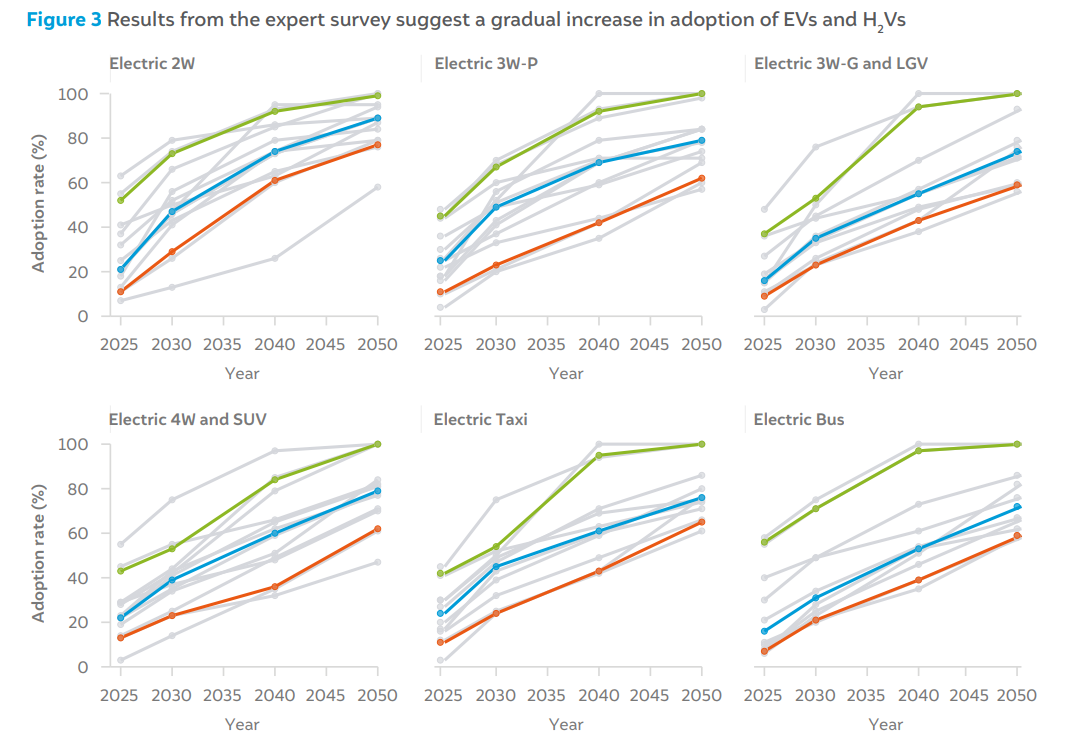
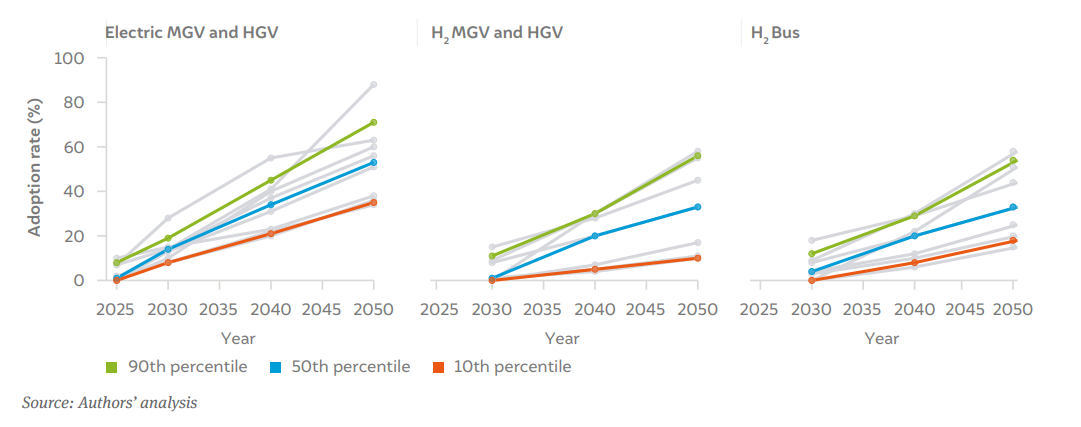
The survey posed questions on the anticipated influence of the below parameters on purchase decision in 2025, 2030, 2040, and 2050:
The respondents provided probability values for each of these parameters for the given years, and also provided the weightage of each parameter itself. The adoption rate was thus calculated as the sum-product of weightage and probability for each year. Figure 3 shows the results from the survey for various vehicle categories. The experts believe that 2W, 3W, and LGV EVs will see the quickest adoption by the market. On the other hand, they expect the M/ HGV segment to be the slowest to transition to electricity or hydrogen. The survey framework and questions are provided in the Annexure.
Typically, infrastructure deployment has lagged behind the adoption of, or the intent to adopt, newer fuel types (Harrison and Thiel 2017). Therefore, beyond expected consumer perceptions, we also estimated the potential infrastructure build-out for refuelling/recharging stations. We projected infrastructure growth for CNG, LNG, and EV charging stations based on past trends, regulatory authorisations, and assumed growth rates. By correlating the new infrastructure in each district with the new registrations of that district each year, we estimated the number of new registrations that can be supported by this infrastructure.
Petrol and diesel
As petrol and diesel are incumbent fuels with widespread availability, we do not expect perceptions or availability to constrain demand for them. As such, if petrol or diesel have the cheapest TCO for any vehicle segment, all new registrations are allocated to these, without checking steps 2 and 3 in the structure (see section 2.1).
CNG
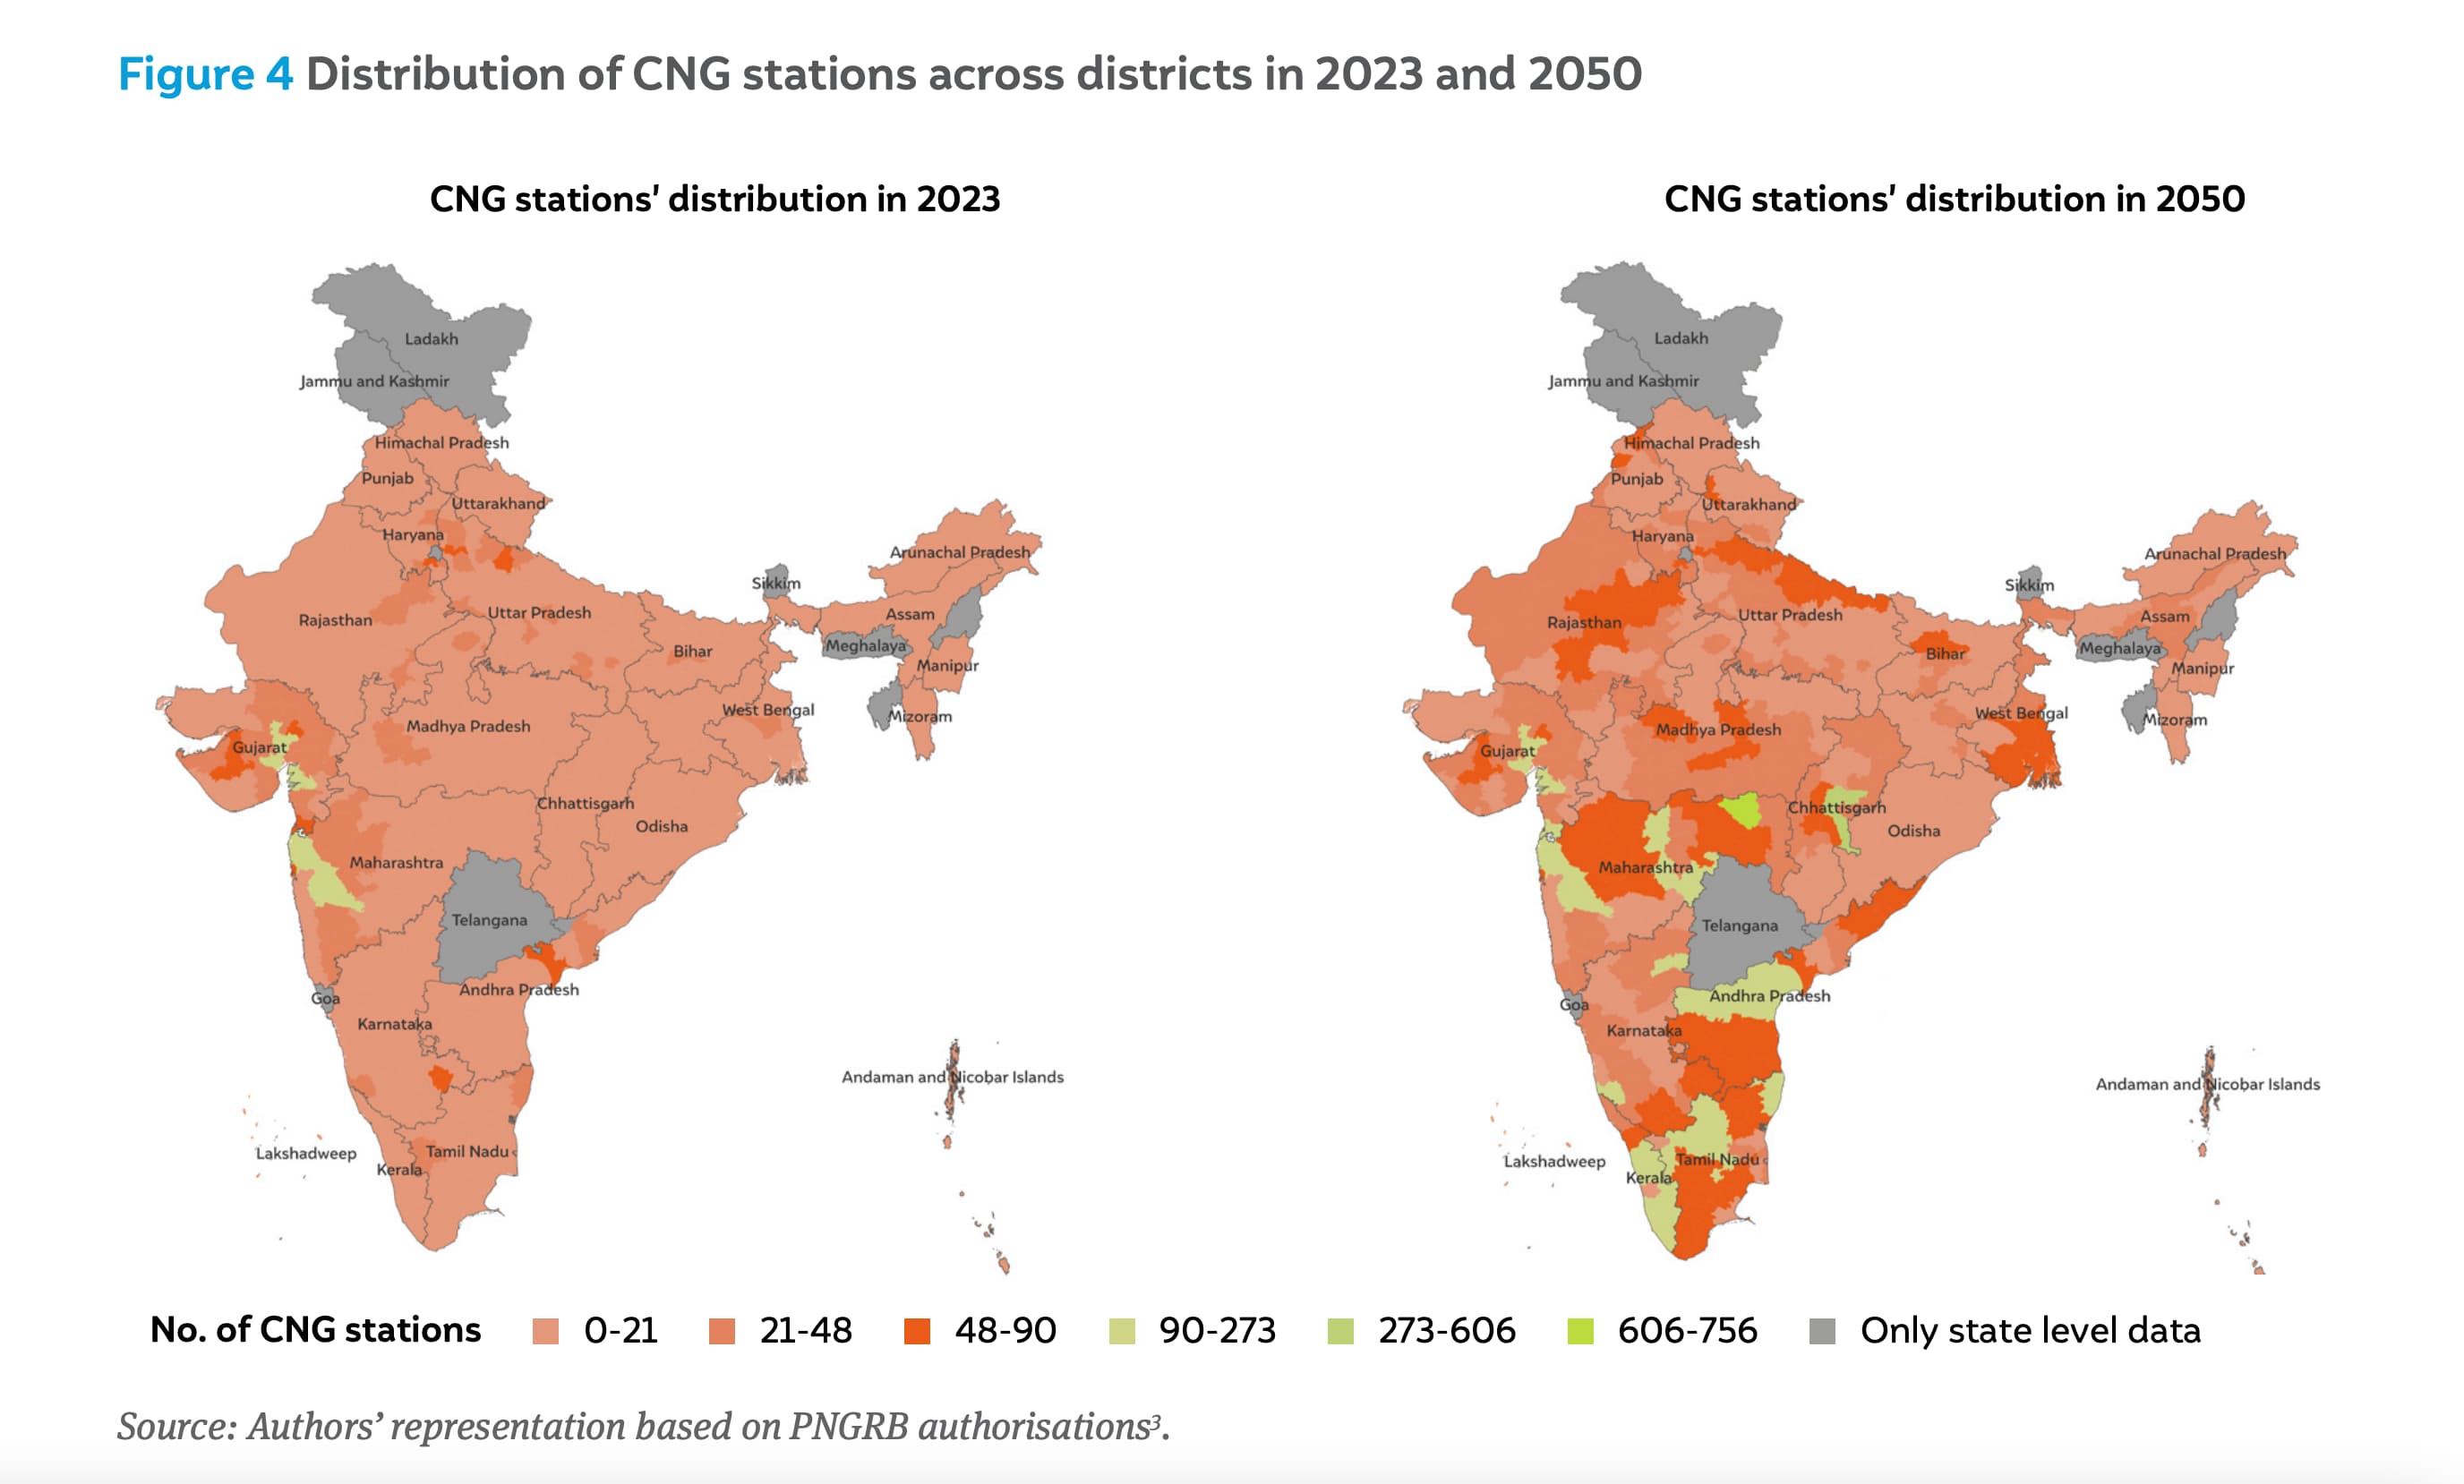
The availability of CNG depends on the development of natural gas transmission and distribution pipelines. Authorisations for the development of gas pipeline networks and subsequent distribution of gas to various consumers are provided by the Petroleum and Natural Gas Regulatory Board (PNGRB). The PNGRB has authorised the development of city gas distribution (CGD) areas covering most of the country (PNGRB n.d.). The recent authorisations issued to city gas distributors also include conditions on CNG station buildout over an eight-year period. We compiled the authorised developments of CNG stations from the authorisation letters available with PNRGB2 , along with statistical reports of the Ministry of Petroleum and Natural Gas (2024) and the Petroleum Planning and Analysis Cell (PPAC 2024). We also obtained data from PNGRB through right-to-information (RTI) queries on historical data on CNG stations and dispensation.
Beyond the authorisations issued as of November 2024, we did not assume any further increase in the number of CNG stations. We instead assumed increasing utilisation factors of the CNG stations. From the RTI data obtained for 2023–24, we calculated the weighted average dispensation per station between the 10th and 90th percentile of values—this amounted to 730 tonnes of CNG per station in that year. We assumed that all stations dispensing a lower volume would linearly increase their output to this level by 2050 (stations with a higher dispensation were assumed to maintain the same level).
LNG
We constrained the availability of LNG to only buses and HGVs. In the base case, we assumed that LNG would be available only in those districts that have existing or upcoming LNG import terminals. Currently, there are six operational LNG terminals in India, while five more are under construction (Ministry of Petroleum and Natural Gas 2024).
For buses, we assumed that all buses registered in a district that has an LNG terminal can switch to LNG, should the TCO be cheaper. For trucks, we obtained data on district-wise freight movement from a 2010 survey conducted by Rail India Technical and Economic Service (RITES Ltd.) for the Planning Commission (now NITI Aayog). The survey data carried information on the tonnage, origin and destination (at a district level) of cargo carried by MGVs and HGVs in 2010. We mapped the road routes for the top-80 per cent of tonnage in the country using the origin-destination (O-D) pairs and a routing algorithm based on OpenStreetMap (OSM) (Figure 5).
Figure 5 Truck routes accounting for 80% of India’s total freight tonnage, mapped across 4000 O-D pairs
Source: Authors’ representation based on RITES data
Using this data, we assumed that LNG will be adopted only on following conditions in the base case:
We assumed the growth in the number of public charging stations at a district level based on the existing deployment levels of public chargers. In our analysis, we assumed that buses, MGVs and HGVs rely primarily on public charging stations, while 4Ws, SUVs, and taxis rely on both private and public charging stations. We assumed that 2Ws, 3W-P, 3W-G, and LGVs rely only on private chargers, as these vehicles are used mainly for shorter trips.
We obtained data from the Bureau of Energy Efficiency (2024) on the number, capacity, and address of all public charging stations in the country. We found that charging stations had capacities ranging from 3 kW to over 100 kW. We divided these capacities into three buckets: slow (up to 10 kW), medium (10–50 kW), and fast (over 50 kW). We assumed that the first two categories are available to 4Ws, while the third category is used by heavy vehicles. For each category, we also calculated the number of EVs that can be charged per year based on the annual electricity consumption for each vehicle category and the assumed electricity generation per station (Elango, Mohan, et al. 2025).
We then assumed the number of charger additions annually for each of these three categories till the year 2050. More information on the charging capacity assumptions is given in Table 1. We applied these category wise national growth rates to a district level using the number of chargers in that district as of September 2024. For districts that do not have any public chargers, we assumed that the first slow chargers (50 kW) by 2030. Based on the 2024 data and assumed growth patterns till 2050, Figure 6 shows the district-wise spread of public charging stations.
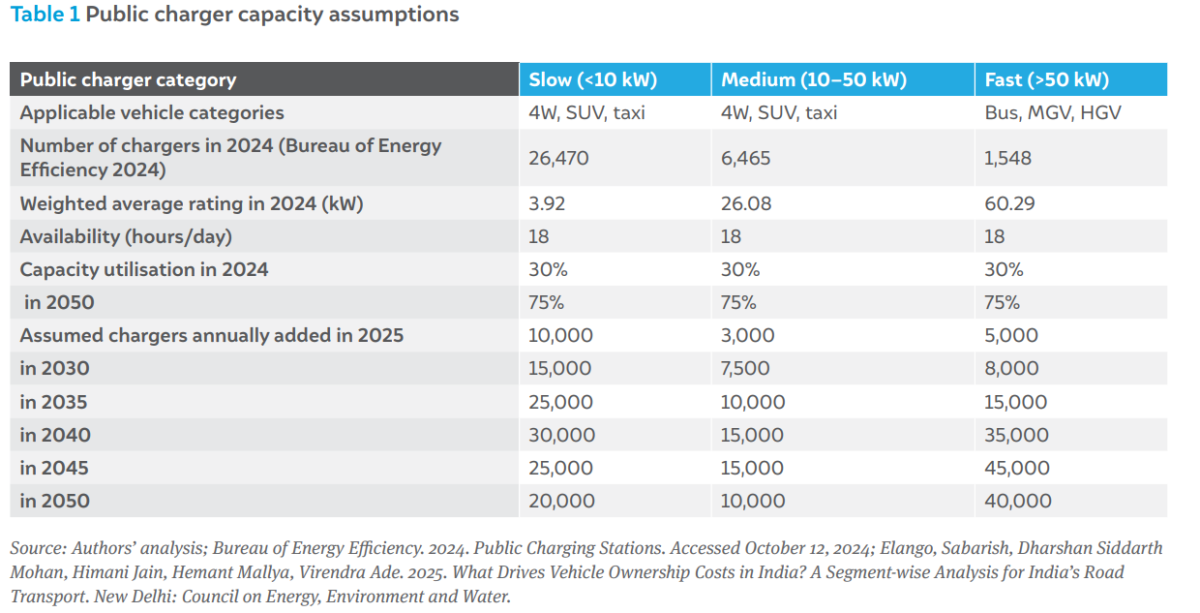
Figure 6 Distribution of EV charging stations at the district level by 2050
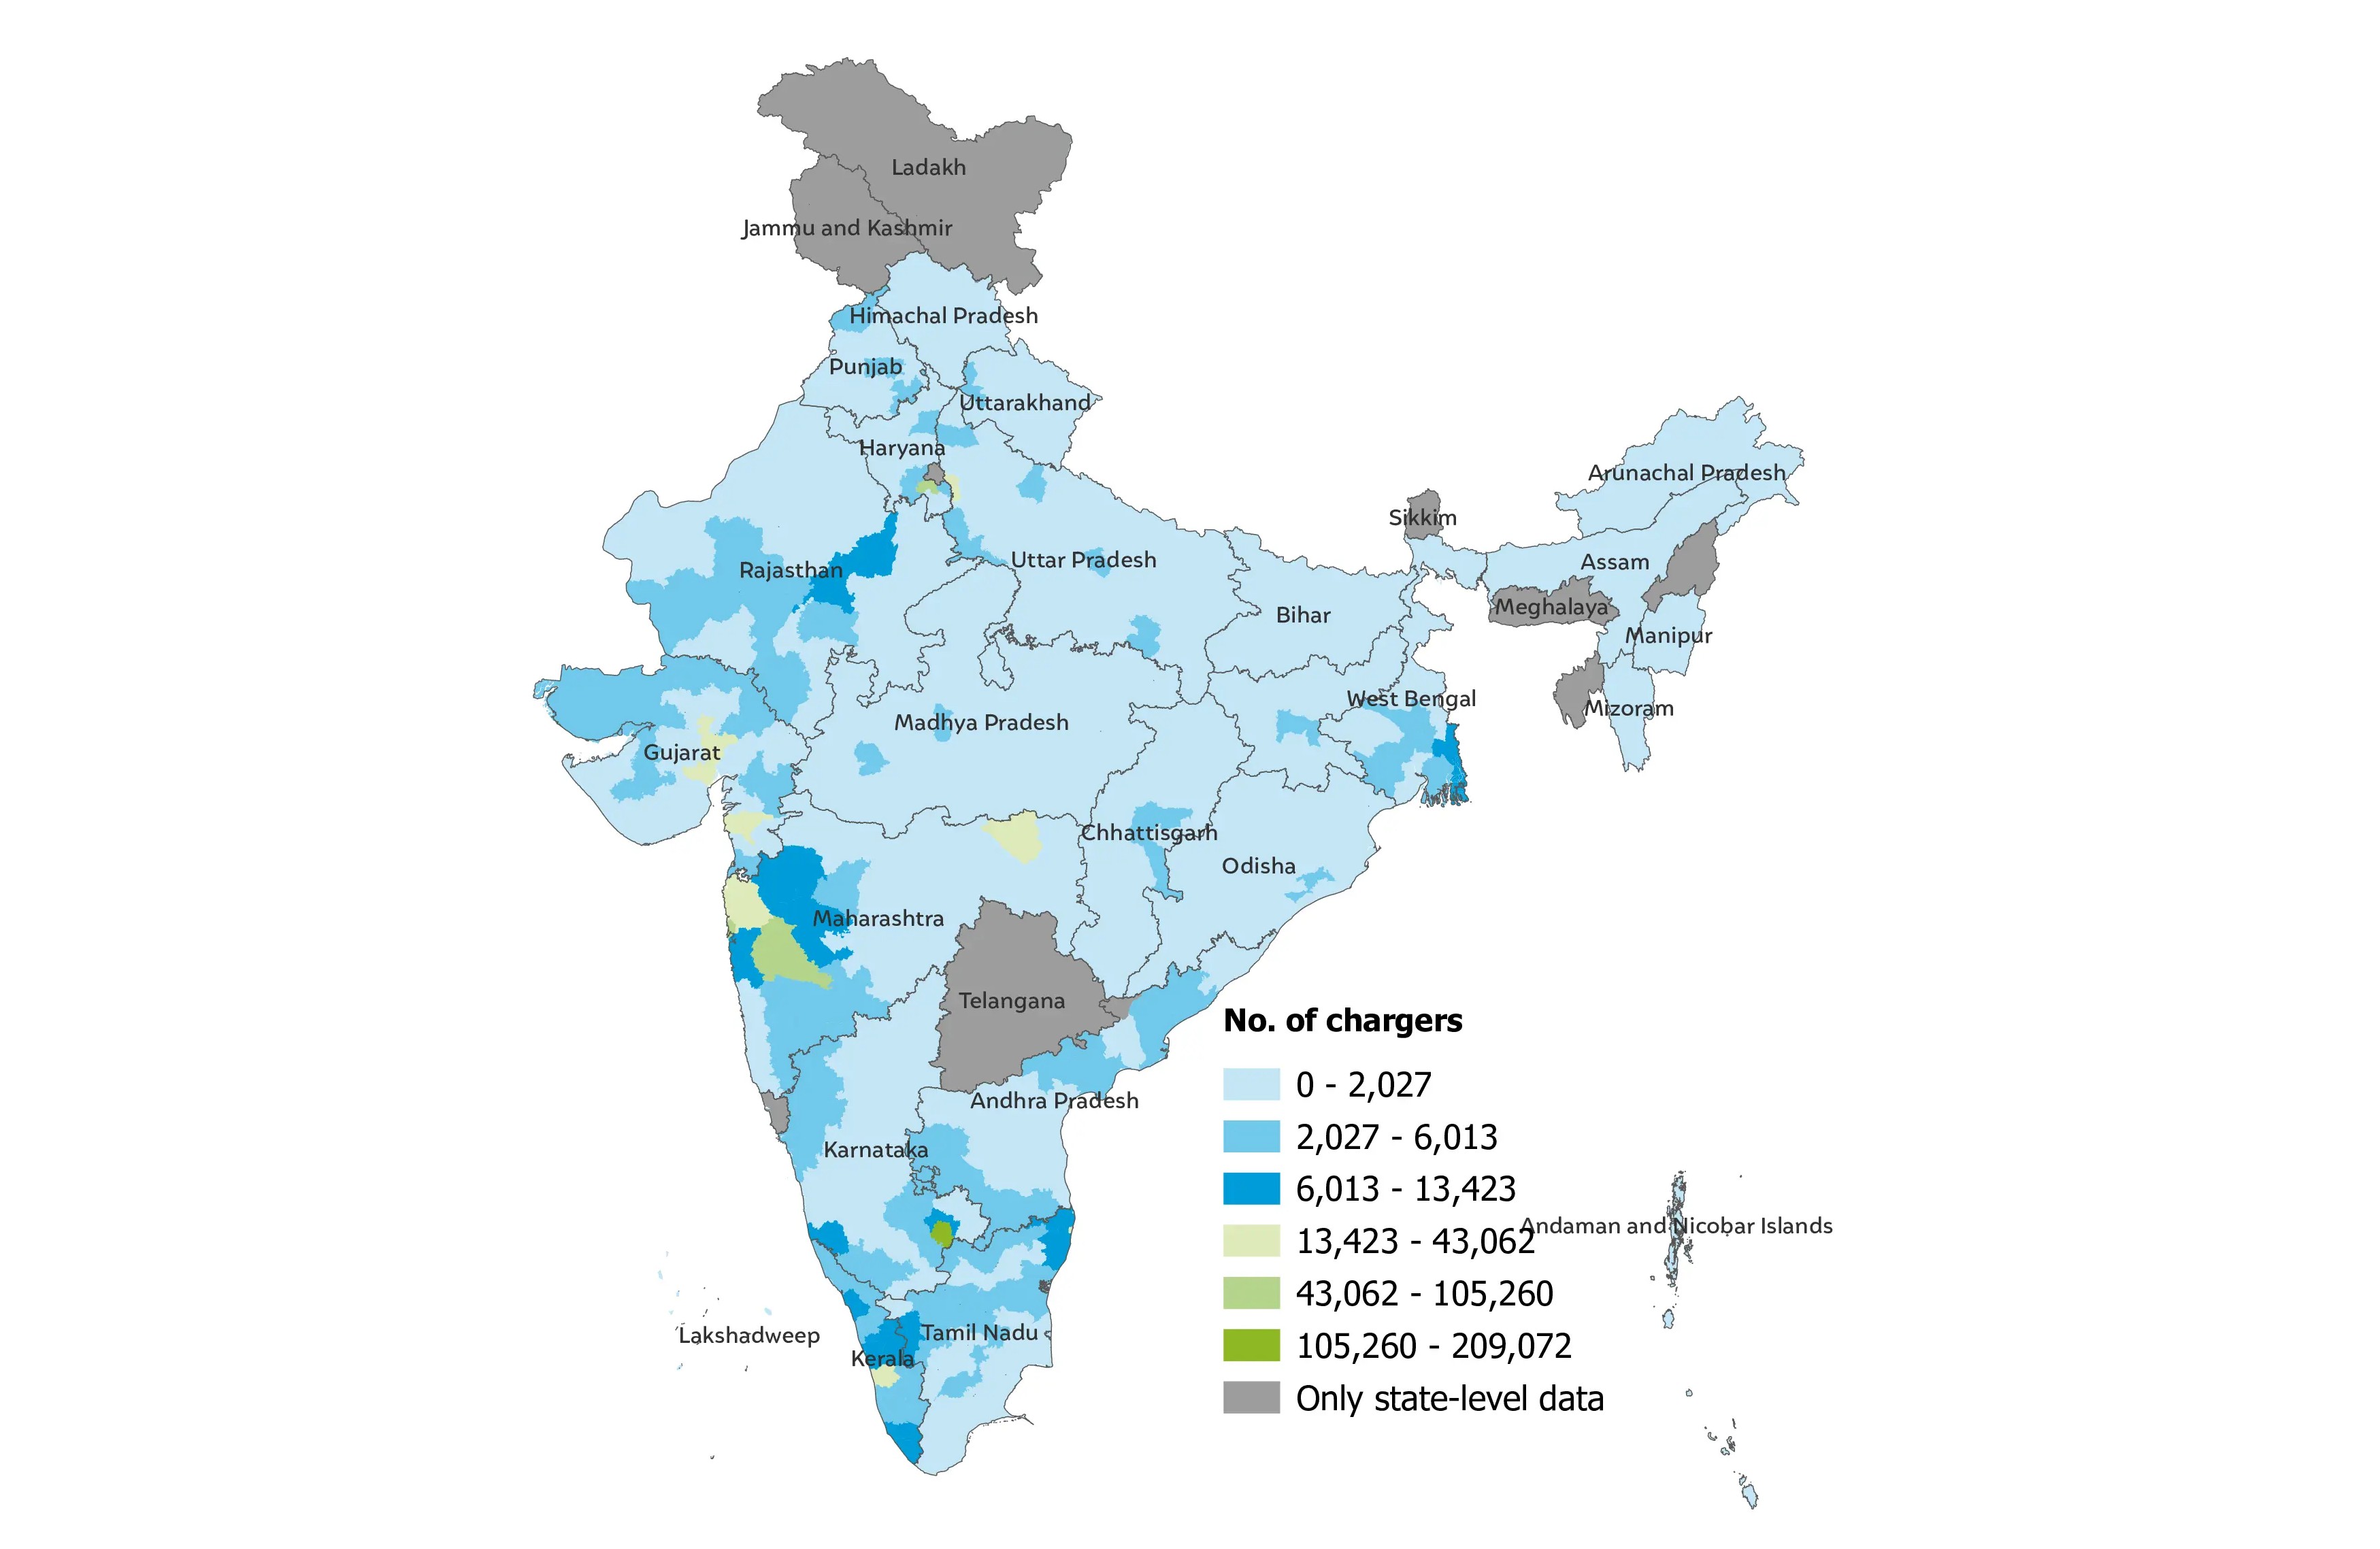
Source: Authors’ representation
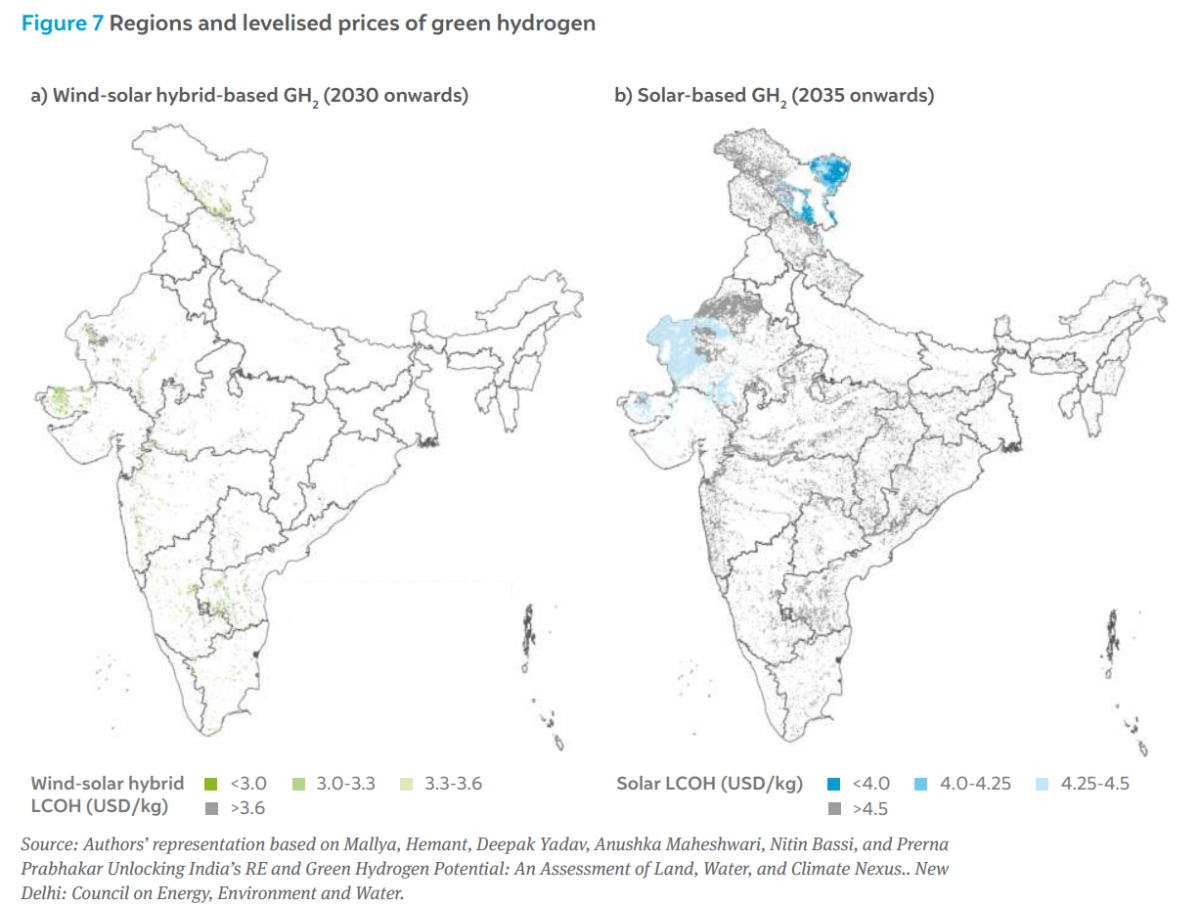
We constrained the availability of green hydrogen to those districts that have good potential for solar power and wind-solar hybrid power generation (Mallya, et al. 2024). We assumed the wind-solar hybrid hydrogen production for supply to road transport will commence by the year 2030, while solar-based hydrogen will commence later by 2035 (as it is more expensive due to the need for larger battery storage capacity). The districts with hydrogen availability are shown in Figure 7.
In this section, we have presented the results and insights from the TFFM at a district, state, and national level. Our model’s VSM projected the stock at a vehicle segment level (Mohan, et al. 2025). The TCO calculator then compared the TCO of different fuels available in each segment for each projection year (Elango, Mohan, et al. 2025). The FCM combined the data from these two components to calculate and project the estimated fuel demand from each vehicle type in every district. We also generated numerous insights that are presented in Section 4.
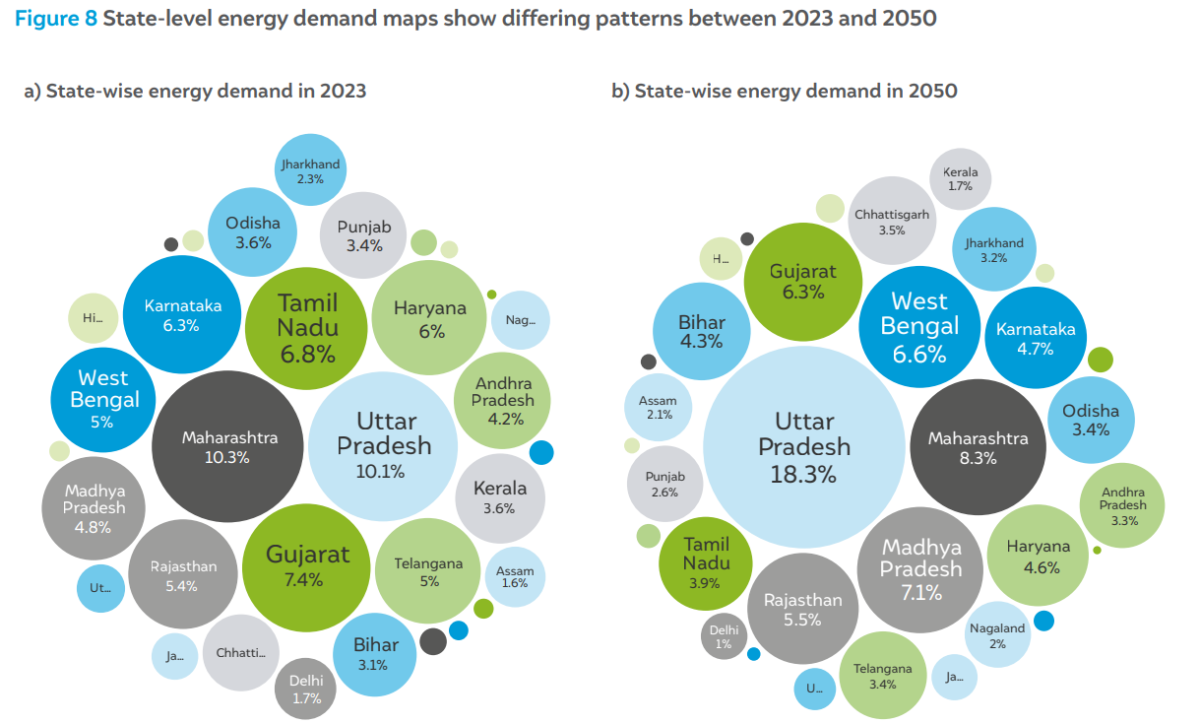
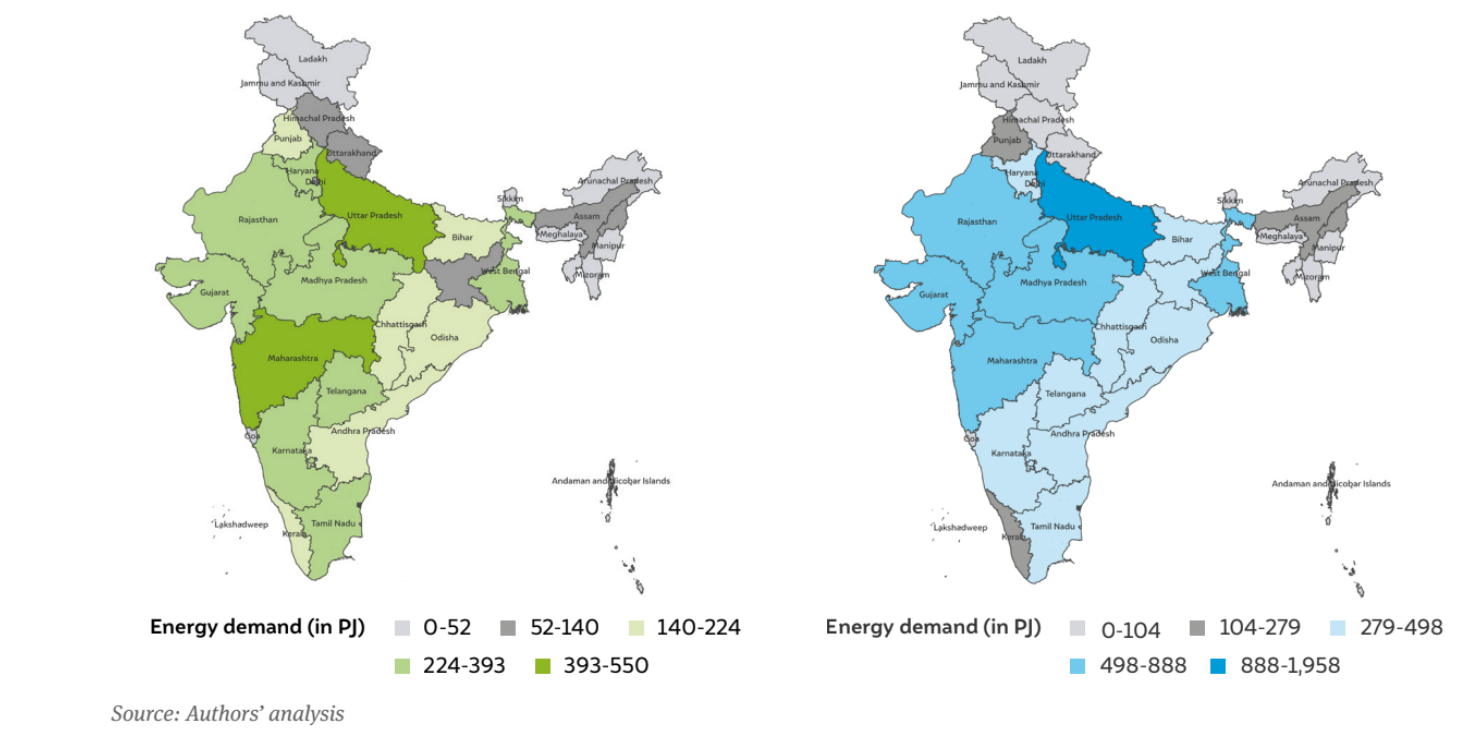
Our analysis suggests that energy demand patterns will shift substantially between 2023 and 2050 towards the northern states, as shown in Figure 8. While overall energy demand doubles from 5,317 petajoules (PJ) to 10,708 PJ from 2023 to 2050, much of the growth occurs in states like Uttar Pradesh, whose share of the total grows from 10.1 per cent in 2023 to 18.3 per cent by 2050. Meanwhile, the shares of states like Maharashtra, Tamil Nadu, Telangana and Andhra Pradesh decline. States like Uttar Pradesh and Bihar have tremendous scope for demand growth, owing to their large populations and relatively low GDP per capita at present.
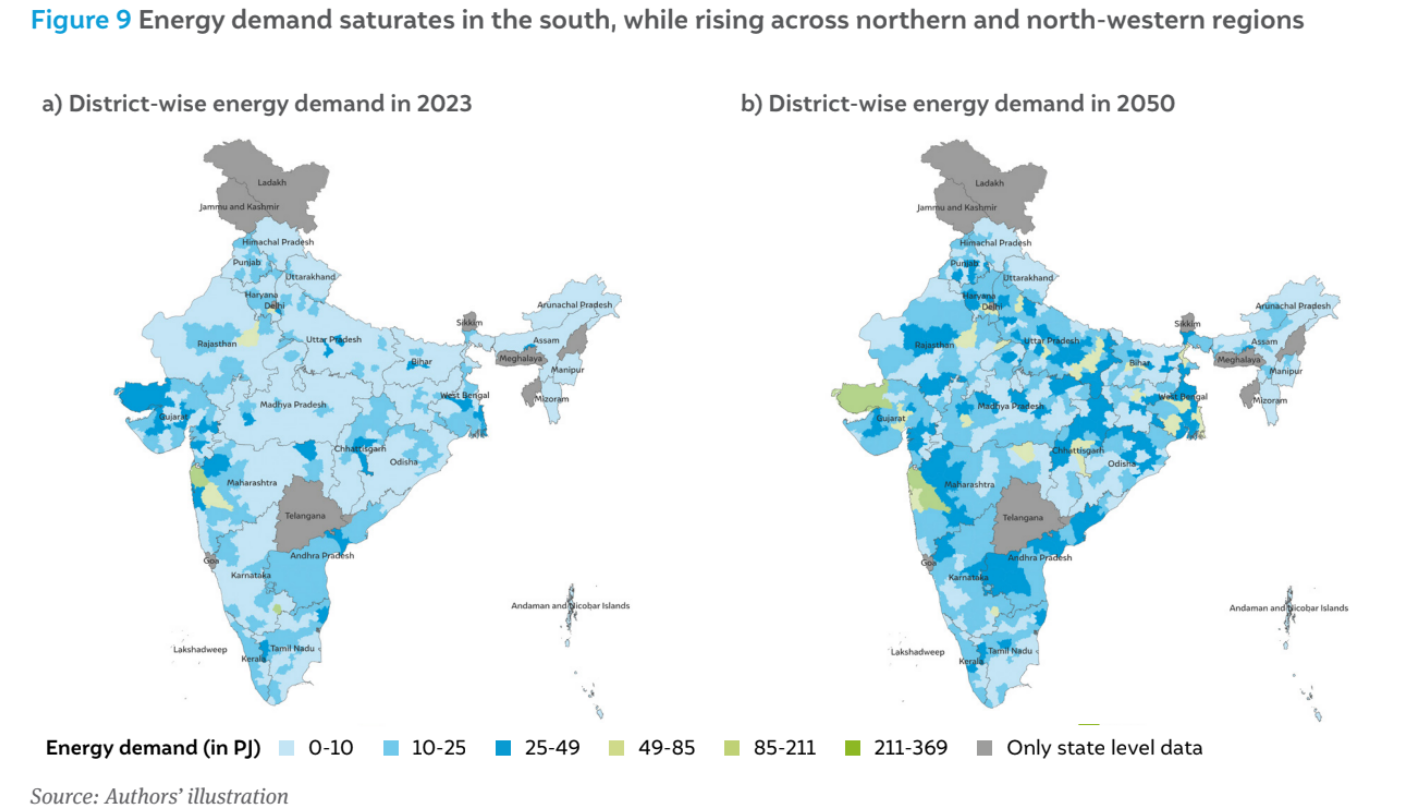
The district-level growth patterns are shown in Figure 9. The data shows marked increases in total energy demand in districts like Kachchh, Thane, Pune, Gurgaon, Hazaribagh and Allahabad. Contrasting with the stock growth patterns given by Mohan, et al. (2025), we note that the growth in fuel demand does not exactly follow the same patterns; differences arise due to the share of less energy intense vehicles like 2W and 3W, and the increasing adoption of EVs in these vehicle categories, which are more efficient.
The disparity between growth in stock and fuel demand is shown in Figure 10 for the top 15 states by stock. The pyramid charts show the stock and fuel demand in 2023 to the left of the y-axis and those in 2050 to the right. The figure shows that while there is a much larger number of EVs and petrol vehicles in 2050 compared to 2023, the energy demand is primarily driven by diesel vehicles. This is because while diesel vehicles are fewer in number, they are mostly in the heavy duty segments (bus, MGV, and HGV) where both fuel consumption and annual mileage are much higher than in other segments. Therefore, while several schemes and policies are supporting the transition in the light-duty segments, more policy direction and support is needed to transition the smaller number of heavy vehicles that have a much larger share of the total energy demand and emissions.
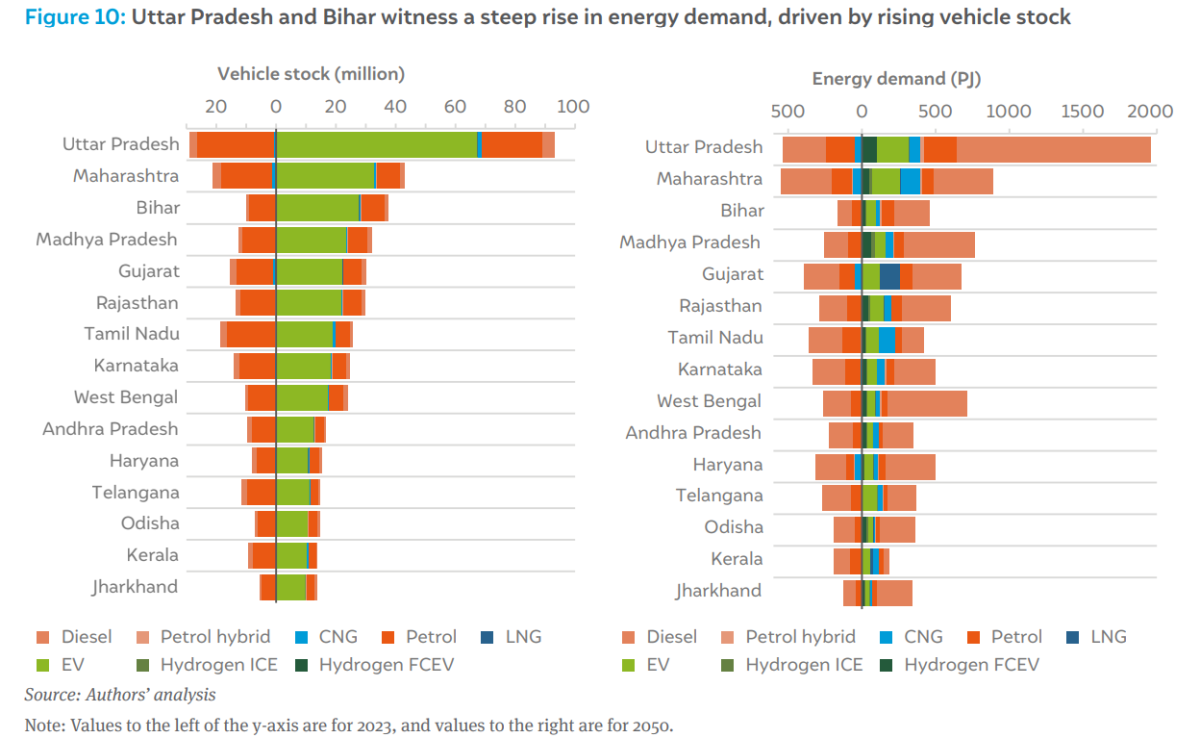
Figure 11 provides a snapshot of the profiles of six states across the economic and geographic spectrum of India. For each state, the figure shows the evolution of fuel-wise energy demand over the decades, and also compares the fuel mix of the top-10 districts between 2023 and 2050. (Please see page 28 of the attached pdf for data on the six states.)
We calculated the CO₂ emissions based on the fuel demand in each region and vehicle segment by using fuel-specific emission factors (India GHG Program 2015); (Howarth 2023). Figure 12 shows the CO₂ contribution of each state in 2023 and 2050 according to our data and projections. Uttar Pradesh will be the largest emitter by far, with 124 MtCO₂ in 2050, more than double that of the next highest state. There are several pattern shifts observed between 2023 and 2050—states like West Bengal, Madhya Pradesh and Rajasthan will move up the ranking, while states like Tamil Nadu and Telangana will have much smaller shares in 2050 than in 2023.
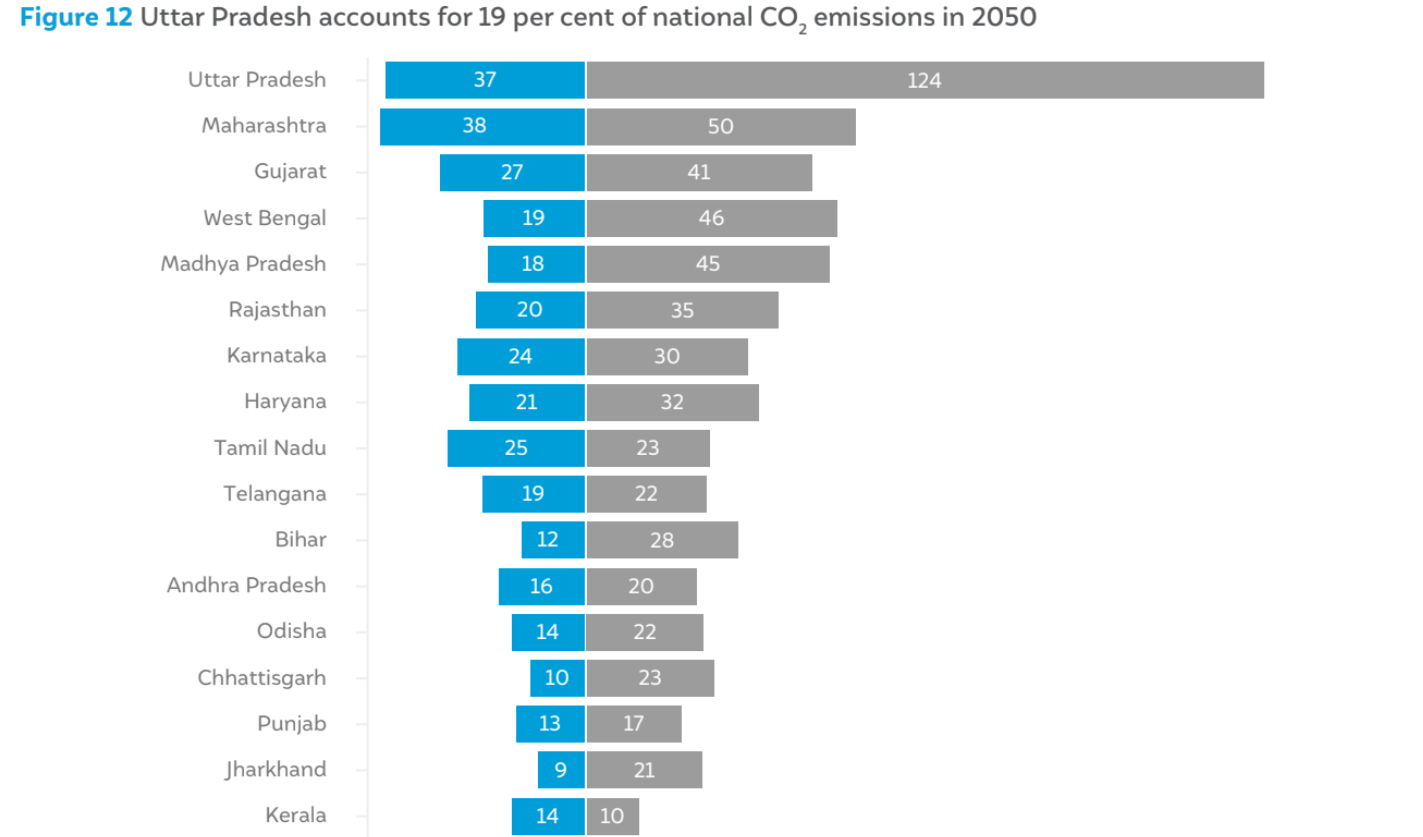
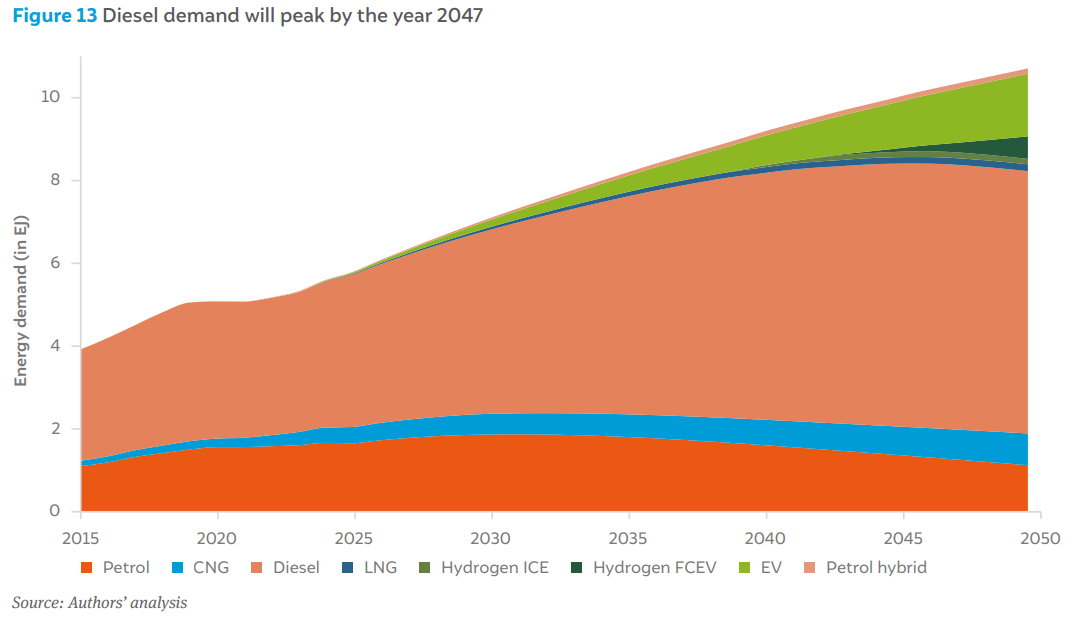
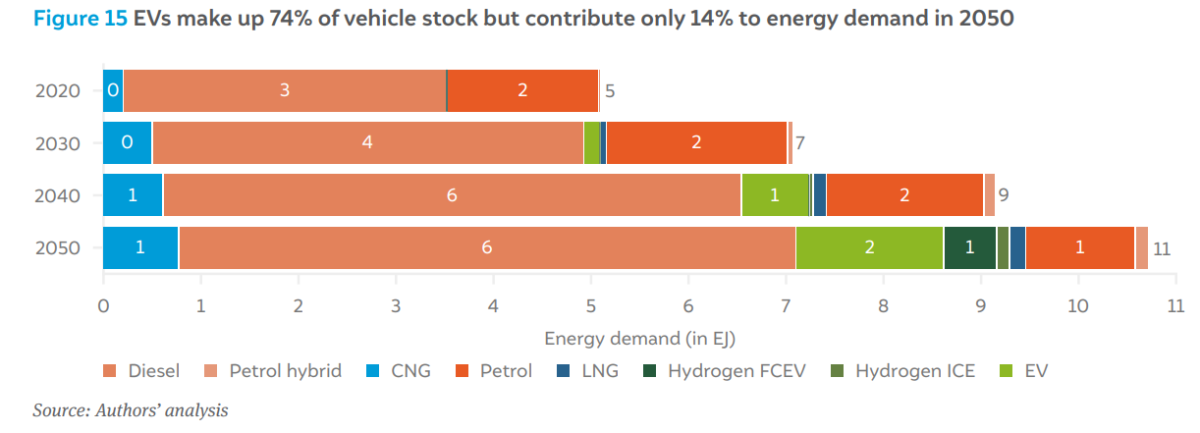
Figure 13 shows the projected total energy demand from road transport by fuel type in the base case. The total energy demand doubles from 5.3 EJ in 2023 to 10.7 EJ by 2050. The demand for petrol peaks at 1.9 EJ in 2032 and then declines steadily. The demand for CNG and LNG rises marginally. Although the share of EVs in stock rises from 1 per cent in 2023 to 74 per cent in 2050, the energy demand from electricity rises steadily to about 1.5 EJ by 2050, indicating the highly efficient nature of the EV powertrain. We project substantial growth in hydrogen demand only beyond 2040, when the TCO becomes more competitive. Diesel demand continues to hold the bulk of the total, rising from about 3.3 EJ in 2023, peaking at 6.4 EJ by 2047 and then declining.
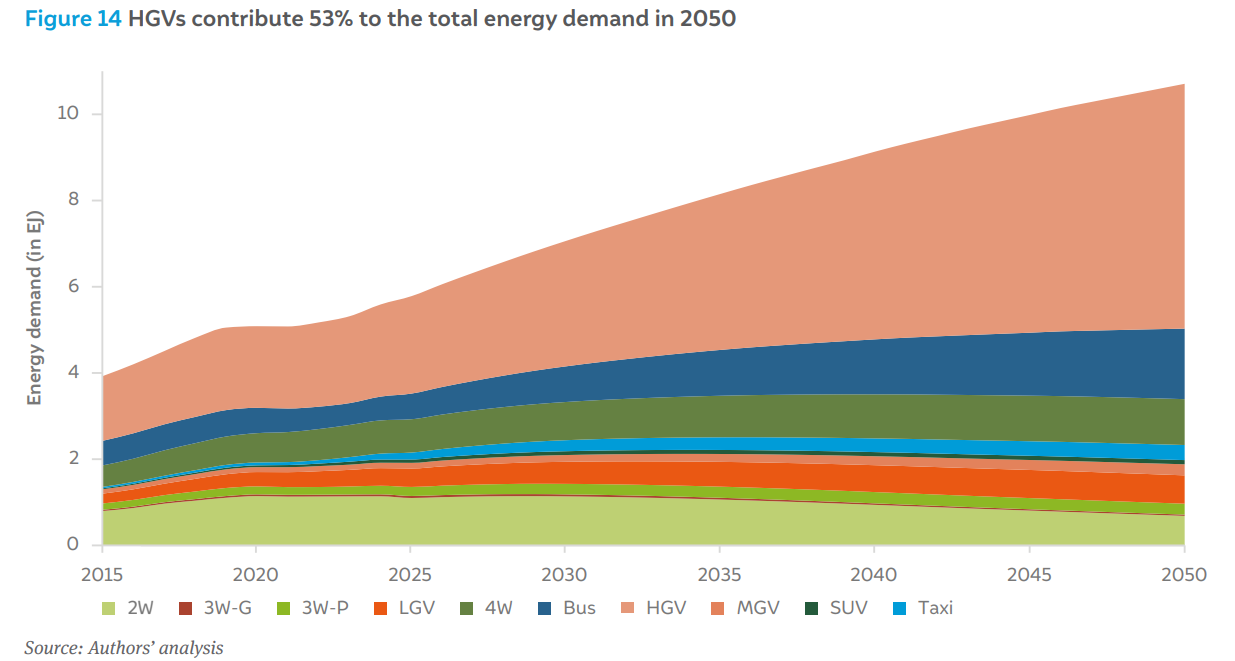
Looking at energy demand by vehicle category (Figure 14), we can observe that the demand for HGVs will have the highest growth (53 per cent by 2050); this is also the category that predominantly uses diesel. Energy demand from 2W, 3W-P, 3W-G and LGV will see a decline due to the switch to more efficient EV powertrains. Energy demand from buses also continues to grow; the effect of e-bus procurement by city corporations is unknown as the registrations data do not differentiate between different types of buses. However, a majority of bus sales are contributed by inter-city buses, school buses, and staff buses—these consumers may not switch to EVs due to charging constraints and an uncompetitive TCO.
The share of different fuels in the total energy consumption (Figure 15) shows that the growth in EV share mainly affects the share of petrol; adoption of hydrogen in heavy duty vehicles starts affecting the share of diesel beyond 2040.
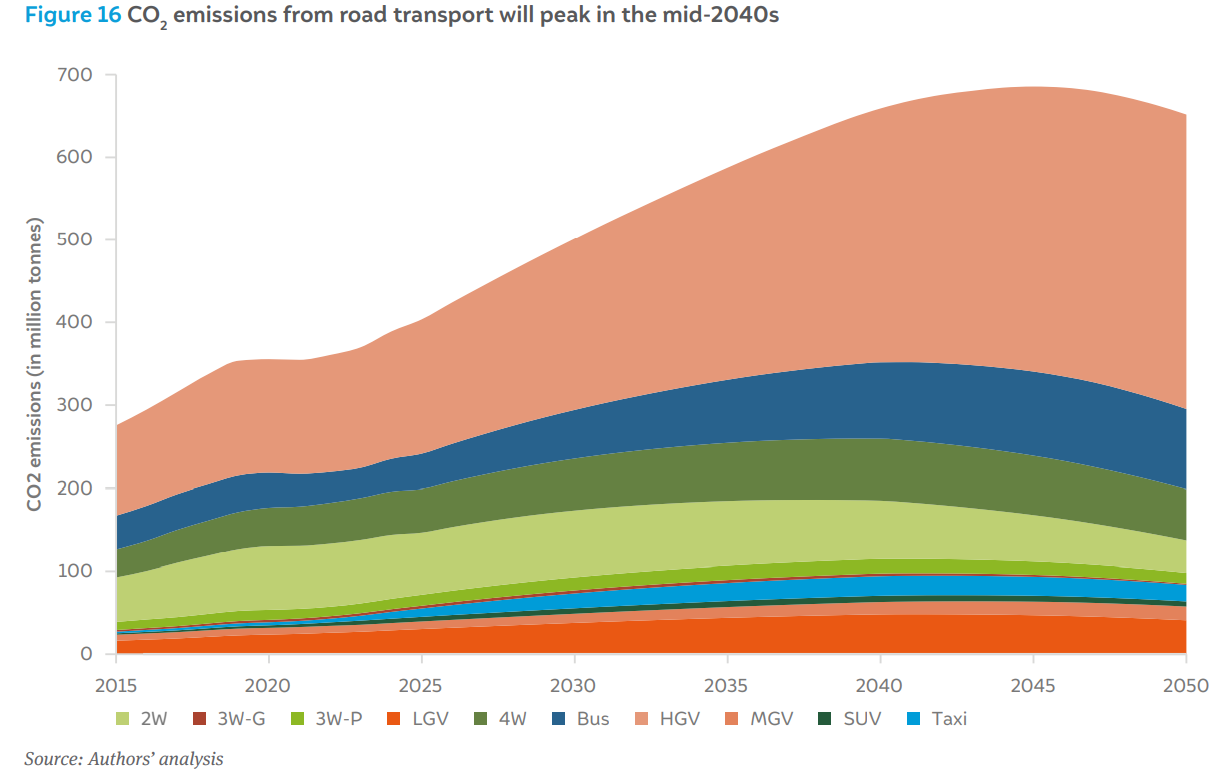
Our analysis and calculations indicate that the road transport sector emitted nearly 369 million tonnes of CO₂ in 2023. For context, this is 13 per cent of the total national CO₂ emissions of around 2,800 Mt in 2023 (IEA 2024). The road transport emissions peak at over 685 Mt by 2045, before starting to decline gradually (Figure 16). Predictably, the HGV segment also has the largest share of CO₂ emissions throughout the projection period, accounting over half the road transport emissions in 2050. Buses and HGVs, for which the TCO of EVs is not as competitive (Elango, Mohan, et al. 2025), start switching away from diesel only in the 2040s. The 2W and 3W segments show the most reduction due to the high adoption of EVs.
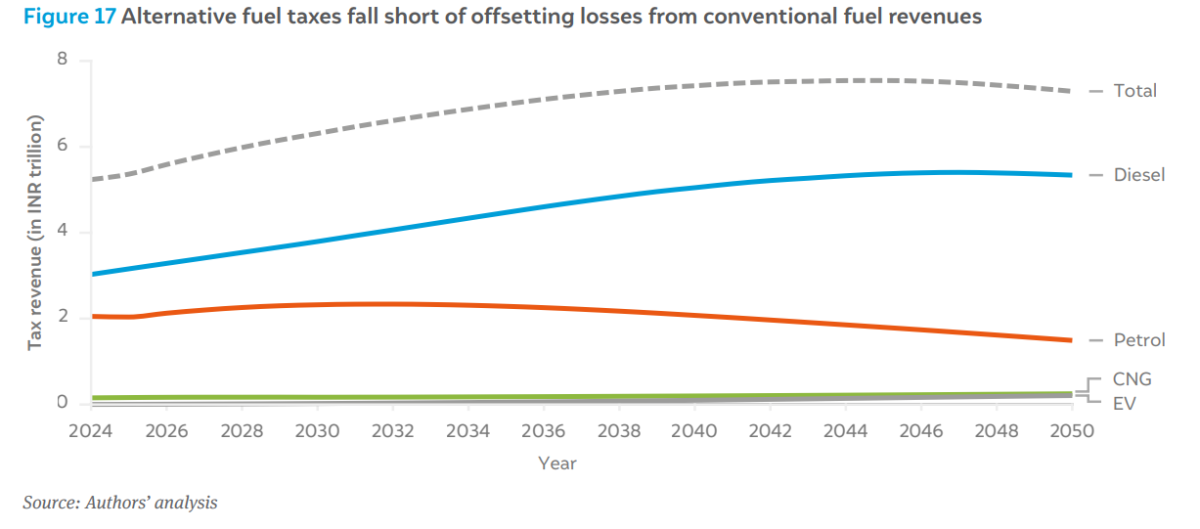
Petrol and diesel are heavily taxed commodities in India. The major tax components are the excise duty (collected by the central government) and the value-added tax (collected by state governments), which can account for nearly half of the retail selling price (Ministry of Petroleum and Natural Gas 2024). Therefore, transitioning away from petrol and diesel to other fuels that have much lower tax rates will impact the revenue generation for central and state governments, as shown in Figure 17.
Due to rising diesel demand, tax revenues increase till 2045, beyond which they start declining. Note that despite petrol and electricity holding similar shares in energy demand by 2050 (Figure 13), the contribution of tax revenue (by means of electricity duty) from electricity sale is much lower. To bridge the revenue gap, alternative models must be explored, such as distance-based taxation (Harikumar, Jain and Soman 2022).
The increasing demand trends for petrol and diesel start diverging beyond the year 2030, as shown in Figure 18. Diesel demand continues to rise to a peak of 175 billion litres in 2046– 47, while petrol demand peaks at 57.1 billion litres by 2032. This diverging demand may pose challenges for refineries, as the product mix cannot be tweaked beyond certain limits. Each refinery is designed to process a certain grade of crude oil (density and sulphur content), which in turn can produce petrol and diesel within certain range by volume. Divergence in the proportion of petrol to diesel demand (with petrol demand in decline) will result in excess petrol, or naphtha that is a petrol precursor. Hence, refineries will have to be realigned to a new product mix.
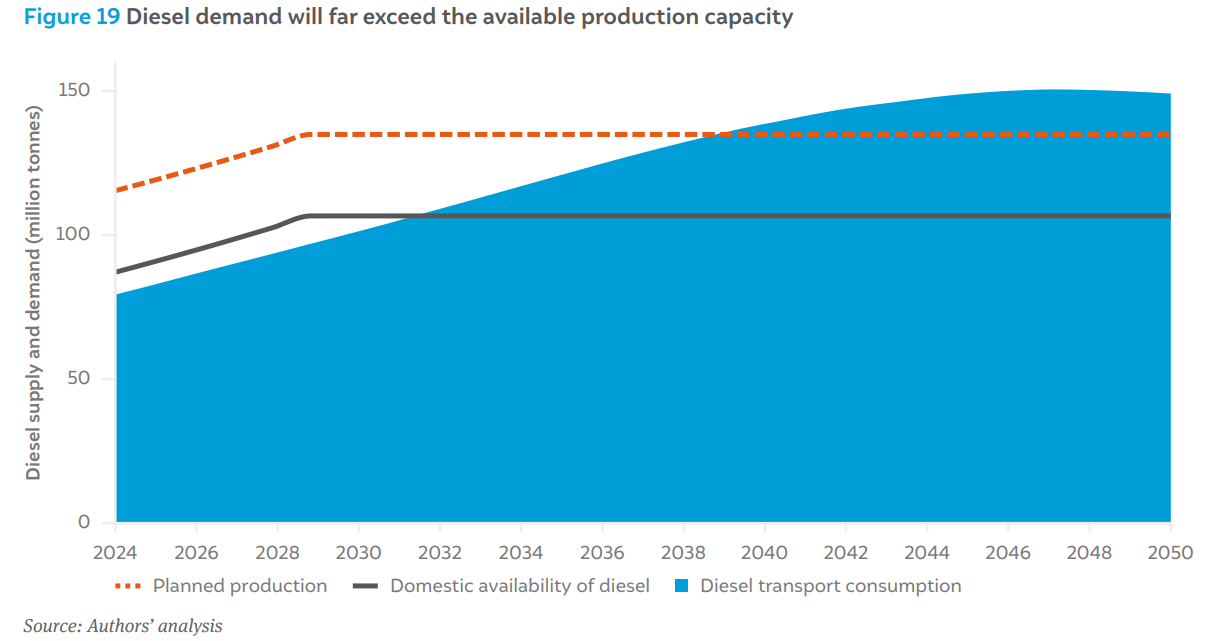
The projected growth in diesel demand will require the existing domestic production capacity to increase substantially, as shown in Figure 19. However, once demand starts declining beyond 2047, the additional refinery capacity may become stranded, i.e., the economic life of these new refineries may not be reached. Without flattening diesel demand sooner or increasing reliance on diesel imports, the long-term outlook of refining in India remains unclear.
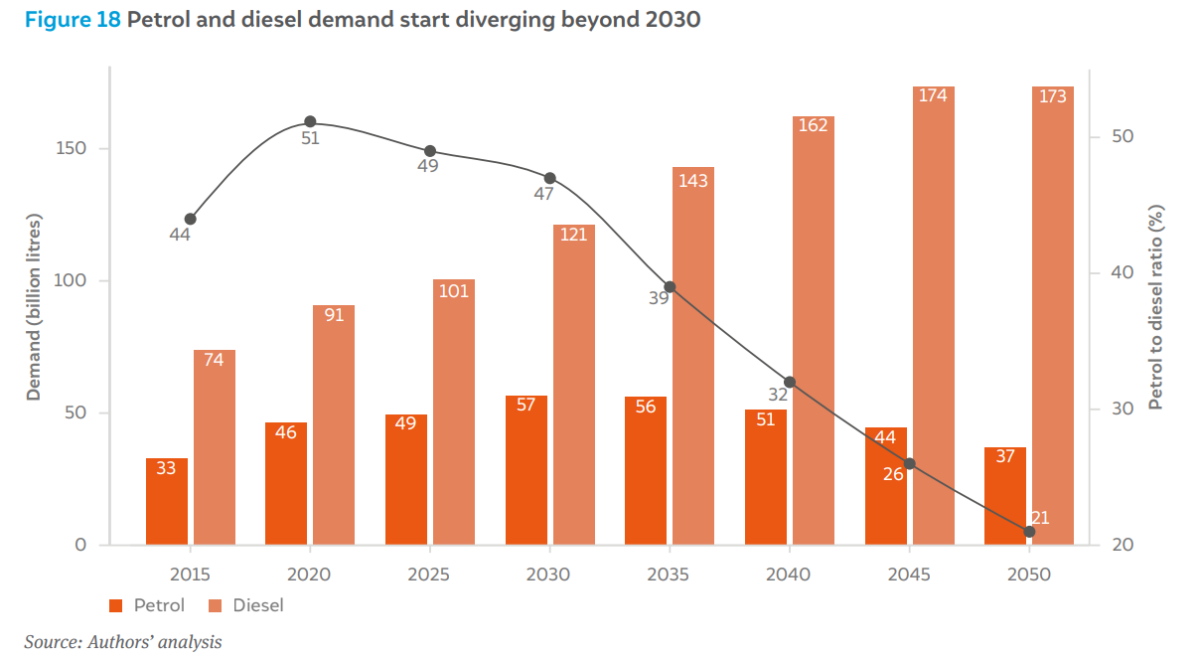
Figure 19 illustrates the projected trajectory of diesel demand in relation to domestic supply over the coming decades. In line with India’s target of achieving 300 Mtpa of refining capacity by 2028, we have modelled a linear increase in refining from current levels to 2028 (S&P Global 2025). Using this expanded capacity, we estimated the potential diesel production. Assuming no further additions to refining capacity beyond 300 Mtpa and maintaining current diesel export levels of approximately 28 Mtpa, our analysis reveals that domestic diesel demand is likely to exceed available supply by 2031. However, if export volumes are reduced and domestic demand is prioritised, this demand-supply crossover is deferred until 2037. Notably, diesel demand is projected to peak within a decade after this point. Such a shift poses a significant risk to refinery operations, as demand for diesel and petrol will decline, potentially impacting the economic viability of these refinery units.
The Government of India has an ethanol-blending programme that mandates its mixing into petrol to reduce emissions and import dependency. As of 2023, petrol was blended with 10 per cent ethanol by volume (Ministry of Petroleum and Natural Gas 2024). However, this is set to rise to 20 per cent by 2025–26 (Press Information Bureau 2024). Figure 20 shows the ethanol requirement as per our petrol demand projection, assuming a steady 20 per cent blending mandate beyond 2025–26. The steep rise in ethanol demand followed by the steady decline post 2030 poses challenges to the economic viability of ethanol production plants, unless alternate applications are found. One option could be the introduction of flex fuel vehicles by the end of the decade that use near 100 per cent ethanol as fuel.
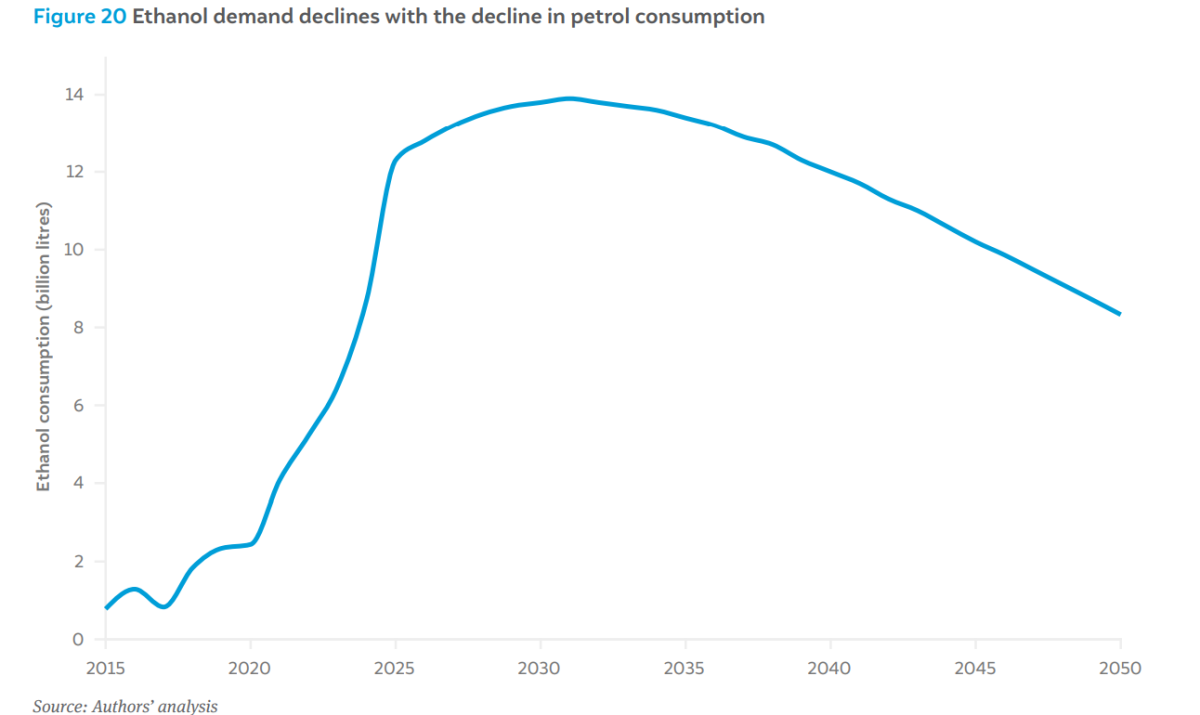
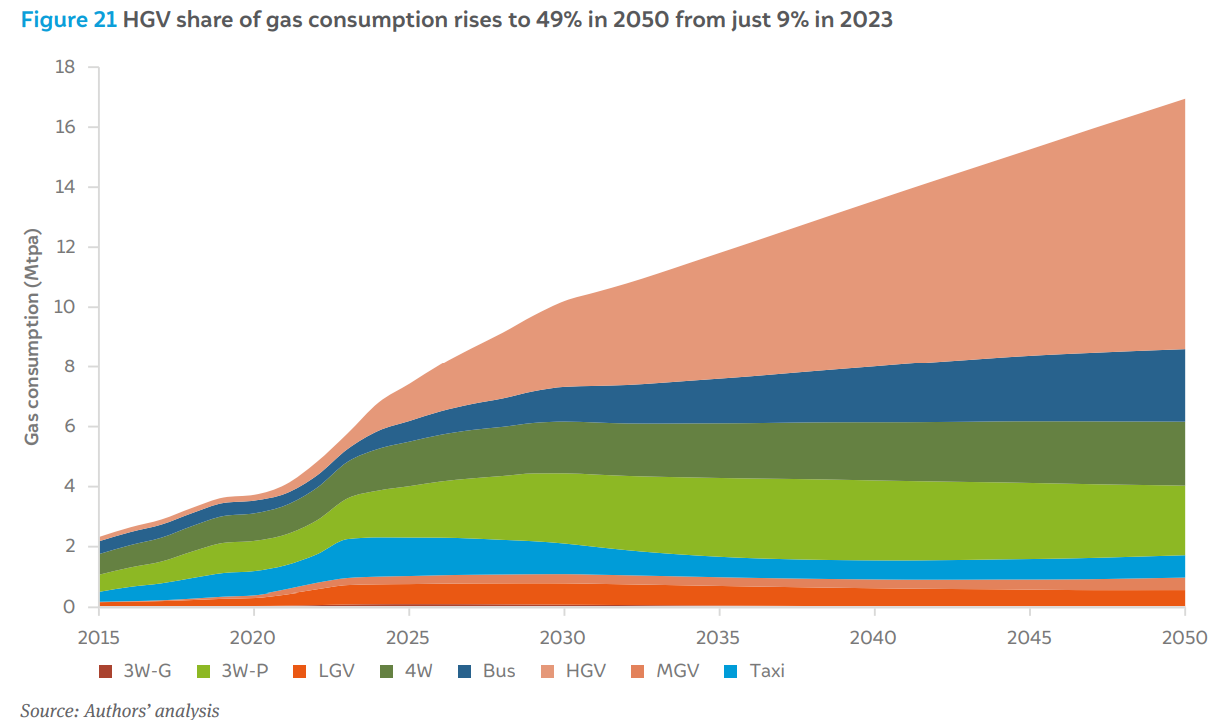
Figure 21 shows the projected growth in natural gas demand in the country till 2050. The transport sector consumed nearly 5.7 Mt of gas in 2023 out of a national total of 45 Mt (Ministry of Petroleum and Natural Gas 2024). The consumption in road transport could triple by 2050 according to our analysis, to nearly 17 Mt. In India, CNG remains more affordable than petrol and diesel, primarily due to the government’s gas allocation policy, which prioritises the supply of lower-cost domestic gas to price-sensitive sectors like transport. However, domestic gas production has not kept pace with rising gas demand (PPAC 2024), especially as output from older fields under the Administered Price Mechanism (APM) continues to decline. In the past year, APM gas supplies to city gas distributors have been cut by almost 50 per cent (Energyworld 2025). As a result, city gas distributors are increasingly compelled to procure gas through the marketing and pricing freedom mechanism or by blending with imported Regasified Liquefied Natural Gas (RLNG), both of which significantly raise the cost of supply (Ministry of Petroleum and Natural Gas 2025). To preserve the price advantage of CNG over conventional fuels, the government may be required to counterbalance the higher input costs by increasing taxes on petrol and diesel. This is especially concerning for the HGV segment, whose fallback option is diesel.
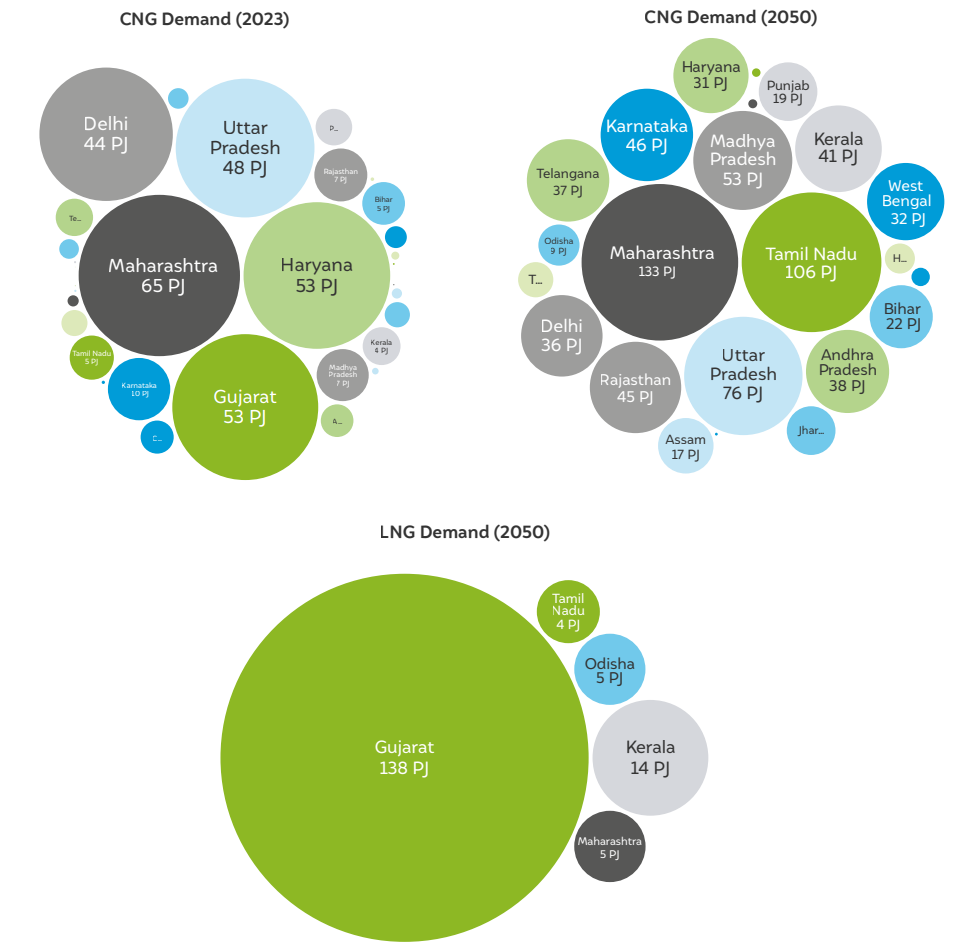
Maharashtra is projected to remain the largest consumer of CNG, with demand reaching 133 PJ by 2050—over double its 2023 level of 64 PJ. In addition, states like Assam, Andhra Pradesh, Himachal Pradesh, Jharkhand, Kerala, Tamil Nadu, and West Bengal emerge as key contributors, together accounting for 33 per cent of the national CNG demand by 2050. This rise is largely driven by expanding CNG infrastructure and cost competitiveness of CNG vehicles in these regions.
Conversely, Gujarat, Haryana, and Delhi witness a decline in CNG energy demand, primarily due to saturation in refuelling infrastructure—with limited addition of new stations, these states have maxed out their CNG utilisation potential. In case of LNG, the demand is geographically concentrated. Only a handful of states such as Gujarat, Kerala, Maharashtra, Odisha and Tamil Nadu drive most of the expansion. This is because the business-as-usual scenario assumes that only states with existing or planned LNG terminals can potentially switch to this fuel. Among them, Gujarat alone contributes 83 per cent to India’s LNG demand by 2050.
Figure 22 Maharashtra contributes 17% to the national CNG demand in 2050
Source: Authors’ analysis
Based on our projected EV sales, Figure 23 shows the projected electricity demand in road transport till 2050. In 2023–24, India generated 1,734 TWh of electricity (NITI Aayog 2024), with road transport accounting for less than 1 per cent of total demand. However, our projections show that despite the high share of diesel in 2050 (Figure 13), the demand for electricity could rise to 420 TWh by 2050 (which is a quarter of India’s total consumption in 2024). This steady rise will have important implications for the power grid; the need for more renewable power for EV charging will require more distributed RE generation, or will require strengthening of grid capacity and balancing. In addition, a substantial portion of EV charging may happen overnight (especially for 2W, 3W and 4W), so round-the-clock renewable power must be made available using wind, solar, and battery storage to enable these vehicles to use clean electricity.
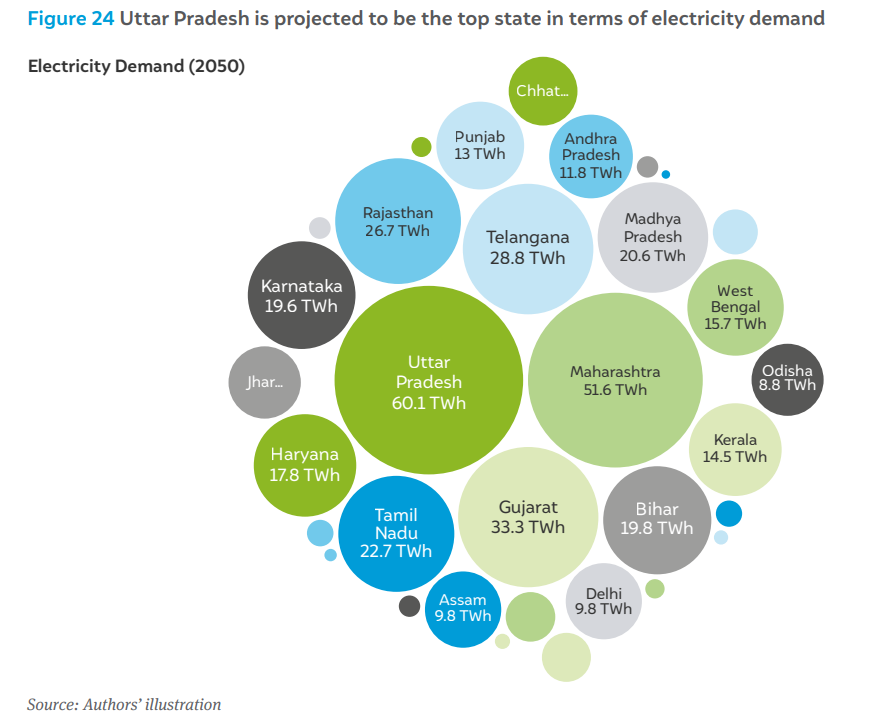
Among states, our analysis indicates that Uttar Pradesh and Maharashtra together contribute 27 per cent to India’s total electricity demand by 2050. Gujarat, Telangana, and Rajasthan complete the top five. Together, the top five states account for 48 per cent of total electricity demand by 2050. This helps state-level authorities to plan for the electricity demand from the transport sector and strategically procure power from renewable resources.
For electric vehicles to see wider adoption, domestic manufacturing of batteries is necessary, to bring down the costs. Based on the projected EV stock and battery size assumptions, we calculated the annual battery manufacturing capacity needed to meet the demand (Figure 25). Our analysis projects that India will require 110 GWh of annual battery manufacturing capacity by 2030, rising to 168 GWh by 2035. These estimates are broadly aligned with industry expectations, including S&P Global’s forecast of around 80 GWh by 2030 and 140 GWh by 2035 (Das 2024, Murali 2024). This demand will double to over 241 GWh/year by 2040, reaching 364 GWh/year by 2050.
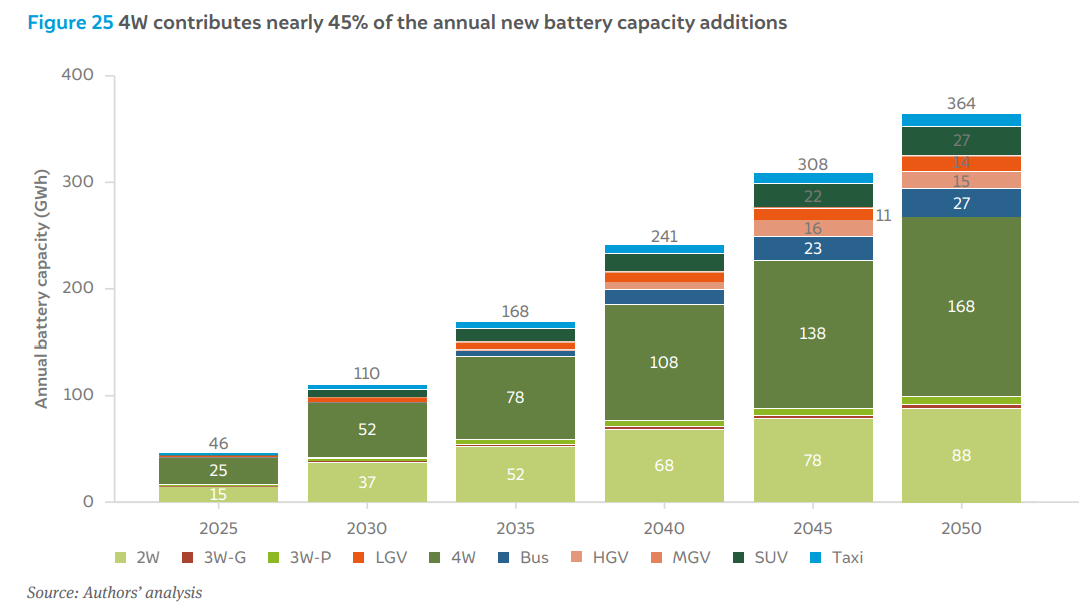
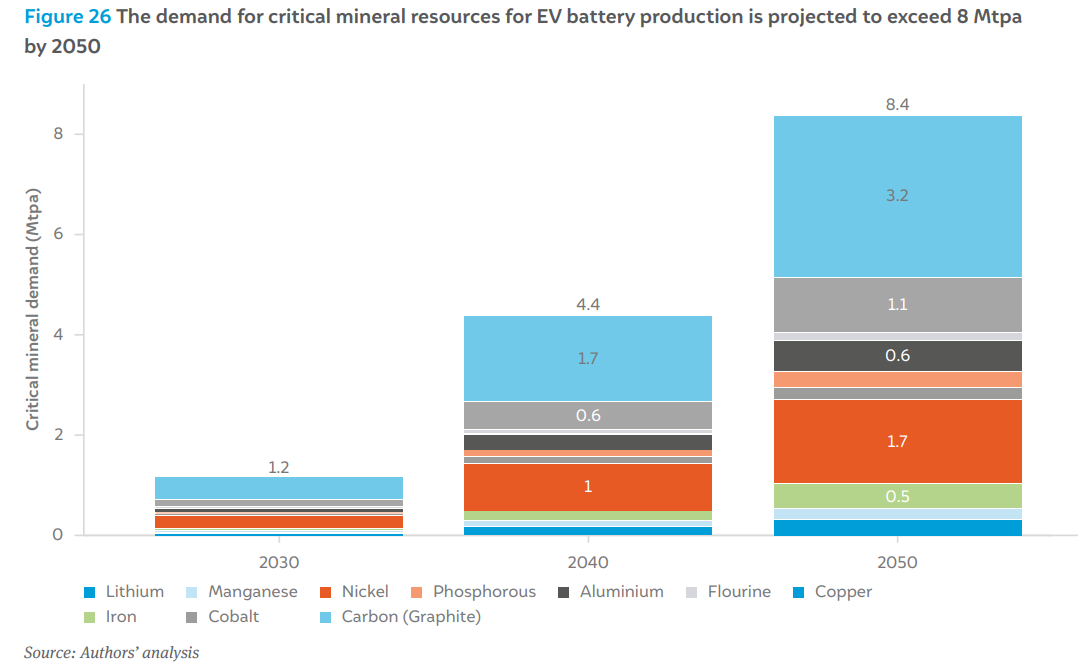
Figure 26 shows the critical mineral resources (CMR) needed to produce the required capacity of batteries (assuming lithium-ion technology) commensurate with the projected EV demand. Globally, most of the critical minerals are mined and processed by Chinese entities (Vaid 2024). India will need more than 8 Mtpa of CMR by 2050. It is imperative for India to secure vertical linkages in CMR mining and processing. The government must direct and support Indian OEMs and labs to investigate and develop advanced chemistry cell (ACC) batteries that rely more on domestically available minerals (such as sodium), and on solid-state batteries that offer longer range and life.
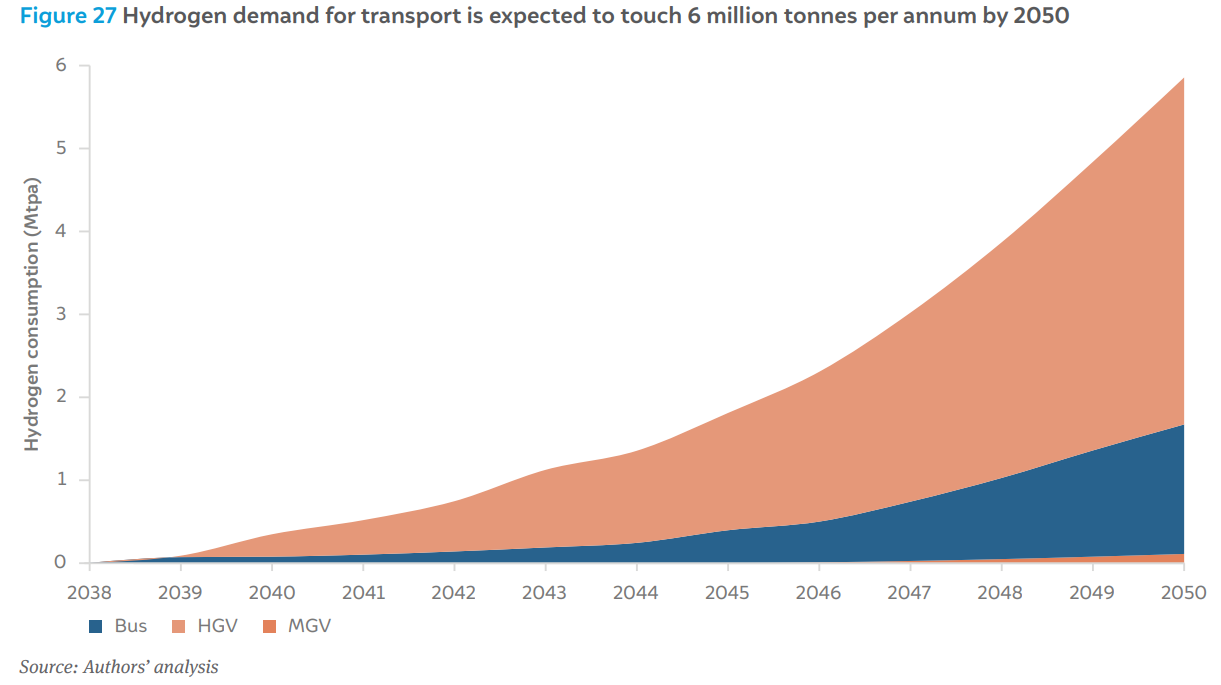
Hydrogen demand will also increase steadily, driven by the HGV segment. Figure 27 shows that hydrogen demand will reach 6 Mtpa by 2050 and continue growing, despite over 70 per cent of HGV stock still using diesel (see Annexure for fuel-wise stock for each segment). Thus, there will be even more scope for hydrogen demand growth beyond 2050. Like electricity, hydrogen demand will also be distributed across the country (concentrated in urban centres and port districts). Therefore, the dilemma arises as to whether hydrogen production will be decentralised, or whether pipeline transmission and distribution will be required.
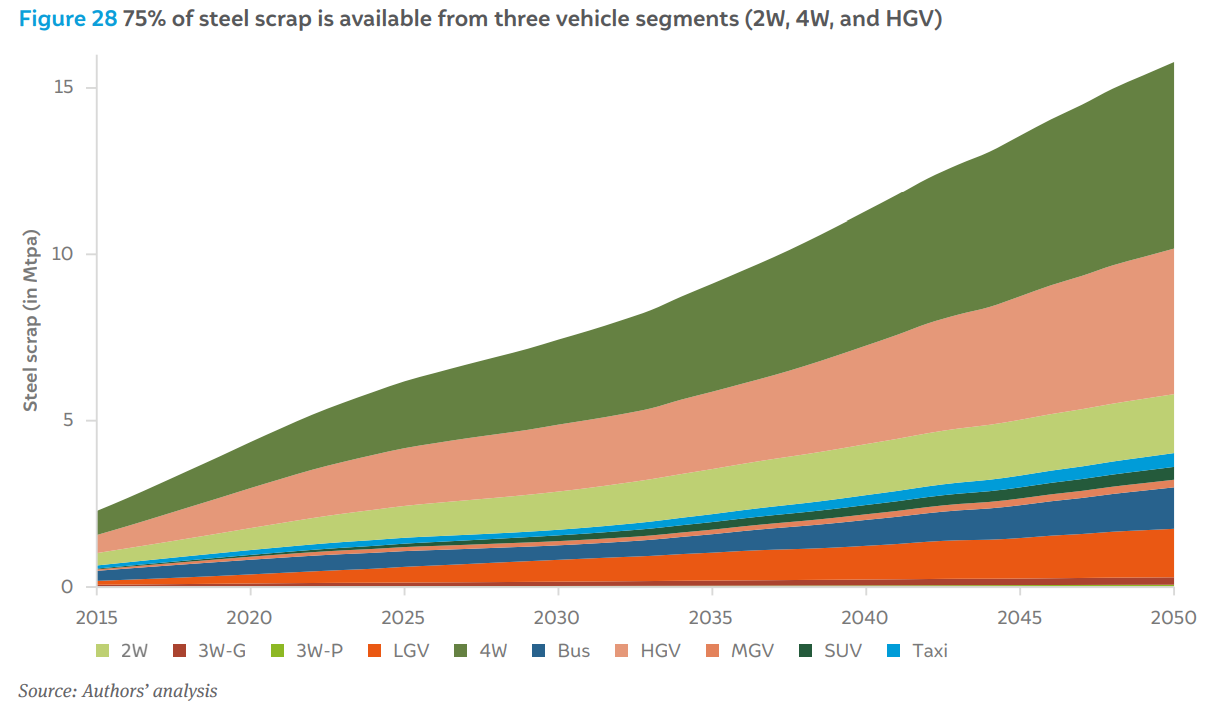
The Indian steel industry is highly reliant on coal, causing it to have a high emission intensity of 2.36 tonnes of CO₂ per tonne of crude steel (tCO₂/tcs), compared to the global average of 1.9 tCO₂/tcs (Elango, Nitturu, et al. 2023). Steel recycling is an important measure in reducing the emissions from steelmaking; using scrap results in a much lower emission intensity of below 1 tCO₂/tcs (Elango, Nitturu, et al. 2023). India aims to double the steel production capacity from 154 Mtpa in 2021–22 to more than 300 Mtpa in the 2030s (Elango, Nitturu, et al. 2023). While the automotive industry is an important source of steel scrap—our analysis indicates that scrap availability from the automotive industry could increase to 7 Mtpa by 2030 and 15 Mtpa by 2050 (Figure 28)—even with proper collection and processing of end-of-life vehicles to recover steel, it would only contribute to around 2 per cent of the steel production target in 2030.
This section provides a detailed analysis of the five distinct scenarios explored in this study, along with their respective impacts.
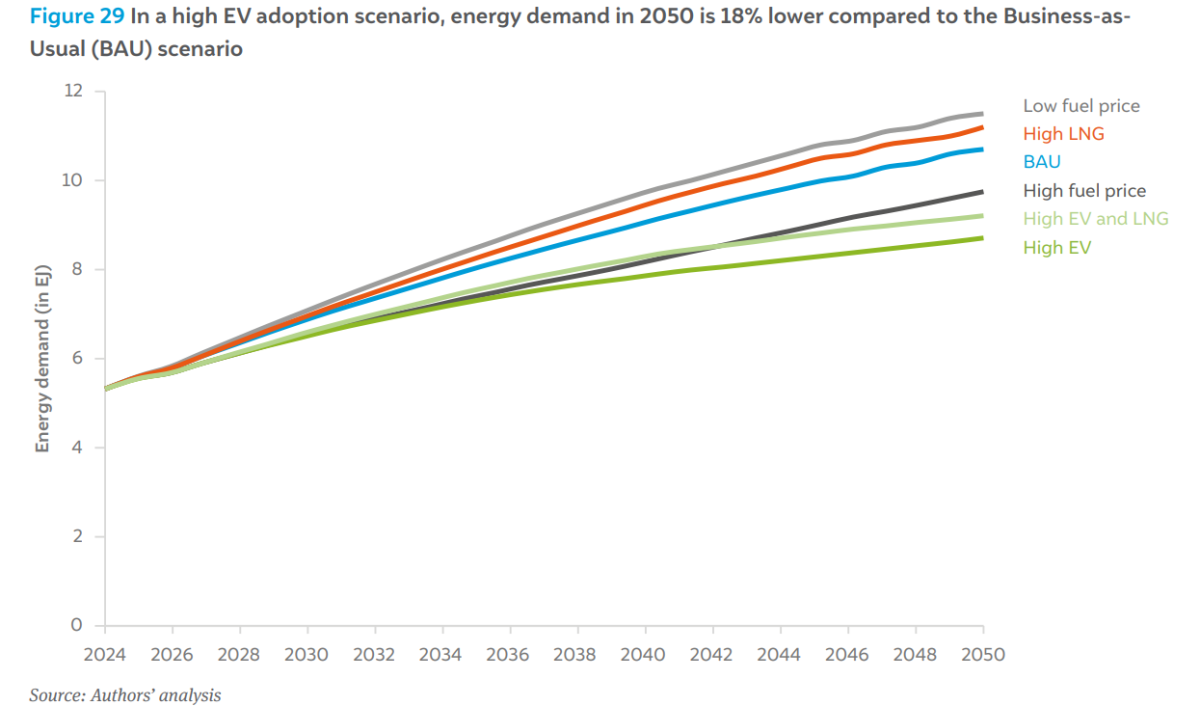
Figure 29 depicts the projected energy demand across the five scenarios over time. In the low fuel price scenario, India’s energy demand reaches the highest level—11.5 EJ by 2050—as lower crude oil prices keep the retail costs of petrol and diesel relatively affordable. This cost advantage maintains the competitiveness of ICE vehicles in terms of TCO, thereby slowing the shift toward alternative fuels. Conversely, under a high crude price scenario, energy demand in 2050 is projected to be 9 per cent lower than in the BAU scenario. Higher retail prices for conventional fuels make alternative fuels more cost-effective earlier, thereby accelerating the transition.
The high LNG scenario shows a slight lower energy demand of 11.1 EJ in 2050, indicating that while LNG adoption increases, it doesn’t drastically change the energy demand profile. The high EV and LNG scenario (9.2 EJ) and high EV scenario (8.7 EJ) exhibit the lowest energy demand, representing increases of 73 per cent and 63 per cent, respectively, over 2023 levels. Lower demand in these scenarios is primarily due to the higher adoption of energy efficient EVs, which consume significantly less energy per kilometre than internal combustion engine (ICE) vehicles.
In 2023, the energy demand from the transport sector is predominantly met by fossil fuels, with diesel holding a major share at 63 per cent, petrol at 31 per cent, and CNG at 6 per cent. This forms the baseline against which the future scenarios are assessed.
Figure 30 presents the share of various fuels meeting energy demand under the five scenarios for 2050, reflecting the impact of technology, cost, and infrastructure limitations. Energy demand from incumbent fuels remains high—diesel at 7.37 EJ, petrol at 1.77 EJ, and CNG at 0.78 EJ—as lower costs attract more customers to traditional ICE engines. Conversely, in the high EV and LNG scenario, the demand for incumbent fuels drops significantly—diesel to 3.6 EJ, petrol to 0.31 EJ, and CNG to 0.6 EJ—underscoring the uptake of EV and LNG.
Notably, electricity demand peaks in the high fuel price scenario, surpassing even the high EV and high EV and LNG scenarios. The latter two scenarios have lower electricity demand due to the powertrain efficiency improvements considered, which significantly reduce the energy required per kilometre travelled. Hydrogen demand is highest in the high fuel price scenario (1.24 EJ), followed closely by the high EV scenario (0.72 EJ) and the BAU scenario (0.67 EJ), while it is lowest in the low fuel price scenario (0.15 EJ).
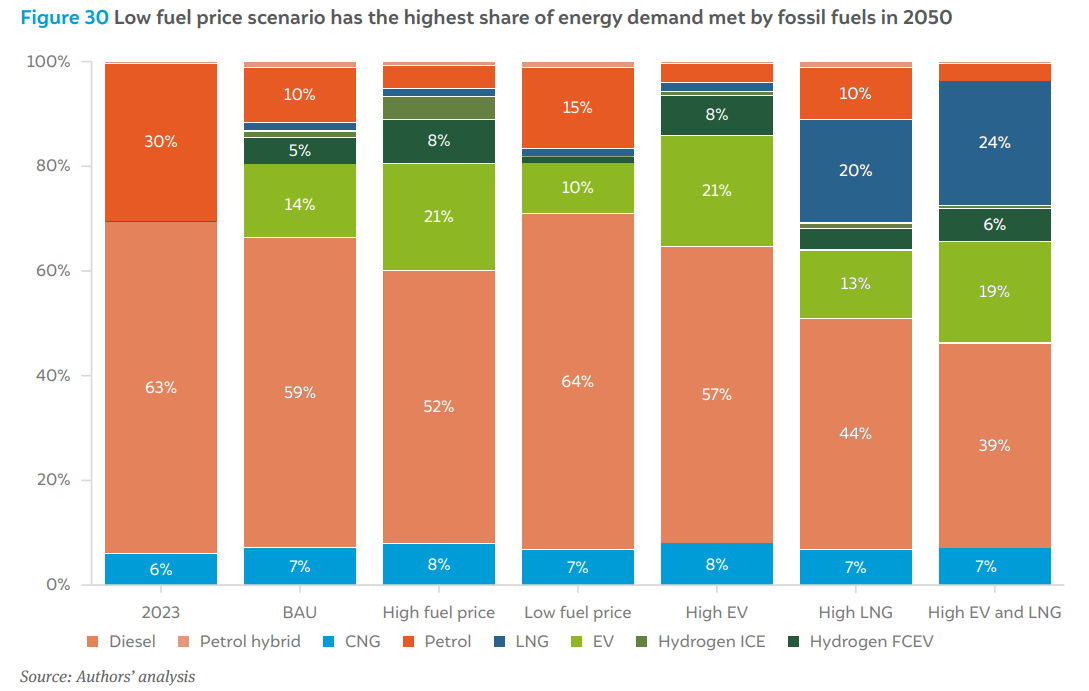
Diesel remains the most energy-intensive and emission-heavy fuel, accounting for nearly 59 per cent of the road transport energy demand in the BAU scenario by 2050 (Figure 13). Even in alternative scenarios, diesel’s share is substantial, with the lowest being 39 per cent in the high EV and LNG scenario. Therefore, it is imperative that we reduce diesel consumption to lower the overall energy demand, and in turn, emissions from the transport sector.
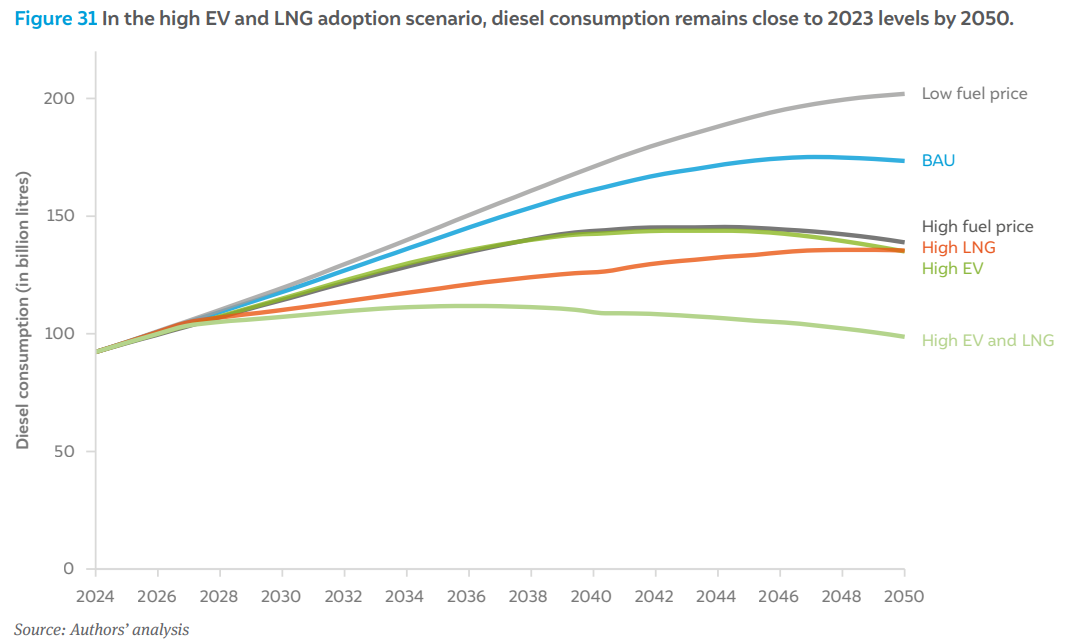
Figure 31 depicts the diesel consumption across scenarios over time. We estimate the low fuel price scenario to have the highest diesel consumption in 2050, at 202 billion litres. This is attributed to the reduced economic competitiveness of EVs when diesel prices are lower than in the BAU scenario. Given the cost-sensitive nature of the Indian automotive market, especially in commercial vehicle segments like MGVs and HGVs, where diesel is predominantly used, the incentive to transition to alternative fuels diminishes under these conditions.
Our analysis indicates that diesel consumption peaks in 2047, 2044, 2043, 2048, and 2036 for the BAU, high fuel price, high EV, high LNG, and high EV and LNG scenarios, respectively. Notably, the low fuel price scenario does not reach a peak within the assessment period ending in 2050. While all scenarios witness an increase in diesel consumption, the extent of this increase varies significantly among scenarios. The smallest difference between 2023 diesel consumption and the peak year occurs in the high EV and LNG scenario, with only a 21 per cent increase. In comparison, the increases are 90 per cent in the BAU scenario, 55 per cent in high EV, 57 per cent in high fuel price, and 46 per cent in high LNG.
By incorporating LNG to power just 22 per cent of bus and HGV stock by 2036 in the high EV and LNG scenario, diesel consumption can be driven to its peak and subsequently reduced. This underscores the need for targeted polices that focus on expanding LNG infrastructure and foster collaboration among OEMs, government stakeholders, and LNG infrastructure providers to effectively curb diesel consumption.
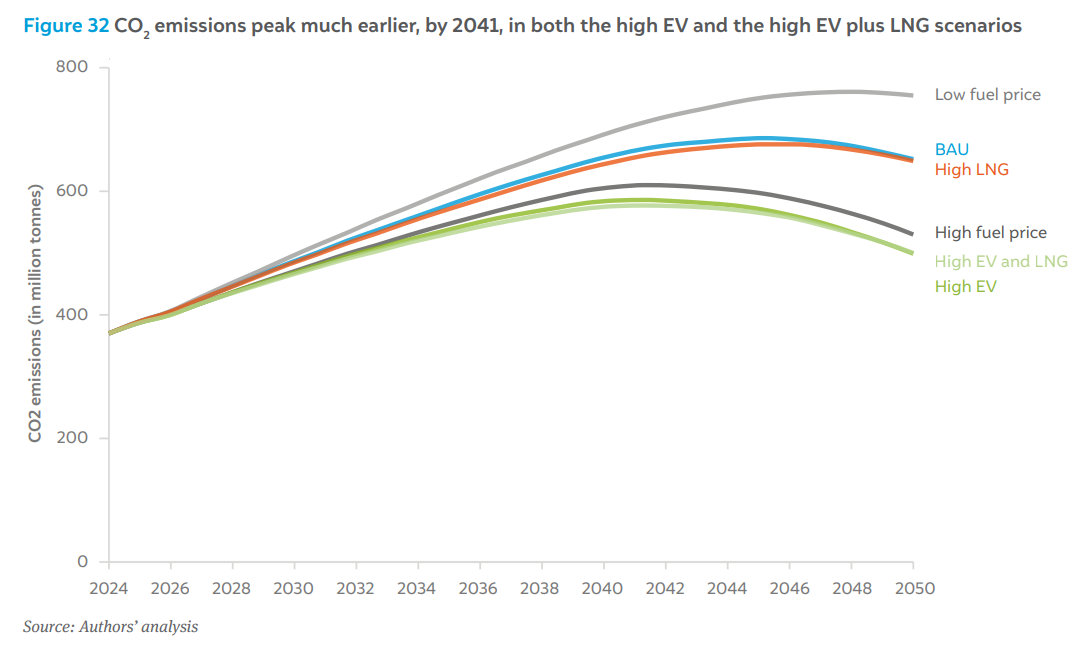
Our analysis indicates that the low fuel price scenario is projected to emit the highest CO2 emissions of nearly 755 million tonnes in 2050. The BAU and high LNG scenarios exhibit nearly identical emission profiles, primarily due to the relatively small difference in perkilometre CO2 emissions between diesel and LNG trucks. While LNG trucks do offer a 12 per cent reduction in CO2 per km, the magnitude of shift from diesel to LNG are not substantial to reduce aggregate emissions. In other words, each LNG truck replaces a diesel truck, but only marginally improves emissions per km—so the net impact on total CO2 emissions is modest. It also indicates that adoption of an alternative fuel like LNG without aggressive electrification may not yield significant emission reductions on its own.
The most promising outcome emerges under the high EV and high EV and LNG scenarios, where emissions fall to around 499 million tonnes of CO2 by 2050. This represents a 23 per cent reduction compared to the BAU and a 34 per cent reduction compared to the low fuel price scenario. Over the period from 2023 to 2050, the high EV and LNG scenario is expected to emit 14.3 billion tonnes of CO2, a reduction of 1.8 billion tonnes from the BAU scenario (16.15 billion tonnes) and 2.8 billion tonnes from the low fuel price scenario (17.16 billion tonnes).
As India’s economy continues to grow and societal aspirations rise accordingly, the country stands at a pivotal moment in the decarbonisation of its transport sector.
Based on our analysis, we urge policymakers, planners, OEMs, fuel suppliers, and technology providers to consider the following actions:
Our analysis estimates that there were around 2 million EVs in India in 2023. This number is projected to rise significantly to approximately 360 million by 2050.
The road transport sector emitted 370 Mt of CO₂ in 2023. This number is projected to peak at 685 Mt in 2045, before declining slightly to 650 Mt by 2050.
India’s transport sector consumed 5.3 Exajoule (EJ) of energy in 2023 and this is expected to double to 10.7 EJ by 2050.
The demand for petrol is estimated at 48 billion litres in 2023. It is projected to peak at 57 billion litres by 2032, before declining to 37 billion litres by 2050. Diesel demand, on the other hand, stood at 92 billion litres in 2023, is expected to peak at 175 billion litres by 2047, and slightly decline to 173 billion litres by 2050.
The transport sector consumed 5.7 MTPA of natural gas (including both CNG and LNG), which is expected to rise to 17 MTPA by 2050.
In 2023, there were only three hydrogen-powered vehicles in India. However, this number is expected to rise to around 1 million by 2050.
How Secure is India’s Energy Future?
Unlocking the Potential for a Gas-Based Economy in India
Advancing India’s Green Steel Transition
CO₂ Pipeline Network for Carbon Capture and Storage in India
Bharat Cleantech Manufacturing Platform: Green Hydrogen Indigenisation Pathways