Council on Energy, Environment and Water Integrated | International | Independent
Suggested citation: Kothadiya, Karan, Hemant Mallya, and Deepak Yadav. 2024. Economic Feasibility of Green Ammonia Use in India's Fertiliser Sector. New Delhi: Council of Energy, Environment and Water.
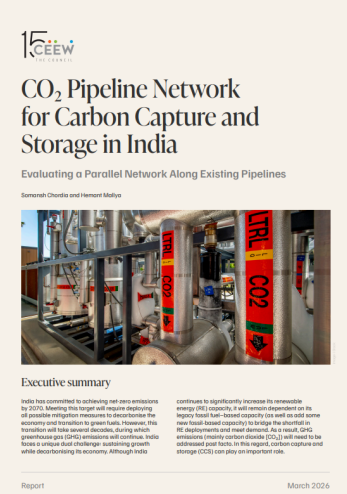
This report presents an estimation of the financial requirements for India’s fertiliser sector to transition to green ammonia adoption across multiple scenarios, with the goal of identifying low-hanging opportunities, understanding imperatives, and preparing a trajectory for adoption. The report outlines the current landscape of the Indian fertiliser industry and the role of green hydrogen in its decarbonisation. The report examines the sector’s ammonia requirements, India’s reliance on imports of natural gas and ammonia for fertiliser production, the cost structure of conventional (grey) ammonia, and how natural gas pricing influences this. It then explores the financial implications of blending green ammonia into both urea and non-urea fertiliser production, including the associated challenges, incremental costs, and potential impacts on government subsidies. Additionally, it assesses the emissions mitigation potential of green ammonia and concludes with policy recommendations to support green ammonia adoption in India’s fertiliser industry.
Following the Green Revolution in India, chemical fertilisers have played a pivotal role in increasing farm outputs, securing the food supply, and generating surplus production for exports, along with the other measures undertaken (Nelson, Ravichandran, and Antony 2019). During the manufacturing process of these fertilisers, ammonia (NH3 ) is used as an intermediary to provide the nitrogenous content. We estimate that India consumes around 17 to 19 million metric tonnes per annum (MTPA) of ammonia for the production of fertilisers such as urea, diammonium phosphate (DAP), and other complex fertilisers (OCFs). In addition, India also indirectly consumes ammonia embedded in fertiliser imports, estimated to be 6.3 million metric tonnes (MT) in the financial year (FY) 2022–23.
All the ammonia produced and used in India currently is grey ammonia, derived from reforming natural gas. This is problematic as the use of grey ammonia leads to significant greenhouse gas emissions, particularly carbon dioxide (CO2 ). The total emissions from ammonia production were estimated to be around 25 MTPA of carbon dioxide equivalents (CO2 eq) in FY 2022–23 (Patidar, et al. 2024). Secondly, India is currently dependent on imports of natural gas and ammonia to produce fertilisers. We estimate that around 86 per cent of the ammonia requirement in FY 2022–23 was reliant on imports1. This dependency on imports renders the fertiliser and agricultural sectors vulnerable to economic and geopolitical risks and makes the Indian economy vulnerable to forex outflow.
Green ammonia, derived from green hydrogen, produced through the electrolysis of water using renewable electricity, is a potential remedy for both these problems. The use of indigenously produced green ammonia will help drive the Indian fertiliser industry’s self- sufficiency and decarbonisation. However, the financial premium associated with a complete transition from grey to green ammonia is exorbitantly high. The high cost of fertilisers produced using green ammonia may make them untenable for farmers without further increasing subsidies, putting additional pressure on the government’s already stressed subsidy expenditure. In 2022–23 alone, the central government spent INR 2,51,340 crore (~USD 31 billion) on fertiliser subsidies (Ministry of Finance 2024). The government must aim to strategically direct the introduction of green ammonia in the fertiliser industry with an incremental blending approach in the short term and structurally reduce the levelised cost of green ammonia in the long term to allay this financial premium.
In this report, we estimate the financial requirements for India’s fertiliser sector to transition to green ammonia adoption across multiple scenarios, with the goal of identifying low-hanging opportunities, understanding imperatives, and preparing a trajectory for adoption.
Fertiliser products in India vary significantly in terms of the volume of consumption, subsidy structures, input costs, and process and supply chain flows. Understanding these structural nuances and the ammonia requirements for the product mix in this context is critical to our analysis.
The worsening N:P:K ratio in fertiliser consumption, the large and rising subsidy on fertilisers, and efforts to promote organic and alternative fertilisers and improve nutrient uptake efficiency are key trends in the sector. We presume that these trends will translate to a muted long- term growth potential for urea but offer a decent growth potential for organic and alternative chemical fertilisers.
We estimate the baseline costs of grey ammonia, along with the landed cost of imported ammonia for non-urea fertilisers. Based on the input costs, we estimate the following:
The difference in grey ammonia costs for urea and non-urea fertiliser production implies that the financial premiums associated with a transition to green ammonia use will also be different. It is important to note that grey ammonia costs reflect the price volatility in the period considered due to the supply chain disruptions caused by the pandemic and geopolitical events. Similar episodes in the future may pose risks to India’s fertiliser sector.
While green ammonia can be a fungible replacement for grey ammonia in non-urea fertiliser production, the technical proof-of-concept of blending green ammonia in urea production has not been demonstrated. In this report, however, we focus mainly on the financial implications of green ammonia adoption while briefly discussing the technical challenges.
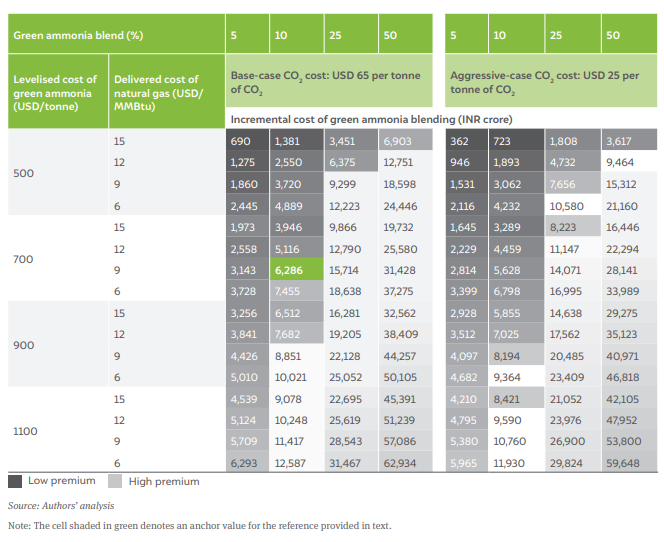
We calculated the incremental cost of blended ammonia over a range of parameters such as the cost of green ammonia (USD 500 to USD 1,100 per tonne), the cost of grey ammonia (USD 200 to USD 600 per tonne), the landed cost of natural gas (USD 6 to USD 15 per million metric British thermal units (MMBtu)), and the proportion of green ammonia blended (5 per cent to 50 per cent). Given the volatility of commodity prices, it is important to note that there is a range of possible outcomes, as illustrated in Table ES1 and Table ES2.
Table ES1 Sensitivities to the incremental cost of blended ammonia used in urea production at the full capacity of 28.3 MTPA (INR crore)
Evidently, 100 per cent green ammonia in fertiliser production in India will impose exorbitant costs at the current economics, even for non-urea fertilisers. An incremental approach, starting with a 5 to 10 per cent blend can cushion the impact on the sector’s financials.
The incremental cost of green ammonia blending for non-urea fertilisers is much lower than the corresponding cost for urea. If the government were to bear the whole incremental cost of blending 10 per cent green ammonia at USD 700 per tonne of ammonia, it would add 3 per cent to 14 per cent (INR 3,535 to INR 6,541 crore) to the subsidy for the domestic production of urea (INR 43,050 to INR 1,25,270 crore) between FY 2019–20 and FY 2022–23, but the additional burden on the subsidy for non-urea fertilisers would be under 6 per cent (below INR 974 crore) over the total subsidy for the domestic production of non-urea fertilisers (INR 15,906 to INR 50,090 crore). In FY 2022–23, geopolitical disturbances led to a sharp rise in grey ammonia costs. Resultantly, we estimate a potential net gain of INR 505 crore with the use of 10 per cent green ammonia in non-urea fertilisers in that year.
Reducing the levelised cost of green ammonia by providing low-cost capital or grants is an important imperative. We estimate that a 23 per cent reduction in the levelised cost of ammonia can be achieved with a 5 percentage point reduction in the capital cost. Using only green ammonia in the Indian fertiliser industry can reduce CO2 eq emissions by more than 32 MTPA as per our analysis. The cost of this mitigation would vary with the difference between green and grey ammonia costs. For urea production, the mitigation cost can range between USD (−10) per tonne of CO2 , signifying a net gain, to USD 232 per tonne of CO2 depending on the difference between green and grey ammonia costs, which can range from green ammonia being cheaper by USD 100 to grey ammonia being cheaper by USD 300 per tonne. For the same difference in the costs of green and grey ammonia, the cost of CO2 mitigation is lower for non-urea fertiliser production, as there is no cost associated with procuring CO2 as a feedstock. The mitigation cost ranges between a net gain of USD 60 to a cost USD 180 per tonne of CO2 .
Table ES2 Sensitivities to the incremental cost of hydrogen are tempered for the production of non-urea fertilisers

The annual cost of blending green ammonia in India’s fertiliser industry, even up to 10 per cent, can range between INR 1,000 to INR 12,000 crore (∼USD 125 to USD 1450 million). If the Indian government bears this cost to catalyse green ammonia adoption, the impact on expenditure will be non-trivial. Hence, the introduction of green ammonia requires a calibrated and systematic approach, which factors in the structure of the industry and the differences in emissions mitigation costs between urea and non-urea fertiliser products. We suggest the following policy recommendations to ease this transition:
These measures will be instrumental in promoting green ammonia adoption, which will reduce the import dependence of the fertiliser sector, and secure its energy needs, in addition to the primary objective of decarbonising the industry.
The use of chemical fertilisers has been instrumental in bringing India out of the grip of frequent famines and setting it on the path towards food sufficiency. Along with the introduction of high-yielding varieties of seeds, mechanised agricultural practices, irrigation equipment, and pesticides by the Green Revolution in the 1960s, chemical fertilisers have played a pivotal role in increasing farm outputs, securing the food supply, and generating surplus production for exports. India produces sufficient key food grains — wheat and rice — to meet the domestic demand of its large population while also being the largest exporter of rice in the world (US Department of Agriculture n.d.).
As the agricultural sector is a cornerstone of the Indian economy, use of fertilisers poses an indirect bearing on livelihoods in addition to the agricultural output. Beyond the economic contribution of the agricultural sector to India’s gross value addition, which stood at 18.3 per cent in the financial year (FY) 2022–23 (Ministry of Agriculture & Farmers Welfare 2023b), it employs around 54 per cent of the Indian workforce (Ministry of Agriculture & Farmers Welfare 2022).
Production of chemical fertilisers leads to greenhouse gas emissions, attributed to the energy consumption in the production process and to the use of ammonia as an intermediary. The ammonia produced and consumed in India for fertiliser production relies on reforming natural gas, which emits carbon dioxide (CO2 ) as a by-product. In addition to this, it imposes import dependency for natural gas on India. We explore how green ammonia can tackle both these issues and what are the premiums associated with its use in this report.
The consumption of fertilisers (Figure 1) that provide major nutrients such as nitrogen (N), phosphorous (P), and potassium (K) grew tremendously from the 1980s onwards, reaching stable levels since 2010. Urea, diammonium phosphate (DAP), and various grades of other complex fertilisers (OCFs) are the main products that deliver these nutrients to farmlands. Over the decade from 2011–12 to 2021–22, the N:P:K ratio in fertiliser consumption became skewed, changing from 4.7:2.3:1 to 7.8:3.1:1 (Nelson, Ravichandran, and Antony 2019), indicating a disproportionate growth in nitrogenous fertiliser consumption.
The growth in fertiliser consumption in India has been heavily aided by the government’s support in the form of subsidies, both for indigenously produced fertilisers as well as for imported fertilisers. The subsidy for the fertiliser sector accounted for INR 251,340 crore (~USD 31 billion) for FY 2022–23 (Ministry of Finance 2024). This makes the fertiliser sector the second largest sector in terms of subsidies received. In addition, the sector also received support from the government as it was guaranteed procurement of cheaper domestic gas that was reserved for it.
Figure 1 Consumption of (N, P, K) fertilisers in India has grown ~4.9 times over 40 years.

Source: Nelson, Ravichandran, and Antony (2019), The Fertiliser Association of India (2022)
Production and imports of fertilisers in India
India has 36 urea manufacturing units and 20 large manufacturing units that can produce NPK fertilisers (The Fertiliser Association of India 2023a). Urea, which primarily delivers nitrogenous content to the soil, is the most important fertiliser in the Indian context. The production of urea, which is at near full capacity (Figure 2), accounts for around 65 per cent of total fertiliser production in India, amounting to an annual production of around 28.5 million metric tonnes (MT) per annum (MTPA) (The Fertiliser Association of India 2023b). Between 2020 and 2022, India augmented its urea production capacity by setting up two new units and reviving three discontinued units, with one more unit under revival scheduled for completion in 2024 (The Fertiliser Association of India 2023b). India’s imports of urea have historically fluctuated around a level of 8 MTPA (Figure 3). However, it aims to reduce this dependence with the aforementioned augmented capacity as well as through the promotion of alternative nitrogen-delivery pathways like nano-urea (Ministry of Chemicals and Fertilizers 2023b). Other chemical fertilisers are critical for providing farms with nutrients such as potassium, phosphorus, and sulphur. This includes NP/NPK fertilisers, including DAP and OCFs of various grades. Production of such non-urea fertilisers in India in 2022–23 stood at 13.6 MT, less than half that of urea. We restrict our analysis to nitrogencontaining complex fertilisers within the non-urea group as other fertilisers do not consume ammonia as an intermediary. Imports constitute a larger proportion of the total consumption for non-urea fertilisers than for urea. The share of imported non-urea fertilisers in total consumption for the category in 2022–23 was around 40 per cent, much higher compared to 21 per cent for urea in the same period.
Figure 2 Production volumes of fertilisers in India have been stagnant in the historical mid-term period.

Source: The Fertiliser Association of India (2023b)
Figure 3 Imports of non-urea fertilisers in India grew at a steady decadal 4.3% compounded annual growth rate to 9.3 MTPA in 2022–23.

Source: The Fertiliser Association of India (2023b)
1.2 Trends in the Indian fertiliser sector
The worsening N:P:K ratio in fertiliser consumption due to overuse of nitrogenous fertilisers —predominantly urea—the large and rising government expenditure on fertiliser subsidies, efforts to promote organic and alternative fertilisers and improve the nutrient uptake efficiency are key trends in the Indian fertiliser sector. We presume that these trends will translate to a muted long-term growth potential for urea production and consumption but a decent growth potential for organic and alternative chemical fertilisers.
Injudicious use of nitrogenous fertilisers, particularly urea
As compared to the world’s largest agricultural producers, India ranks second in nitrogenous fertiliser use per hectare of cropland (Figure 4). It exceeds the world average by around 65 per cent (Ritchie, Roser, and Rosado 2022).
Figure 4 Overuse of nitrogenous fertilisers in India is a worrying prospect.

Source: Ritchie, Roser, and Rosado (2022)
Furthermore, even after accounting for differences in agro-climatic conditions and crop profiles, the N:P:K nutrient ratio in India in FY 2021–22 was highly skewed towards nitrogenous content (National Academy of Agricultural Sciences 2009), standing at 7.7:3.1:1 (The Fertiliser Association of India 2022) against an ideal and accepted nutrient ratio of 4:2:1 (National Academy of Agricultural Sciences 2009). This is a direct consequence of the outsized share of urea in fertiliser consumption. Furthermore, there exist significant regional differences in urea consumption patterns in India, leading to severe overuse in some regions but soil nitrogen deficiency in others (Ministry of Agriculture & Farmers Welfare 2023). There are concerns regarding the falling nitrogen uptake efficiency (Singh 2023) and water contamination due to the overuse of urea (Ministry of Agriculture & Farmers Welfare 2021). While adequate nitrogen delivery is essential for crops, India must find ways to prevent soil degradation, avoid fertiliser wastage, and balance the nutrient profile of fertilisers used on farmlands.
Farmers’ reliance on urea can be explained by the differences in the prices of various fertilisers. Urea is a price-controlled product in India, for which farmers need only pay a delivered price of INR 5.36 (∼USD 0.06) per kg (Department of Fertilizers 2024b). However, non-urea fertilisers, including NP and NPK complexes, which contain a more balanced nutrient profile, are priced dynamically in the market. In direct comparison to urea, their maximum retail prices were much higher – between INR 20 and 47.6 (∼USD 0.24 and USD 0.57) per kg as of February 2024 (Department of Fertilizers 2024b). Thus, the adoption of fertilisers other than urea is impeded by the artificially low prices of urea.
Figure 5 India’s budgeted fertiliser subsidy expenditure has grown threefold over two financial years.

Source: Authors’ compilation from Department of Fertilizers (2018a, 2020, 2021, 2022), The Fertiliser Association of India (2023a), Ministry of Finance (2024)
Rising subsidy expenditure on fertilisers
The recent sharp rise in fertiliser subsidy expenditure in India (Figure 5) is a worrying trend. To understand the dominant factors behind this rise, we assess the structure of subsidy disbursement in India.
Urea and non-urea fertilisers in India are subsidised in different ways. Fertiliser companies that produce and import urea are paid subsidies by the Government of India based on the difference between the set prices of urea and the cost of production or imports, according to specific criteria. Consequently, the total subsidy expenditure for urea in India depends on production costs. These tend to vary widely due to the dependence on one critical raw material and fuel – natural gas. As India imports a significant share of the natural gas used for urea production (78 per cent in FY 2022–23) in addition to importing ammonia and end-fertiliser products, the fertiliser subsidy is subject to the vagaries of volatile international natural gas markets.
Figure 6 There has been a sharp uptick in NBS rates in recent years.

Source: Ministry of Chemicals and Fertilizers (n.d.)
Non-urea products are not price controlled and are subsidised under the Nutrient Based Subsidy (NBS) scheme. The Government of India pays a subsidy per kilogram of nutrient used in certain scheduled non-urea fertiliser products. The rates for N, P, K, and S nutrients, revised annually, have seen a sharp uptick in recent years (Figure 6), which could be due to the government’s focus on balancing the nutrient profile of the fertilisers used and the high costs of imported ammonia, phosphatic rock, and potash.
Promotion of organic and alternative fertilisers through the PM-PRANAM Scheme
The Government of India announced the Prime Minister’s Programme for Restoration, Awareness, Nourishment and Amelioration of Mother Earth (PMPRANAM) scheme in 2023 (Ministry of Chemicals and Fertilizers 2023a). The scheme’s objective is to incentivise the states and union territories (UTs) to promote the usage of alternative and organic fertilisers and moderate the use of chemical fertilisers. Under the scheme, India has tabled a proposal to redirect 50 per cent of the fertiliser subsidy saved by a state or UT through a reduction in consumption of chemical fertilisers benchmarked against its previous three years’ consumption. The scheme also includes a Market Development Assistance programme to support the marketing of organic fertilisers with a subsidy of INR 1,500 (∼USD 19) per tonne (Ministry of Chemicals and Fertilizers 2023a). Provisions to leverage biogas production plants set up under the GOBARdhan scheme by harnessing their residues as organic fertilisers are also included. Five hundred such wasteto-wealth plants are sanctioned to be supported under the PM-PRANAM scheme.
Developments in improving the efficiency of nitrogen uptake
As part of its efforts to improve the efficiency of nutrient use, India has begun testing and producing nano-urea, which supposedly releases nutrients directly to plants in a controlled way. While its effectiveness as a solution is still being evaluated and has not been conclusively established, India has chalked up plans to establish eight new nano-urea plants with an overall production capacity of 220 million litres, intended to potentially replace 19.5 MTPA of conventional urea (Ministry of Chemicals and Fertilizers 2023b).
Green hydrogen can play a role in decarbonising ammonia production. Ammonia is a crucial intermediary product for the major fertilisers used in India – urea, DAP, and OCFs. Its production relies on grey hydrogen, derived from the reformation of natural gas, which emits greenhouse gases, primarily carbon dioxide (CO2 ). The combustion of fuels to drive the reaction between hydrogen and nitrogen to form ammonia adds to the emissions. In 2018, the total emissions from ammonia production were estimated to be around 25 MTPA of carbon dioxide equivalents (CO2 eq) (GHG Platform India n.d.). To mitigate these emissions, green hydrogen produced through electrolysis of water can be used to produce green ammonia. In addition, green-hydrogen-derived ammonia, when reacted with CO2 procured from other industries to produce urea, can unlock a carbon utilisation pathway.
Currently, the economics of switching from grey- to green-hydrogen-based ammonia production are challenging. Given that the agricultural sector is heavily dependent on fertilisers, and its consequent impact on the political economy, the premium associated with green hydrogen use must be lowered as much as possible. We endeavour to assess this premium and address the emergent imperatives of a switch from grey to green ammonia use in India’s fertiliser industry.
Hydrogen and nitrogen gases react at high temperatures and pressures to produce ammonia (NH3 ), an intermediary required in the production of fertilisers. Fossil fuels such as coal, natural gas, or naphtha are typically reformed to produce hydrogen. They are also used as fuel to provide heat for the reactions. Nitrogen gas, which is required for the process, is introduced by injecting air into the secondary reformer. A by-product of the reforming reactions is CO2 gas. In urea production, this CO2 produced by the reformers gets utilised in the subsequent step.
The production of urea involves the reaction of ammonia and CO2 through the Bosch–Meiser process. At stoichiometric proportions, 1 tonne of urea production requires around 0.57 tonnes of ammonia and approximately 0.73 tonnes of CO2 . To produce 0.57 tonnes of ammonia, 0.1 tonnes of hydrogen gas is needed to react with 0.47 tonnes of nitrogen gas.
The consumption of ammonia in the production of non-urea fertilisers is determined by the proportion of nitrogen required in terms of weight in that particular fertiliser. For instance, DAP requires nitrogen content to be 18 per cent by weight. This nitrogen content in DAP is provided by ammonia or urea, which are used as raw materials in production. For OCFs, the nitrogen content is denoted by the fertiliser grade, expressed in an N:P:K:S format. For example, a complex fertiliser with a grade 12:32:16:0 contains 12 per cent nitrogen, 32 per cent phosphorus, 16 per cent potassium, and zero per cent sulphur by weight. The ammonia requirement for OCFs is calculated using an approach similar to that adopted for DAP.
We estimate that India’s fertiliser sector required around 19.1 MTPA of ammonia in FY 2022–23 (Figure 7). The increase in the demand for ammonia in FY 2022–23 is attributable to the increase in urea manufacturing capacity. Around 84 per cent of the ammonia requirement is for urea production alone, as it consumes much more ammonia per unit of product. In addition, the higher production volumes of urea as compared to other fertilisers also skews this proportion.
Almost all the ammonia necessary for urea production is obtained from in-house integrated units. Natural gas is reformed to produce grey hydrogen and, subsequently, grey ammonia in urea production. We estimate that around 78 per cent of the natural gas used for urea production in FY 2022–23 was imported (Petroleum Planning & Analysis Cell 2023b). In contrast, we estimate that for non-urea fertilisers, around 79 per cent to 89 per cent of the ammonia required is directly imported. The rest is produced in India by reforming natural gas.
Figure 7 Urea consumes around 84% of the ammonia used as feedstock.

Source: Authors’ analysis
Figure 8 Around 86% of the total ammonia consumed in India is reliant on imports of ammonia or natural gas.

Source: Authors’ analysis
The Indian fertiliser sector also consumes ammonia indirectly through imported fertilisers. Such embedded ammonia amounted to 6.3 MT in FY 2022–23, accounting for 24 per cent of the total consumption of ammonia, which stood at 25.5 MT in the same period (Figure 8). Factoring in imported liquefied natural gas (LNG), imported ammonia, and embedded ammonia in imported fertiliser end products, we observe that around 86 per cent of the ammonia consumption in India is reliant on imports.
In addition to its use as a feedstock in ammonia production, natural gas is also used to produce heat to catalyse reactions in fertiliser plants. Some fertiliser plants also operate captive power generation plants that use generators that operate on natural gas. These, however, don’t account for a significant share of natural gas demand, as our estimates suggest that only around three per cent of the natural gas supplied to fertiliser units is used for power generation.
The fertiliser sector in India consumed 19.4 billion cubic metres of gas in FY 2022–23 (Figure 9) (Petroleum Planning & Analysis Cell 2023b). Increasingly larger proportions of this total gas consumption are commanded by imported re-gasified liquefied natural gas (RLNG), which is used to produce both urea and non-urea fertilisers.
Urea production units in India are characterised by wide variations in specific energy consumption (SEC) (Figure 10), and older plants with significant vintage are not energy efficient. Currently, all urea production plants are divided into three groups, with target energy norms (TENs) ascribed to each group (Department of Fertilizers 2024a): 5.5 Gcal per tonne of urea for Group I, 6.2 Gcal per tonne for Group II, and 6.5 Gcal per tonne for Group III. These norms are used as the basis for calculating the urea subsidy outlay (Department of Fertilizers 2024a). Blending green ammonia could be instrumental in reducing natural gas consumption for the sector as a whole and, in effect, improving energy efficiency. This will help create room within the subsidy expenditure for support for green ammonia adoption. Furthermore, as most of the natural gas is imported, a transition to domestic green ammonia use will secure the energy needs of the sector against economic as well as political shocks.
Figure 9 India’s fertiliser sector is increasingly dependent on imported natural gas.

Source: Authors’ analysis based on Petroleum Planning & Analysis Cell (2020, 2021, 2022, 2023b)
Figure 10 India’s urea manufacturing units have the potential to increase efficiency.

Source: Department of Fertilizers (2018b), Bhushan et al. (2019)
We have estimated a baseline grey ammonia cost for the fertiliser sector to assess the financial premium of green ammonia over grey ammonia. Grey ammonia costs are heavily dependent on natural gas costs. The supply structures and pricing mechanisms for natural gas directly affect the delivered cost of grey hydrogen for the production of urea and non-urea fertilisers.
Fertiliser companies procure natural gas from domestic and international suppliers through long-term contracts and also through spot purchase mechanisms. For all urea manufacturing units, the input costs of natural gas are equalised under the Guidelines for Pooling of Gas in Fertiliser (Urea) Sector (Ministry of Petroleum and Natural Gas 2015). A virtual pool operator aggregates demand and prices from all urea manufacturing units on a monthly basis to issue a single delivered price for all the units. The pool operator reconciles the balances of each unit against this delivered price on a monthly basis. No such measures are imposed for the production of non-urea fertilisers, which leads to differences in input costs for the producers of these fertilisers.
We estimate the delivered prices of natural gas by considering the various cost components. In the case of imported LNG, an import duty and a social welfare surcharge are levied upon the contracted gas price. Since it is liquefied, it must be re-gasified before transmission through a pipeline. The transmitter imposes a regasification tariff as well as pipeline transmission charges. Both these charges incur Goods and Services Tax (GST). In addition to these components, suppliers’ margins and a state-wise value-added tax (VAT) are added to finally arrive at the delivered price of natural gas. We have estimated the delivered price for domestic natural gas using the imported LNG tax structure and excluding irrelevant components such as import duty and re-gasification tariff. Figure 11 depicts the price build-up schematically.
Due to the inherent differences in the base prices of domestic natural gas and imported LNG, as well as differences in the price build-up components, the delivered prices of domestic and natural gas vary widely. This variation leads to differences between the delivered prices of natural gas for urea and non-urea fertiliser production (Table 1). We estimate that the delivered gas prices for urea manufacturing were 22 per cent to 34 per cent cheaper (between FY 2019–20 and FY 2022–23) than those for non-urea fertilisers.
Most of the ammonia used in the production of nonurea fertilisers is imported, and therefore, we estimate the cost of ammonia as a weighted average of the cost of imported and domestically produced ammonia for non-urea fertiliser production. We observe that the costs of imported ammonia and imported RLNG rose sharply in FYs 2021–22 and 2022–23 as a result of supply chain disruptions and geopolitical factors, which translated to a rise in the overall cost of ammonia for non-urea fertiliser production in India.
Figure 11 Import duty and re-gasification tariffs are additional components in the price build-up of imported RLNG

Source: Authors’ analysis
Table 1 Gas prices for urea production are 22% to 34% cheaper than those for non-urea fertiliser production.

Source: Authors’ analysis
Table 2 Estimated grey ammonia costs for urea and non-urea fertiliser production in India

Source: Authors’ analysis
The differences in the delivered prices of natural gas in the fertiliser sector lead to differences in the cost of grey ammonia. We estimate the cost of grey ammonia produced in India to range from USD 197 to USD 510 per tonne for urea production (Table 2), whereas it is higher for the production of non-urea fertilisers, ranging from USD 287 to USD 919 per tonne of ammonia during the period from FY 2019–20 to FY 2022–23. This period witnessed significant volatility in the cost of ammonia produced in India and imported from overseas due to supply chain disturbances caused by the pandemic and global conflicts. The estimation process is explained in greater detail in Annexure 1.
Blending green ammonia in existing fertiliser production may impose an additional cost as the levelised cost of green ammonia in India ranges between USD 700 to USD 950 per tonne (IRENA and AEA 2022; Indo-German Energy Forum 2023; Pawar et al. 2021). This cost is higher than that for grey ammonia estimated in Section 3 for the years that did not experience extensive supply-chain disturbances.
Green hydrogen can be introduced in two ways in urea production: green hydrogen can be introduced at the suction of the synthesis compressor and blended with syngas, or green ammonia can be blended in the urea production step. Feasibility studies and pilot projects have been undertaken (Box 1) that aim to blend green ammonia in existing fertiliser production units. The schematic in Figure 12 depicts the assumptions underlying our estimate of the incremental cost of ammonia in the urea production process. We consider blending green ammonia with grey ammonia out of the integrated ammonia unit into the Bosch–Meiser process for urea production. For the production of non-urea fertilisers, CO2 as a raw material is not required, and we consider green ammonia to be a fungible replacement for grey ammonia.
Figure 12 Schematic of the process used for estimating the incremental cost of hydrogen in urea production (indexed to 1 tonne of urea production)

Source: Authors’ analysis
For both urea and non-urea fertiliser production, we estimate the incremental cost of green ammonia over grey ammonia for four blending proportions: 5 per cent, 10 per cent, 25 per cent, and 50 per cent. In the case of urea production, we have used a capture cost of USD 50 per tonne of CO2 (IEA 2021) and a transport and handling cost of USD 15 per tonne of CO2 (Smith et al. 2021) in the base case. For the aggressive case, we used a capture cost of USD 20 per tonne of CO2 and a transport and handling cost of USD 5 per tonne of CO2.
Although green ammonia blending poses technical and operational challenges in addition to the financial premium, in this paper, we will focus mainly on the financial implications that such a green ammonia blend will impose on the fertiliser sector and only briefly discuss the technical challenges.
Firstly, a blending mechanism necessitates retrofitting old plants, which could be problematic due to space constraints. Managing the turn-down of existing reformers is the second challenge. If the capacity utilisation of the integrated ammonia unit drops, the overall energy efficiency of urea production reduces. This is because waste heat and steam recirculation loops that are calibrated for a specific capacity get disturbed. Thus, additional energy would be required to meet the necessary process parameters.
Finally, the requirement of procuring CO2 for urea production is the most prominent challenge for green ammonia blending. In the current urea production process, sufficient CO2 from the integrated ammonia unit is captured and fed into the Bosch–Meiser process, as depicted in Figure 12. However, blending green ammonia will require the additional procurement of CO2 externally. Our preliminary estimations have yielded a green ammonia blending threshold ranging between 16 per cent and 30 per cent up to which blending will not require external CO2 . Details of the estimation are presented in Annexure 2. The operational parameters in an actual blending scenario can drastically affect these thresholds. Considering this, our estimates in Sections 4.3 and 4.4 account for the costs of procuring CO2 in various blending scenarios.
A greenfield urea production facility that relies on green ammonia and captured CO2 could mitigate the technical challenges associated with blending. However, the financial premium for urea that is 100 per cent green ammonia derived will be massive. Therefore, there is a need to consider incremental blending of green ammonia in fertiliser plants to mitigate the impact on overall subsidy flow to the sector.
We estimate that a 10 per cent blend of green ammonia with a levelised cost of USD 700 per tonne (levelised cost of ∼USD 2.8 per kg of green hydrogen) against a delivered price of natural gas of USD 9 per million metric British thermal units (MMBtu) will yield INR 6,286 crore (∼USD 785 million) as the total incremental cost of ammonia in the base case scenario for CO2 costs. This amounts to an increment of around 17 per cent in the cost of ammonia. The corresponding increase in urea production cost is INR 2.22 per kg (∼USD 0.03) against an overall production cost which ranged between INR 15 (~USD 0.2) to INR 25 (~USD 0.3) per kg between FY 2019–20 and FY 2022–23 as per our estimates. The incremental cost of ammonia rises with an increase in the blending proportion and the cost of green ammonia, but it reduces with a rise in natural gas prices. Table 3 presents the incremental cost of ammonia (in INR crore) across ranges of various parameters associated with natural gas prices, the cost of green ammonia, and the level of green ammonia blending. We assume full-capacity production of urea in India, which stands at 28.3 MTPA. Table 4 presents the sensitivities in terms of percentage over grey ammonia costs. Annexure 3 presents the key assumptions used in this estimation.
Table 3 Sensitivities to the incremental cost of green ammonia for urea production at the full capacity of 28.3 MTPA (INR crore)

Source: Authors’ analysis
Table 4 Sensitivities to the incremental cost of green ammonia for urea production at full capacity in terms of percentage over the cost of grey ammonia.

Source: Authors’ analysis
For the production of non-urea fertilisers, we estimate that a 10 per cent blend of green ammonia with a levelised cost of USD 700 per tonne against a grey ammonia cost of USD 400 per tonne will result in an incremental cost of INR 684 crore (∼USD 85 million), assuming average production levels for FYs from 2019–20 to 2021–22. This amounts to an incremental cost of INR 0.54 (∼USD 0.007) per kg of fertiliser end product compared to a market price ranging between INR 20 and INR 47 per kg (∼USD 0.2 to USD 0.6) (Department of Fertilizers 2024b). This amounts to an increment of 8 per cent over the cost of non-urea fertilisers produced grey ammonia vis-à-vis 14 per cent observed in the case of urea. The associated sensitivities pertaining to the incremental cost of hydrogen are presented in Table 5. Here, we additionally include a 100 per cent green ammonia blending scenario as the technical and economic challenges associated with using green ammonia in non-urea fertiliser production are much less formidable.
Table 5 Sensitivities to the incremental cost of hydrogen are tempered for the production of non-urea fertilisers.

Source: Authors’ analysis
We observe that on an absolute basis, the incremental cost of green ammonia blending in the production of non-urea fertilisers is lower than that for urea production. Under certain conditions, it may even be cheaper to use green ammonia rather than grey ammonia. This difference between the incremental costs of green ammonia in urea and non-urea fertiliser production is even more pronounced when given as percentages (Table 6).
Table 6 Sensitivities to the incremental cost of green ammonia for non-urea fertiliser production over the cost of grey ammonia in terms of percentage

Source: Authors’ analysis
The incremental costs of ammonia estimated in Sections 4.3 and 4.4 are significant enough to warrant rendering governmental financial support to fertiliser units. In Table 7, we present an estimation of the impact on the government’s subsidy outlay in a scenario where 10 per cent green ammonia is blended in domestically produced fertilisers at a levelised cost of USD 700 per tonne and is fully supported by the government. In this scenario, we estimate that the impact on the fertiliser subsidy for domestic urea production will range from around 3 per cent to 14 per cent, considering corresponding grey ammonia costs for the FY. For nonurea fertilisers, the impact on the subsidy component for indigenous NPK fertiliser production would range from under 6 per cent in FY 2019–20 to –1 per cent in FY 2022–23. The negative impact signifying a potential gain in FY 2022–23 is attributed to a sharp rise in grey ammonia costs due to geopolitical disturbances.
Table 7 Impact on government subsidies for domestic production of fertilisers with green ammonia blending will be much lower for non-urea fertilisers.

Source: Authors’ analysis based on Department of Fertilizers (2018a, 2020, 2021, 2022), The Fertiliser Association of India (2023a), Ministry of Finance (2024)
Fertiliser production in India has the potential to become a net-negative emissions industry with a switch to 100 per cent green ammonia. A transition to green ammonia would reduce emissions from the reforming process required to produce hydrogen and absorb external CO2 captured from other industrial emissions in the urea production process.
Figure 13 presents the variations in the emissions mitigation potential as a function of the proportion of green ammonia blended in the urea and non-urea fertiliser production processes. We account only for the mitigation of emissions from fertiliser plants. The emissions from the application of fertilisers to farms are not considered.
For urea, we estimate the mitigation potential of CO2 emissions to vary between 0.05 kg per kg of urea at a 5 per cent green ammonia blend and 0.94 kg per kg of urea when 100 per cent green ammonia is used. At a full-capacity production level, this implies a potential mitigation of 1.3 MTPA to 26.6 MTPA of CO2 emissions. For non-urea fertilisers, the emission mitigation potential of green ammonia blending is estimated to be lower due to the lower specific consumption of ammonia in the end products, and the mitigation potential of CO2 emissions would vary between 0.02 kg per kg of fertiliser at a 5 per cent green ammonia blend to 0.36 kg per kg of fertiliser for 100 per cent green ammonia. The total CO2 mitigation potential range is 0.2 MTPA to 4.7 MTPA for non-urea fertiliser products.
The emission mitigation costs are estimated separately for urea and non-urea fertilisers to account for the variance in grey ammonia costs and to factor in the cost of the external CO2 that must be procured for green ammonia blending in urea production. We estimate that the emissions mitigation cost for blending green ammonia in urea fertilisers will range from a net gain of around USD 10 per tonne of CO2 mitigated in the most aggressive scenario to around USD 230 per tonne of CO2 mitigated in the most conservative scenario (Figure 14). The corresponding ranges for non-urea fertilisers are lower – from a net gain of USD 60 per tonne of CO2 to a cost of USD 181 per tonne of CO2 mitigated. As there is no need for externally sourced CO2 in non-urea fertiliser production, the cost of mitigation is lower for non-urea fertilisers, although the difference in grey and green ammonia costs remains the same.
Figure 13 The specific emissions mitigation potential of green ammonia in fertiliser production is higher for urea production.

Source: Authors’ analysis
Figure 14 Costs of CO2 mitigation with green ammonia blending in non-urea fertiliser production would be lower for the same green premium.

Source: Authors’ analysis
A strategic and calibrated approach to introducing green ammonia into India’s fertiliser industry is needed considering the criticality of fertiliser use in agriculture, green ammonia’s potential to mitigate the emissions from fertiliser production and the difference in green and grey ammonia costs. In the short term, green ammonia use in non-urea fertilisers must be promoted over urea as the difference in green and grey ammonia costs is lesser, and the technical requirements are simpler for non-urea fertilisers. In the long term, pathways to structurally reduce the levelised cost of green ammonia, demonstrate the proof-of-concept of green ammonia blending in urea production, and leverage carbon credits need to be explored. These measures will be instrumental in promoting green ammonia adoption, which will reduce the import dependence of the fertiliser sector, and secure its energy needs, in addition to the primary objective of decarbonising the industry.
Unlocking the Potential for a Gas-Based Economy in India
How Secure is India’s Energy Future?

Advancing India’s Green Steel Transition
CO₂ Pipeline Network for Carbon Capture and Storage in India
Bharat Cleantech Manufacturing Platform: Green Hydrogen Indigenisation Pathways
