Council on Energy, Environment and Water Integrated | International | Independent
Vaibhav Gupta, Tirtha Biswas, Karthik Ganesan
September 2017 | Industrial Sustainability
Citation: Gupta, V., Biswas, T., & Ganesan, K. (2017). Industrial Emissions (Ver 2.0). Retrieved from GHG Platform - Council on Energy, Environment and Water.
This study provides an in-depth assessment of greenhouse gas (GHG) emissions from the manufacturing sector (including construction) in India from 2005 to 2013. Part of The Council’s work as a member of the GHG Platform India, this report is a revised and updated version of previous estimates. It was published simultaneously with an a state-level emissions estimate report.
This study covers three key greenhouse gases, namely - carbon dioxide (CO2), methane (CH4), and nitrous oxide (N2O), which account for a large share of anthropogenic emissions from India. Over the past few years, GHG emissions from the manufacturing activities in India have increased at a rapid rate of 8 per cent (CAGR); rising from ~315 Million Tonnes (MMT) of carbon dioxide equivalent (CO2e) in 2005, to ~623 MMT in 2013. This includes combined emissions from energy use, as well as industrial process and product use (IPPU).
The Council has followed a bottom-up approach, making use of secondary datasets predominantly obtained from the Ministry of Statistics and Programme Implementation (MOSPI). This report also gives an overview of the methodology behind the numbers presented.
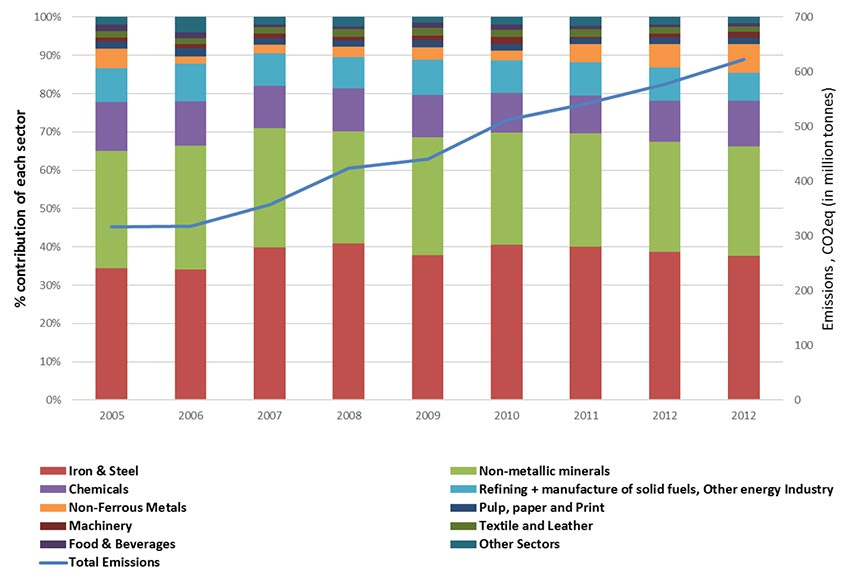
Source: CEEW analysis, 2017
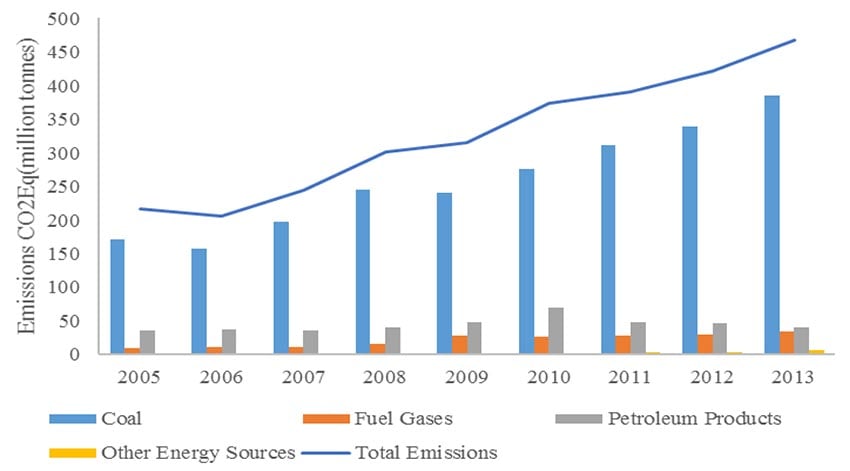
Source: CEEW analysis, 2017
CEEW is the lead partner of the GHG Platform India for the development of emissions estimates from manufacturing industries. These estimates are also compiled into an overall Trends Analysis of GHG Emissions in India, published by the GHG Platform.

Unlocking the Potential for a Gas-Based Economy in India
How Secure is India’s Energy Future?
Advancing India’s Green Steel Transition
CO₂ Pipeline Network for Carbon Capture and Storage in India
Bharat Cleantech Manufacturing Platform: Green Hydrogen Indigenisation Pathways