Council on Energy, Environment and Water Integrated | International | Independent
Suggested citation: Patra, Arpan, Tanushree Ganguly, Aishwarya Tiwari, Arvind Kumar, Sairam Dhandapani, and Sandeep Narang. 2025. How can India Reduce Pollution from Construction Activities? Strengthening the Pollution Monitoring Regime. New Delhi: Council on Energy, Environment and Water.
The study focuses on construction and demolition (C&D) activities as a major source of urban air pollution in India. It identifies gaps in the current pollution monitoring regime for construction sites and proposes strategies for improved compliance with cleaner air practices. The study draws insights from stakeholder interactions, literature review, and reviews of regulations in other countries. The study proposes three ways to monitor air quality at C&D sites.
Construction activities are one of the major sources of urban air pollution. In this report, the word ‘construction’ implies both construction and demolition (C&D). In New Delhi, for instance, dust and construction work contribute around 15 per cent to the PM10 (particulate matter with a diameter ≤10 micrometres) concentration at the city level. Similarly, the contribution of C&D activities to PM10 is projected to increase in the National Capital Region (NCR – encompassing Delhi and the surrounding districts) (ARAI and TERI 2018). Studies have reported that prolonged exposure to these particles can cause severe cardiovascular and respiratory diseases (Blaauw et al. 2022; Robert et al. 2023). As construction activities in India are expected to increase further (they grew by 13.3 per cent in July–September 2023 compared with 2022), it is vital to effectively regulate their impact on air quality (AQ) at the local and regional levels.
Several laws and regulations exist at the city, regional, and national levels to restrict air pollution from construction activities. Nevertheless, there is a need for improved compliance to further reduce the AQ burden caused by this sector. Some Indian cities have begun implementing bans on construction during severe episodes of air pollution as a measure to improve AQ. However, there is a lack of studies demonstrating the effectiveness of these bans. Additionally, such bans impose economic burdens, including project delays. Further, such bans can introduce delays in construction schedules, forcing daily wage labourers to migrate to other places in search of work. In Delhi, construction activities were banned for a total of 73 days in 2022 and 2023 due to poor AQ.
While the existing regulations in Delhi NCR for AQ management at C&D sites mandate monitoring, we find a lack of clarity regarding which monitoring technologies should be used, where they should be installed, and how, when, and by whom the collected data should be utilised. Without consistent monitoring protocols, regulatory mandates requiring the deployment of AQ monitors will face challenges as it may not be possible to compare data from on-site monitors across different construction sites. This raises concerns about the reliability and validity of such data when they are used to regulate C&D activities.
Furthermore, the existing system lacks a standardised method for establishing pollution thresholds at these sites. Such thresholds are essential to estimate and differentiate the impact of C&D activities on local or regional AQ, in relation to other air pollution sources in the vicinity. The absence of clear criteria for assessing air pollution levels at construction sites makes it challenging to identify non-compliant sites and monitor their impacts effectively.
To address these gaps, it is crucial to establish a systematic approach to setting thresholds based on reported data for implementing an effective, alert- based regulatory system. We examine three questions pertaining to AQ monitoring at construction sites: (1) how to monitor AQ, (2) how to use the AQ data, and (3) how to ensure compliance with existing standards during severe air pollution episodes.
Through this issue brief, we aim to provide insights and recommendations for improving compliance with cleaner air practices at building sites. We aim to provide guidance on the collection and effective utilisation of AQ data to regulate site activities effectively. These efforts are intended to strengthen air pollution mitigation measures and reduce exposure to air pollution in India.
We identified the aforementioned gaps in the monitoring regime through stakeholder interactions and a detailed literature review of existing methods for monitoring AQ at construction sites. The monitoring protocol for these sites should quantify the relative impacts of C&D activities on local air pollution levels. For regulatory purposes, there should be activity- specific categorisation of the potential contribution of construction work to air pollution, along with assessment of exposure risks for people living in and around building sites.
| Strategy | Monitor positioning | Regulatory objective served | Type of site recommended for |
|---|---|---|---|
| Fencing method | Monitors should be placed on the fences of the construction site | To quantify the impact of construction work on local AQ | Larger (>20,000 m²) sites |
| Concentric circle approach | Monitors should be placed in concentric circles to capture nearby activities within the construction site | To estimate the impact of specific activities on the concentration of pollutants in order to determine which activities are relatively more polluting and to what extent | Smaller and medium-sized (<20,000 m²) sites |
| Land use method | Monitors should be deployed on all sides facing different land uses | To quantify the short- or long-term exposure of the people working at the site and those living or spending the maximum amount of their time in the surrounding areas | Smaller construction sites in the central city areas and places with mixed land uses |
Source: Authors' compilation based on the inductive coding method
In India, construction projects are geared towards creating commercial, residential, industrial, or infrastructure-related developments. In recent times, the construction sector has grown due to the synergistic impacts of government efforts (e.g., the Pradhan Mantri Awas Yojana – Urban, 2015) and increasing urbanisation.
For the period 2024-2028, with a CAGR of 9.8 per cent, the construction industry output in India has been estimated to reach INR 36.58 trillion by 2028. Currently, it contributes around 8 per cent to the national GDP and employs more than 40 million people (India Construction Industry Report 2024) . The sector is experiencing the growth in both residential and commercial segments due to government policies, rising demand, and the adoption of advanced technologies. Moreover, initiatives led by the Finance Ministry are expected to generate employment in urban and rural areas, further driving economic development.
However, the exponential growth in this sector might have led it to become one of the primary contributors to air pollution. City-specific source apportionment studies indicate that the re-suspension of dust from large, medium, and small construction sites degrades air quality (AQ) at the local and regional level. For instance, in cities such as Delhi, Amritsar, and Chandigarh, the resuspension of dust accounts for around 18–20 per cent of fine particle matter (PM2.5 – particulate matter with a diameter ≤2.5 micrometres) (Guttikunda, Nishadh, and Jawahar 2019).
This explains why this sector is frequently blamed during poor AQ episodes. For instance, in Delhi, construction activities were restricted for nearly 53 days in 2022 and 20 days in 2023 (Confederation of Indian Industry 2023) as an emergency response to decrease the air pollution burden on citizens. However, these bans caused financial stress to customers, contractors, and labourers. A one-month suspension of construction activities might result in a delay of three to four months in a project’s timeline (Kumar n.d.). Additionally, to recover the losses suffered during this period, builders pass down the burden to customers. However, the effectiveness of such bans in improving AQ has not been established.
While policymakers and regulators have put in place several restrictive measures to limit the detrimental effects of construction activities on the overall AQ of the region, there have been frequent instances of noncompliance – due to a lack of awareness, difficulties in changing behaviours, and financial factors. Noncompliance on sites continues to significantly impact AQ, the environment, and the health of people in the vicinity.
Pollution levels within and near construction sites are largely dependent on the concurrent phases of construction (nature and scale of activities) ongoing at the site. Meterological variations also impact pollution levels at the site and in the surrounding areas, affecting the health of the people working at the site or residing in the neighbourhood. A study in China reported that the local AQ of the area surrounding a construction site deteriorated, and the PM2.5 levels increased 1.4 times due to the construction activity at the site (Frimpong et al. 2022, Yan et al., 2018, Yan et al., 2020).
Studies estimating the exposure risk of people working at construction sites report that workers experience several short-term and long-term health issues (Khan et al. 2021; Rönnberg, Ringdahl, and Fredriksson 2023). The health problems mostly include respiratory illnesses, heart diseases, and skin allergies, depending on the type of activity and duration of exposure. Exposure to construction dust has also been linked to chronic obstructive pulmonary disease, lung cancer, cardiovascular illness, and symptoms of other respiratory illnesses (Azarmi, Kumar, and Mulheron 2014; Khan et al. 2021). The prevalence of silicosis has been widely reported in the literature (Kowalewski 2022). For instance, in the US, workers developed silicosis due to continual exposure to dust from abrasive blasting, sawing and drilling concrete, milling, and grinding (Kowalewski 2022). Their eight-hour time weighted exposure was several times higher than the limit set by the National Institute of Occupational Health and Safety (0.05 milligrams per cubic metre of air in an eight-hour time-weighted average). Given the significant health and environmental challenges caused by air pollution, there is a need to find suitable measures to mitigate the impacts.
Studies have proven that a strong regulatory architecture with an efficient monitoring and compliance mechanism (Kanchan 2022; Zutshi and Creed 2015, Commodore et al., 2017), behavioural changes (Shepherd et al., 2010), and technological improvements (Larkin and Hystad, 2017; Zuo et al. 2024) can reduce the air pollution impact of construction activities.
Regulations for managing the environmental impacts of construction activities
In India, the legislative framework to regulate construction work is diverse, with different sets of laws, rules, and regulations. Within this gamut, environmental regulations governing construction and demolition (C&D) activities can be broadly classified into two categories: (1) those to be followed before the commencement of any construction activity and (2) those to be complied with during any construction process.
I. Laws that mandate that different types of environmental clearances (ECs) must be secured before engaging in any construction activity: These laws specify the environmental criteria that building projects should meet before the construction work starts. These primarily include the Environmental Impact Assessment (EIA) Notification, 2006, and its subsequent amendments issued under the Environment Protection Act, 1986 (Parivesh n.d.a). The 2006 notification classified construction projects into two categories, A and B.1 Projects falling under Category A are required to hold public consultations to discern the potential environmental impact of the project. These projects are further categorised
as per an amendment passed in 2014 based on their valuation, the project site, the ecological sensitivity of its surroundings, and so on. As a result, a handful of building projects, such as schools and hostels, are not required to obtain ECs as long as they have received authorisation under waste management rules and have certain systems, such as rainwater harvesting, in place.
Within Category B, projects are further divided into B1 and B2 by state-level expert appraisal committees. B1 projects are required to provide an EIA report, while B2 projects do not need one. Unlike B2 projects, most Category A and B1 projects involve public consultations. In general, Category A projects face stringent scrutiny, while Category B projects enjoy a more relaxed clearance process.
Construction activities around coastal areas are also required to obtain clearances under the Coastal Regulation Zone (CRZ) notifications. 2 As per these notifications, which are released from time to time, projects are divided into four categories depending on the ecosystem’s sensitivity, the population, and infrastructural density. Coastal zone management authorities (CZMAs) have been constituted for different coastal regions under these regulations and are responsible for preparing coastal zone management plans (CZMPs). Construction project proponents are required to comply with these CZMPs.
II. Laws regulating ongoing construction activities: These laws direct how construction activities should be carried out on the sites and include the following:
a. The National Building Code, 2016, provides a set of guidelines and standards that construction agencies have to follow in the design, construction, and maintenance of buildings in India.
b. The 2018 amendments to the Environment Protection Act, 1986, mandate the implementation of dust mitigation practices during C&D activities. Some of these measures are as follows:
c. The Construction and Demolition Waste Management (C&D WM) Rules, 2016, and Solid Wastes Management Rules, 2016, also specify how C&D and solid waste are to be managed by project developers on site.
In addition, the Solid Waste Management Rules, 2016, stipulate mandates for collecting, storing, transporting, processing, and disposing of C&D waste. The following are some of the ways in which the rules are helpful:
Key provisions from the regulations discussed in this section are listed in Annexure A.
The compliance monitoring regime
To realise the full potential of regulations, the regulatory framework should be complemented by a robust compliance monitoring regime. In the context of construction pollution management, we find that the compliance monitoring mechanism is well-defined, but it has gaps, which are highlighted later in this section.
In accordance with the Environment (Protection) Amendment Act, 2018, construction companies are required to maintain PM2.5 and PM10 levels at construction sites that align with the NAAQS. The Commission for Air Quality Management in National Capital Region and Adjoining Areas (CAQM), which was constituted to protect and improve AQ in the NCR and adjoining areas, has issued from time to time a host of statutory directions and advisories to regulate construction dust emissions, besides calling for compliance with various statutes, namely the Construction and Demolition Waste Management Rules and related CPCB guidelines. CAQM has an extensive monitoring mechanism for ensuring the compliance of the industry with dust mitigation practices. Flying squads and inspection teams constituted by the CAQM carry out inspections of C&D project sites, in addition to the inspections conducted by the respective state pollution control boards (SPCBs).
Under the statutory directions of the CAQM, to facilitate remote monitoring of larger C&D projects, all projects in the NCR on plot areas ≥500 square metres are required to register on the respective dedicated web portals in the states of Haryana and Rajasthan and the National Capital Territory (NCT) of Delhi and certify their compliance with various stipulated measures. The project sites also have to be video-fenced to enable.
remote monitoring by inspection agencies through web portals. Such web portals are functional in the NCT and Haryana and are under development in Rajasthan.
The CAQM has further suggested the following measures to ensure compliance with their dust mitigation directives:
Deployment of AQ monitors and video fencing at large construction sites certainly strengthens the environmental compliance monitoring regime, but how the data obtained through such monitoring can be used to regulate activities on site needs further examination.
We conducted a review of regulations and guidelines from other countries, and consulted with international experts in the field, to explore the matter further. This helped in identifying several gaps that need to be addressed to strengthen the compliance regime further
Are the data reported by construction sites credible and comparable?
As highlighted earlier, large construction sites are required to monitor and report AQ levels. However, it is important to note that in the absence of guidance on standardisation processes, the measurements from any two sites will not be comparable. The number and locations of monitors at the site can be standardised as well as the certification requirements for the monitoring equipment used.
For instance, in the United Kingdom, the Environment Agency has established the Monitoring Certification Scheme (MCERTS), which provides comprehensive guidelines on the standards that AQ vendors must adhere to when monitoring emissions that impact the environment. MCERTS encompasses various forms of ambient monitoring equipment, including low-cost AQ sensor systems. Notably, MCERTS mandates rigorous testing of PM measurement instruments, with an extensive focus on data precision and reliability.
India’s central regulatory authority has cautioned against the use of data generated by low-cost monitoring equipment for calculation and public dissemination of the Air Quality Index. But the CPCB has also indicated that SPCBs could use these devices for qualitative assessments of dust generated at building sites. For such assessments, however, standardisation and intercomparability of data should be critical considerations.
What is being compared in terms of data from the construction sites?
The absence of thresholds with respect to the increase in air pollutant levels at building sites leads to challenges in the evaluation and enhancement of regulatory compliance. It is imperative to underscore that welldefined thresholds of exceedance can serve as a benchmark against which the localised AQ impacts of a construction site can be assessed.
For instance, in the United Kingdom, a threshold has been instituted (viz., ~200 micrograms per cubic metre of air), and if this is crossed, the construction site is deemed to impact local AQ. This particular threshold assumes importance as it offers real-time feedback to site operators, thereby enabling them to take remedial measures to control pollutants.
In China, the Environmental Protection Law (2015) regulates construction activity by establishing pollutant emission standards for construction equipment and environmental monitoring. The Environmental Impact Assessment Act, 2003, mandates the environmental impact assessment of construction schedules and projects, identifies their effects, allocates legal liability, and supplementary provisions. The Environmental Protection Bureau has suspended the examination and approval of environmental impact assessment documents of construction projects that are likely to increase the total emissions of key air pollutants in the region.
A threshold for construction sites in India is yet to be established. Without such a threshold, classifying a building site as polluting and clamping down on its activities would be an entirely subjective decision. On the flip side, having such a threshold would help regulatory authorities in isolating polluting sites and roll out targeted directions towards banning their operations.
Who is looking at the data, and for what purpose?
In India, as the regulatory framework for monitoring environmental compliance on construction sites continues to develop, the ongoing monitoring activities being conducted at these sites hold the potential to significantly contribute to the establishment of standardised criteria for determining acceptable limits of environmental exceedance.
The localised impacts of construction activities will vary from site to site, and the data generated from different construction sites can be collected and used to set thresholds for sites falling within different size categories. Once thresholds are in place, local authorities can then use the data to issue alerts to building sites and order a roll-out of tailored preventive measures.
Furthermore, with the data collected, local authorities could assess the effectiveness of the various pollution control measures being implemented on the site and use this information to guide other construction sites on suitable control protocols. For instance, the Seoul Metropolitan Government established installation standards for facilities and measures to control fugitive dust. South Korea’s Construction Machinery Management Act prescribes specific machinery that should be used for construction – similar to the Clean Air Act in the USA (UNDP 2016). While the recent CAQM guidelines provide technological recommendations such as the use of smog guns on construction sites, it does not provide any guidance on the type and emission standards of machinery that is suitable for use for construction activity.
While examining the compliance monitoring mechanisms for construction dust management in India, it becomes evident that the effectiveness of these measures hinges on the deployment of monitors at construction sites. Given the transient nature of construction activities, it is imperative to not only establish monitoring systems but also ensure their ongoing compliance with prescribed methods. Drawing insights from international experiences can shed light on best practices in designing a robust monitoring framework.
Behavioural nudges
In their efforts to improve outcomes for citizens, governments and a number of private organisations have started relying on a more human-centred strategy in recent years. Identifying contextual and environmental elements and utilising them as the basis for solutions is a crucial component of a behavioural approach (Behaviour Insights Team 2022).
In the second part of the current study we aim to address the challenge of improving compliance with targeted clean construction practices by using a ‘softer’, behavioural approach. This entails leveraging behavioural insights to understand how PM emissions resulting from construction activity can be reduced. These insights highlight contextual psychological, environmental, and logistical barriers and facilitators that influence behaviours. This strategy helps researchers analyse people’s actual behaviour rather than just what they claim to be doing and design tailored programmes.
Adopting a behavioural approach helps researchers explore the psychological drivers of clean construction behaviours associated with specific construction activities in unique contexts. Previous research has shown that despite the availability of physical resources, psychological biases impede the adoption of environmentally sound construction practices. For instance, Noh et al., 2018 found that specific measures such as wheel washing, dampening loose soil, and covering materials with tarpaulin sheets can control the release of airborne dust due to vehicle movement during construction. Yet, a number of obstacles, such as a perceived scarcity of time, competing priorities, or certain features of the site layout can prevent the widespread adoption of these practices.
While behaviour control is a widely used strategy to reduce dust emission, workers’ behaviour in relation to dust mitigation has not received much attention in previous research (Kaluarachchi et al., 2021). For instance, workers may be aware of safety equipment such as goggles, gloves, and a protective face mask to reduce their exposure to PM. But whether they adopt such measures depends on factors such as personal knowledge, incentives, prevailing social norms, and other environmental issues.
So far, however, the emphasis has been on finding structural and engineering solutions, with little focus on worker behaviour. The study by Kaluarachchi et al., 2021 shows assigning of responsibilities and awareness of repercussions can positively affect personal norms and, in turn, worker behaviour. They recommend that builders launch programmes that reveal the environmental impacts of pollutants in efforts to change people’s personal norms and encourage pro-social and environmentally responsible behaviours. One of the obstacles to taking action is a lack of knowledge about the negative effects the status quo has on the environment and human health.
As shown in the study by Nij et al. (2003) on dust pollution management, younger construction workers used pollution control measures somewhat more frequently, particularly when it came to protecting the respiratory system. This observed behaviour was connected with workers being aware of the health risks associated with dust inhalation. Since the body of knowledge is always expanding, it’s possible that younger employees are trained to recognise these health issues. The older population, in contrast, might not be as conscious of the problem or might view it differently. Through observations and focus group discussions with construction workers, we have uncovered crucial behavioural insights pertaining to the three components of the Capability, Opportunity, and Motivation – Behaviour Framework (Michie[et al. 2011). These insights serve as the basis for developing individualised, doable, and culturally appropriate interventions.
Even after years of awareness campaigns and laws in support of air pollution mitigation, we find that most people are still unaware of the harmful effects of dust particles in their workplace and the mitigation measures that need to be undertaken. The lack of AQ monitoring data is a major factor contributing to inaction. Furthermore, a number of behavioural influences, including goal setting, physical enablers like money and resources, and contextual motivators affect choices and behaviours. It has been demonstrated that theory-based educational interventions are successful in changing behaviours in a variety of health-related areas (Shoesmith et al. 2022; Willmott et al. 2021).
In this study we use relevant behavioural change frameworks to analyse the factors impacting the uptake of ‘clean construction’ behaviours and pilot tailored interventions for various target groups at active construction sites. Our preliminary behavioural assessment suggests that workers are generally unaware of the risks associated with PM exposure and are not very motivated to take proactive steps. The gap begins with the absence of reliable data. This study created an engagement platform to close the awareness and knowledge gaps among contracted and on-site workers and promoted specific high-impact clean construction behaviours. Some of the most relevant behaviour change techniques were utilised to design the interventions. They are described as part of the Behaviour Change Wheel process by Michie, Atkins, and West (2014). They include stressing the negative consequences of air pollution on health and the environment, describing the health effects, providing training, and other intervention techniques.
This issue brief serves as an introduction to our multipart series on the control and mitigation of pollution resulting from building projects. In the next releases, we will explore possible on-site behavioural approaches and do a thorough cost–benefit analysis of these interventions. In this paper, the discussion is confined to improving the AQ-monitoring protocols used at building sites.
Dust and PM generated during different construction activities, including excavation, demolition, and building, can contribute to local air pollution, affecting nearby communities and ecosystems. As indicated earlier, monitoring compliance with existing rules and establishing guidelines for construction dust management are essential to reduce pollutant concentrations in and around a site. The C&D rules and recent Delhi Pollution Control Committee guidelines (Monitoring and Dust mitigation measures, DPCC) refer to the importance of monitoring AQ at construction sites.
Construction companies are increasingly expected to be socially responsible and transparent in their operations. Arranging for AQ-monitoring systems to be installed at the site demonstrates a commitment to environmental stewardship and accountability in reducing the sector’s contribution to air pollution. It also allows related stakeholders, including workers at the site and people living nearby, to stay informed about potential risks and mitigation actions. Despite the recognition of the importance of AQ monitoring, currently, there are no specific guidelines on how it should be done. There is also a dearth of guidance, in the Indian context, on how the data obtained can be used to regulate activities at the site.
Designing monitoring protocols for construction sites is challenging as emissions from these sites may vary depending on meteorological conditions, geographical conditions, seasonal changes, soil texture, the stage of construction work, and activity levels at the construction site (Azarmi, Kumar, and Mulheron 2014; Luo et al. 2021). Given the complexity of the C&D activities carried out in various phases of construction work, tracking activity levels in real time is challenging. The distance between the PM monitor and the activity is also important ((IAQM 2018)). Furthermore, the same protocol may not be applicable to all sites. Therefore, there is a need to establish protocols to monitor construction sites in order to ensure that
Through this study, we provide developers and policymakers with detailed instructions on how to monitor AQ at construction sites (including all types of C&D activities). The monitoring regime may be a separate document (potentially covering additional environmental impacts such as noise), or it may be included in an AQ assessment or EIA for construction sites.
Designing a monitoring network for a construction site requires careful planning and review of the site plan, the construction plan, and land use information of the surroundings. To understand the existing approaches to monitoring AQ at the building site, we carried out a systematic review of articles published between 2015 and 2022 by searching for keywords including ‘monitoring strategy’, ‘monitoring network’, ‘air pollution and health impacts of constructions’, ‘exposure estimation of construction labourers’, ‘pollutant concentrations during different construction activities’, and ‘construction-related air pollution’ in databases such as PubMed, Scopus, and Google Scholar.
Table 1 summarises the approaches identified from the review and it suggests that regulation of construction activities using data from real-time monitoring stations is relatively unexplored in the scientific literature. There are also some other studies (Cao et al., 2016; Luo et al., 2021, Kalavakonda et al., 2021; Moraes et al., 2016) that estimate the pollution levels at the construction site by measuring the emissions of different types of heavy equipment, using instrument-specific emission factors or using information on the fuels used by different construction equipment.
While the studies listed in Table 1 identified and executed various methodologies for monitoring AQ at construction sites, none of them proposed a network design for regulating activities at the construction site. For example, the deployment of any active or passive AQ monitor should always be accompanied by real-time data transfer and/or cloud storage to analyse emission patterns. Alternatively, quantifying emissions using emission factors ignores the impacts of meteorology and other local or regional sources of pollutants. As a result, there is very little room to apportion the impacts of nearby sources. Further, the idea of installing monitors to estimate exposure to air pollutants has frequently been criticised (Azami et al., 2014; Milivojevi� et al., 2023) for its lack of representativeness in terms of study design and sample size estimation.
In the subsequent sections of this study, we utilise this understanding to develop ways in which AQ monitoring can be used to regulate construction activities on site, thereby reducing the environmental footprint of this sector. Furthermore, this approach also considers capturing the impact of all construction activities at the site, thus allowing for the isolation of pollutantintensive activities.
| Objective | Strategy | Source |
|---|---|---|
| Measuring PM levels at construction sites |
|
Faber, Drewnick, and Borrmann (2015), Araújo, Costa, and Moraes (2014), and Azarmi, Kumar, and Mulheron (2014) |
| Monitoring spatio-temporal variations in PM levels at the site through a real-time monitoring network |
|
Kang et al. (2021) and Hong et al. (2021) |
| Estimating the exposure of construction workers at the site |
|
Luo et al. (2021), Kalavakonda et al. (2021), and Yoon, Won, and Chi (2023) |
Source: Authors' analysis
Designing an ambient AQ-monitoring network is pivotal to controlling pollution from construction activities. This requires the consideration of contextual data related to emission sources and pollutant categories, historical AQ levels, demographic and health statistics, topographical influences, local disturbances, meteorological influences, site accessibility analysis, and the designated monitoring timeline. Determining the optimal number of monitoring stations and their strategic placement hinge upon a multifaceted set of variables – including topographical features, local meteorological patterns (wind direction, speed, mixing height, and temperature), the distribution and magnitude of pollution sources (industrial facilities and vehicular emissions), pollutant concentrations, population density – as well as the overarching objectives of the AQ-monitoring initiative and available resources.
Our comprehensive assessment underscores the need to consider of the following key factors while setting up a monitoring network at the construction site:
However, there may be concerns about maximising the uptime of these monitors while deployed at the site which is essentially a function of airflow near the inlet, equipment design, inference from humidity, or secondary PM for optical instruments (IAQM 2018). The instrument should be supported by regular servicing (as recommended by the manufacturer), cleaning and calibration, and frequent data download to ensure that it is working properly (Kang et al. 2022). Furthermore, trained resources should be available at the site for additional maintenance of the device, including electrical or mechanical work.
Steps for building a monitoring framework
The following steps should be followed for establishing a monitoring network:
Assigning more monitors to the site will improve data reliability. However, it might also result in additional overheads and an increase in the quantity of data to be analysed. In that case, given the high dust load at the site, the monitors should be frequently calibrated to ensure accuracy (Feenstra et al. 2019).
As the respective SPCBs or pollution control committees mandate deploying reliable low-cost AQ monitors at construction sites, we propose deploying an AQmonitoring network at sites. Previous studies that have measured air pollutants at construction sites provide evidence for the applicability of low-cost sensors at consideration sites (Cheriyan and Choi 2020; Guinta 2023; Kortoçi et al. 2022; Priyanaka et al. 2022). Based on our review, and the key considerations laid down earlier, we suggest that an ambient air quality (AAQ)- monitoring network requires the installation of monitors in adequate numbers in suitable positions.
We recommend three different approaches suggested for deploying sensors to create an AQ-monitoring network at the construction site. They are designed to serve specific research objectives, including calculating activity-specific PM concentrations, evaluating the impact of construction activities on upwind and downwind areas, and estimating the risk of exposure of people working at the site or staying in the surrounding areas/localities.
Fencing method approach
In this type of network, the monitors are mostly placed on the fences of the construction site and are supported by one AWS to collect meteorological information. The weather data (primarily observations of wind speed and direction) can help determine the predominant upwind and downwind directions of the site (Figure 1). Based on the difference in PM concentration between the sensors in the upwind and downwind directions, the contribution of the construction activity to overall air pollution can be measured (London Plan 2016). Thus, this type of network can help identify the contributions of construction sites to the overall AQ at the local/regional level. Hence, the potential impacts of construction as a source of urban air pollution can be measured. This method is potentially most suitable for larger sites. It is likely to be acceptable to both builders as well as policymakers and can help them formulate prospective mitigation strategies for improving the local/ regional AQ. However, this approach will not be effective in estimating activity-specific emissions. Thus, it cannot be used to identify pollutant-emitting construction activities so that they can be regulated.
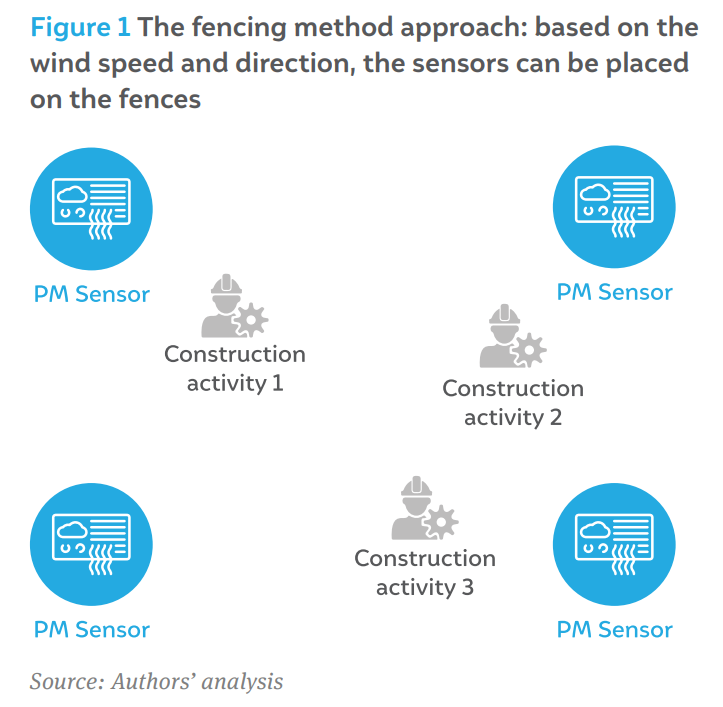
For builders, this type of monitoring network would be more economical, as it requires a smaller number of AQ monitors. The number of monitors required at any site should be decided based on the size of the construction site. In Seoul, Faber, Drewnick, and Borrmann (2015) adopted this approach to study the impact of construction activities on AQ; they concluded that construction activities contributed around 40 per cent of the PM10 level in this area. This method may be particularly useful if the regulator intends to isolate construction sites that are significantly impacting the local AQ.
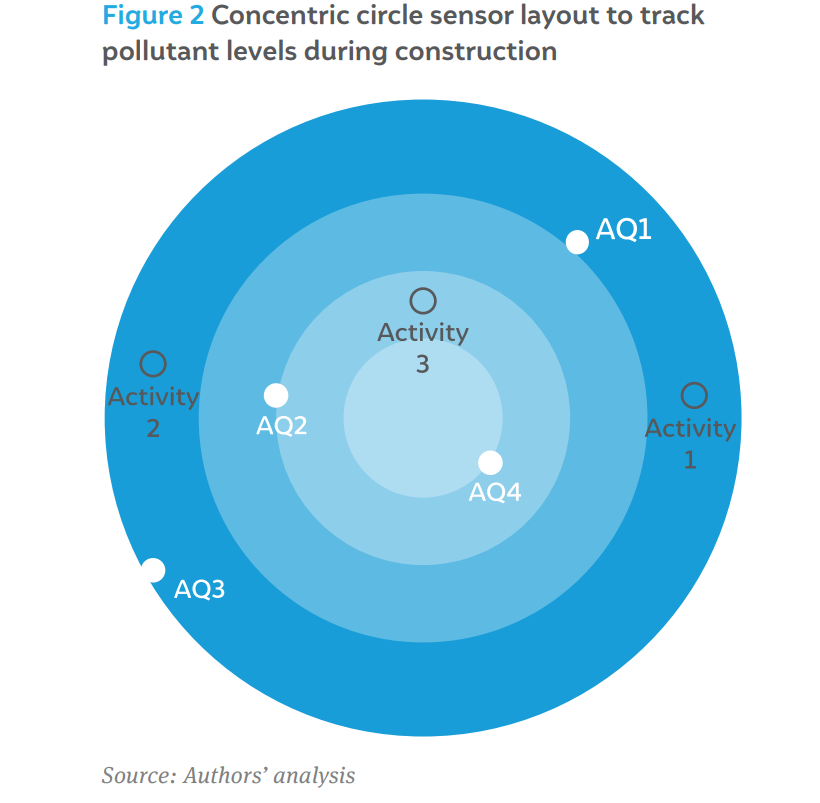
Concentric circle approach
In this approach, the site is marked with concentric circles that expand by 50–100 metres in radius (Figure 2). The AQ monitors are typically placed on the circles to capture the nearby activity. The concentric circle approach is used to identify polluting construction activities (Ajuro et al. 2022).
This is the most efficient and robust method for estimating activity-specific pollutant concentrations. The findings could help in imposing activity-specific construction bans during poor AQ days. Previous studies by Araújo and Costa (2022) and Yoon, Won, and Chi (2023) support this approach. To identify the optimal monitoring points, the location of the site and its layout must be considered.
As larger construction sites (>20,000 square metres) may require several AQ monitors to implement the concentric-circle approach, this type of monitoring network may not be economical and, hence, may be less appealing to builders. However, due to the robustness of this approach, it can be used to generate activityspecific pollutant information at small or medium-sized construction sites (<20,000 square metres). Hence, scientific policy researchers may find this method helpful for identifying highly polluting construction activities that can be restricted during poor AQ days. This method may be particularly relevant in the context of arguments against a blanket ban on construction activities. If the regulator intends to isolate and ban specific polluting activities, then this monitoring strategy would be ideal. Also, this type of monitoring network is perfect for mixed-use development projects with multiple buildings in different stages of construction.
Land use approach
While the fencing and concentric circle approaches are beneficial for quantifying the impacts of construction activities on the surrounding environment and population, the differential impacts of different land uses on the site or at the regional scale can be measured by the land use. This approach is useful for smaller construction sites in the central city areas or in places with mixed land uses.
If a construction site is surrounded by areas with different land uses (e.g., commercial and residential), in this approach, the monitors should be deployed such that they face the areas with different land uses. Supported by an analysis of the wind patterns, this approach would be able to quantify the pollutants infiltrated or exfiltrated at the site (Construction monitoring, Oizom)
This would ultimately be helpful in estimating the shortor long-term exposure of the people working at the site and those staying or spending most of their time in the surrounding areas. This method will be particularly useful in the in the densely populated areas of the city, where during construction, related measures can be taken to reduce the air pollution burden of the people staying in or near those sites.
Along with monitoring the AQ at the site, this approach should be supported by concurrent AQ measurement at a background site. This would help quantify the pollutant levels at the local or regional level and thus aid in evaluating the contribution of C&D activities to air pollution.
Siting of the monitors
Monitoring sites for a longer duration frequently leads to uncertainty about the findings due to the replacement or relocation of monitors. Because most construction activities extend across many phases of development, monitors may be frequently replaced or relocated instead of having them mounted permanently in the same positions. However, this has potential advantages and downsides.
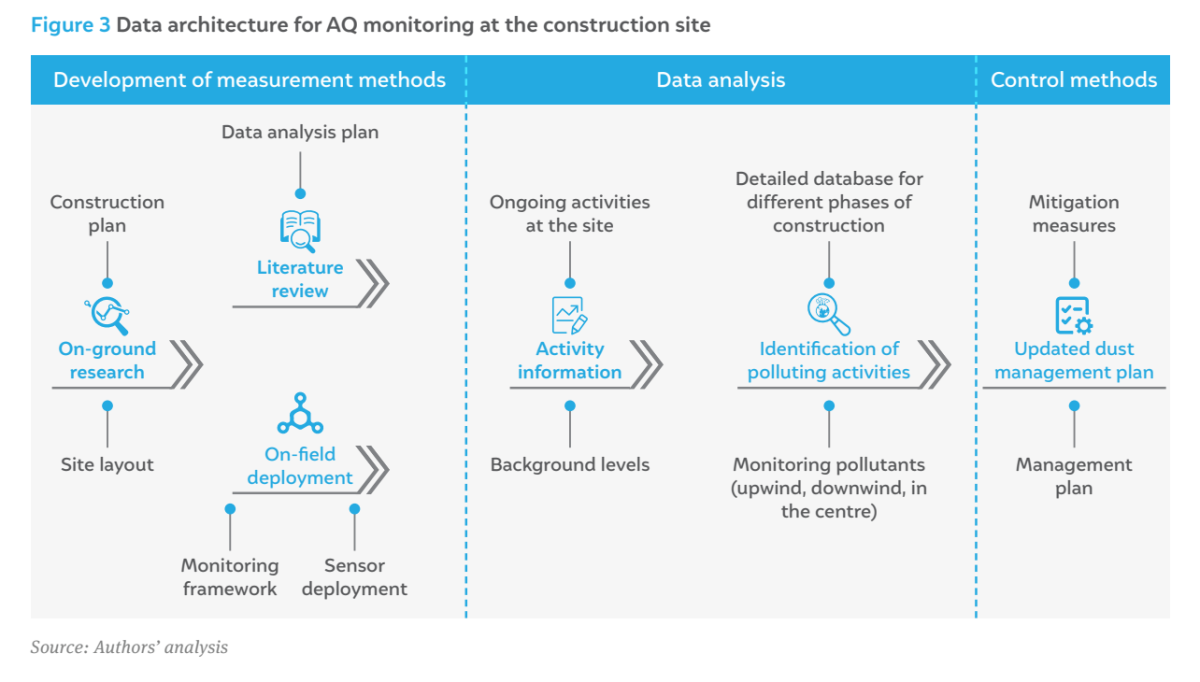
Once the AQ monitors have been deployed using one of the monitoring strategies outlined in the previous section, the data collected can be utilised to manage AQ and reduce the sector’s contribution to urban air PM concentrations.
By combining meteorological data with AQ-monitoring data, AQ models can be improved or created to predict pollutant levels, assess the impact of different sources of pollution, and help implement effective pollution control measures. Meteorological data – wind speed and direction, assessments of atmospheric stability, such as temperature inversions, or washing out of pollutants due to precipitation – are particularly useful in predicting the transport of air pollutants. This information can also be used to issue AQ forecasts and warnings, so that site workers or supervisors can reschedule pollutant-emitting activities and take necessary precautions during poor AQ days. Furthermore, the AQ information from the site can be used in two ways: first, by informing the project developer regarding conditions at the site, and, second, by integrating the information into the construction schedule. The data from the AQ monitors could help in assessing the baseline levels of pollutants, analysing trends, showcasing the project’s environmental performance, and demonstrating compliance. This would enable builders to use site specific, data-backed strategies to develop and enforce dust mitigation plans in a timely and efficient way (Figure 3).
There are cases where frontier cities have used air pollutant data as a tool to encourage construction sites to self-regulate. For example, large-scale projects in Wembley Park, London’s low-emission zone, were managed by monitoring on-site AQ (Aeroqual 2017). More than 100 dust monitors have been deployed in the Greater London area, largely to monitor C&D projects. Data from the monitors are sent to the cloud, where they are combined with other information (e.g., on noise and vibrations). The monitors provide data on demand, respond to exceedances, and minimise dust emissions before they have an impact on people or the environment by using live data and warning systems. Similarly, in Saudi Arabia, Freyssinet Saudi Arabia Co. Ltd (FSAC) deployed AQ monitors to protect its workers at one of its construction sites near a high-traffic zone in Riyadh (Construction site monitoring, Oizom 2022). The developers recorded air pollutant information alongside meteorological data to detect sources of pollution, analysed the data using cloud computing software, created historical trend reports, and developed alert modules to notify workers of any potential threat to their health so that appropriate preventive measures can be implemented.
Monitoring building sites is also useful for improving control methods and apportioning the impacts of local and regional sources of pollution. In London, for example, Barts Health National Health Service Trust (London) highlighted their concerns about patient care and health during the demolition of their previous building (IAQM 2022). A monitoring protocol was put in place to provide the requisite proof that the mitigation measures had been successful. The analysis helped in developing a threshold beyond which the work would be stopped and subsequent inquiries were made to develop an alert mechanism.
In another location in London, a monitoring network was established on a larger construction site (London Plan 2016). Vegetated screens were installed to assist in the trapping of PM and provide aesthetic benefits. However, after thorough monitoring and assessment, it was recommended that the site managers consider the targeted application of dust suppression equipment as the screen alone was not enough to prevent resuspension due to the frequent movement of heavy vehicles.
Recently in Paris, monitoring of various government building sites has been introduced to protect employees and residents in the neighbourhood. For example, Parisian authorities demanded that continuous realtime PM monitors be installed at each site throughout the development of The Grand Paris Express, Europe’s greatest metro traversing an urban region (Envirotech 2021). Monitors were placed around the perimeter of each site to estimate the amount of dust particles exiting the site. Each monitor has telemetry and mobile connectivity so that the data can be uploaded onto a cloud monitoring platform and readily accessed and shared with stakeholders. Furthermore, depending on the threshold, a variety of notifications can be generated. For example, the site manager can be notified if the dust concentration level reaches 150 micrograms per cubic metre of air on average over 15 minutes. Such signals will allow site managers to respond quickly and effectively to lower dust levels.
While several policies and regulations mandate the installation of AQ monitors at construction sites, the monitoring framework is neither uniform nor standardised across all sites. This brief is the first to highlight the issue and suggests how the data from the AQ monitors at the construction sites has been used in to increase compliance earlier. Specific recommendations for academic studies, policy research, and building projects could further strengthen the impact of this study. However, the proposed framework is limited to building sites and may not be fully applicable to other types of infrastructure, such as roads and flyovers. Nevertheless, because of the ever-increasing number of building projects in urban areas, this study makes a significant and impactful contribution to the existing literature.
Construction activities have been shown to have a negative impact on AQ and public health. However, the negative effects of construction work on the environment and on human health can be reduced by adopting appropriate dust mitigation measures. There are multiple laws that offer guidance on how pollution and waste from construction activities can be managed. These initiatives have the potential to improve the selfregulation of pollution by project developers.
While the existing regulation on AQ monitoring at the construction site has mandated the use of web-portal, it would be prudent for policymakers to envision how the reported data can be used to further strengthen pollution regulation at construction sites. There are multiple ways in which such data can be used – from setting thresholds of exceedance for pollution around construction sites, to developing a centralised alert system based on pollution exceedances, to informing random inspections at sites. Strategic use of data will be critical to ensure that the increasing pollution from C&D activities in India is properly managed.
Construction activities, particularly in the NCR, are greatly affected by bans on construction during the winter months. While there is limited evidence on the success of these bans in reducing pollution levels in the city, they cause significant losses to project developers. The Confederation of Real Estate Developers’ Associations of India estimates that in addition to project delays, these bans can increase the cost of projects by two to three per cent. While the ‘polluter pays’ principle should apply to construction sites violating guidelines on dust management, project developers who are willing to implement environmental safeguards at their construction sites should not have to suffer the consequences of the ban.
Isolating polluting sites and targeted bans on construction activities can only be rolled out if there are credible data backing such decisions. Data credibility can be ensured only by establishing consistency in the methods by which sites are monitored. This study suggests ways in which this consistency can be achieved – by implementing a pre-defined monitoring protocol that can be incorporated with official guidelines for dust mitigation. Enforcing compliance through enhanced monitoring is one way to improve the rate of adoption of clean construction practices. However, it is also important that project developers, engineers, site supervisors, and labourers understand how their individual efforts contribute to better AQ, as it will ensure sustained adoption of mitigation measures to reduce pollution from construction activities.
The recommendations in this publication, particularly the land use–based monitoring strategy and behavioural interventions described earlier, are being carried out as an ongoing pilot in an active construction site. The observations from this pilot will be shared in our subsequent publications.
Exposure to construction dust is linked to severe health problems, including cardiovascular and respiratory diseases, chronic obstructive pulmonary disease, lung cancer, and silicosis.
Yes, India has a diverse legislative framework including the Environment Protection Act, 1986 (with EIA Notifications and 2018 amendments), the National Building Code, 2016, the Construction and Demolition Waste Management Rules, 2016, and the Solid Waste Management Rules, 201615.... Additionally, bodies like the CAQM issue statutory directions.
Key gaps include a lack of clarity on which monitoring technologies to use, where and how to install monitors, how to utilise the collected data effectively, and the absence of standardised pollution thresholds for construction sites.
Yes, India has a diverse legislative framework including the Environment Protection Act, 1986 (with EIA Notifications and 2018 amendments), the National Building Code, 2016, the Construction and Demolition Waste Management Rules, 2016, and the Solid Waste Management Rules, 2016-15. Additionally, bodies like the CAQM issue statutory directions.
AQ data, combined with meteorological data, can be used to predict pollutant levels, identify polluting activities, inform mitigation strategies, integrate into construction schedules, issue alerts for high pollution events, and support targeted regulatory actions and bans.
Establishing pollution thresholds is essential to differentiate the impact of construction activities from other pollution sources, assess the localised air quality impact, identify non-compliant sites, and enable timely, targeted regulatory responses based on data.
Yes, the study explores the potential of behavioural insights and interventions to improve compliance with clean construction practices among workers and site managers, noting that a lack of awareness, environmental conditions and motivation can be barriers.

Behaviour Change Approaches to Tackle Stubble Burning at Scale

Organic Waste Circular Economy for Viksit Bharat
How Can India Tackle Air Pollution with an Airshed-level Approach?
Roadmap of the methodology to assess the climate co-benefits of the SUP ban in Tamil Nadu

Roadmap of the methodology to assess the climate co-benefits of the SUP ban in Maharashtra