


Suggested Citation: Jalan, Ishita and Hem H. Dholakia. 2019. What is Polluting Delhi’s Air? Understanding Uncertainties in Emissions Inventory. New Delhi: Council on Energy, Environment and Water.
Fixing Delhi's air quality requires a deep understanding of the sources that contribute to air pollution. Despite multiple source apportionment studies specific to Delhi NCR, policymakers can’t design an effective action plan due to varying estimates. This study brings clarity on the existent discrepancies and attempts to understand the gaps and opportunities to develop emissions inventory for source apportionment studies.
Our study focuses on five emission inventory studies (CPCB 2010; IIT Kanpur 2015; TERI 2018; SAFAR 2018; Guttikunda 2018) on Delhi NCR. It draws comparisons between emissions inventories for ten sources of air pollution for PM10 and PM2.5.
Sector-wise contribution to PM2.5 (%)
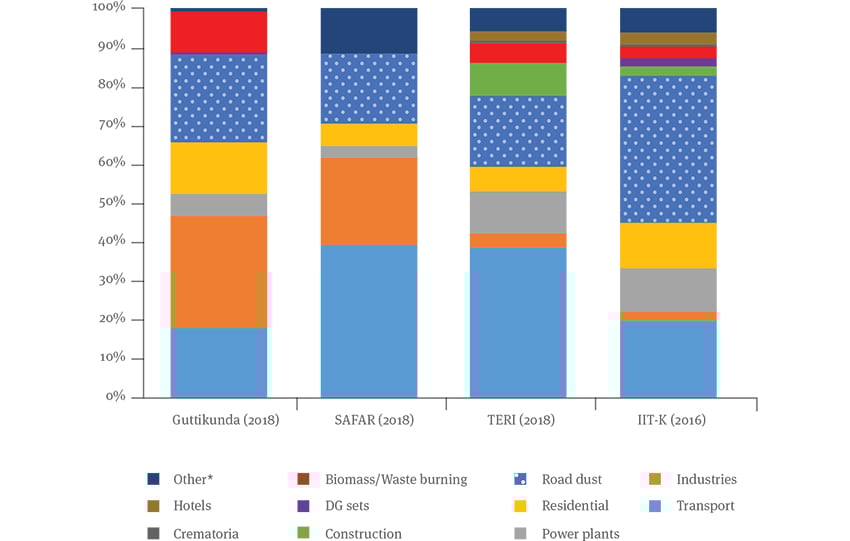
Source: CEEW analysis, 2019
Sector-wise contribution to PM10 (%)

Source: CEEW analysis, 2019
Why Do Emissions Inventories Currently Vary?
In India, every year, air pollution causes 1.24 million deaths. In Indian cities, most of the year, the average concentration of particulate matter (PM) exceeds Central Pollution Control Board (CPCB) standards. Making decisions on mitigation and control requires an understanding of air pollution sources. Source apportionment estimates the contribution of each source.
The process uses two methodologies - top-down and bottom-up. The two methodologies complement each other in cross-checking and validating the source apportionment analysis; therefore, it is advised to use both for a region. Delhi is popular in the narrative of air pollution, and it has been covered extensively by source apportionment studies (CPCB 2010; IIT Kanpur 2016; TERI 2018; SAFAR 2018; Guttikunda 2018).
These studies have played an instrumental role in describing the variety of sources that contribute to air pollution in Delhi and the National Capital Region (NCR), but their estimates differ significantly. Given that source apportionment information guides pollution mitigation policy and actions, differences can make the determination of exact sources uncertain and air quality improvement measures ineffective.
By comparing the existing emissions inventories for Delhi or NCR, this study aims to explain the differences in these estimates. To detail these differences, we focus on PM10 and PM2.5 in transport, industries, power plants, road dust, and construction - the five major contributing sectors. An emissions inventory uses the bottom-up method and forms the basis for a source apportionment study. A dispersion model is used to calculate the distribution of pollution using the emissions inventory and meteorological data as input parameters.
The biggest contributor of PM2.5 is the transport sector; its contribution ranges from 17.9 per cent to 39.2 per cent. Road dust is the second largest source of PM2.5; it contributes between 18.1 per cent and 37.8 per cent. It also contributes 35.6 per cent to 65.9 per cent of PM10 as the largest source. Similar trends exist for other sectors. The differences are due to each study’s domain area; year; sampling season chosen; and methodologies of sampling, estimation, and emissions factors. These factors explain the discrepancies only partially, however; emissions inventories are different for other, unexplained reasons.
To improve the understanding of air pollution and formulation of policy, several changes are necessary. Information on sampling frame and sample details needs to be transparent. Uncertainty should be quantified to explain the spread of observations for a sector. Multipleyear inventories would capture the dynamic nature of air pollution and enable accurate, realtime information. Common regulatory guidelines would help in building robust inventories. Source apportionment based on emissions inventories and dispersion modelling should be reconciled with receptor modelling to enable convergence between the modelling and measurement approaches.
In comparing various emissions inventories of air pollutants for Delhi and the NCR, this study finds significant differences in their estimates of total pollutant load and, especially, sectoral emissions.
To improve air quality, we need to design effective emissions inventories and, in turn, harmonise the inventories. To create better emissions inventories, we need to improve data transparency, quantify uncertainties, develop multiple-year inventories, common guidelines, and reconcile the top-down and bottom-up methods.
We can infer that differences in studies result from activity data or emissions factors, but we need transparent data to understand the reasons for discrepancies. In the transport sector, inventory depends on the number of on-road vehicles, their age distribution, fuel type, and VKT. Because there is no common database, studies rely on primary data collection efforts.
The study surveys were carried out across several locations - 72 locations for the TERI (2018) study and 87 locations for the SAFAR (2018) study - but it is unclear whether these constitute a representative sample. If the studies used a purposive sampling approach, it may introduce a bias; and it may not be appropriate to generalise their findings to the NCR. This lack of transparency and information in sampling frame and sample details is common to all sectors and studies.
There are two sets of uncertainties. The first arises from activity data such as fuel consumption and efficiency of pollution control equipment. The second set of uncertainties can be attributed to emissions factors, even though most of these are determined based on controlled experiments. When considered together, the uncertainties can compound.
Uncertainties for PM2.5 may be as high as 86 per cent for the power sector, 201 per cent for industry, 94 per cent for road transport, and 259 per cent for the domestic sector; for the entire inventory, overall uncertainty may be as high as 145 per cent (Kurokawa et al. 2013).
However, no study except Guttikunda (2018) provides standard deviations for inventory estimates. This makes it difficult to gauge the spread and confidence levels for each parameter. Therefore, authors need to quantify the uncertainty in their studies.
Air pollution is dynamic in nature. As policies to control different sources are put in place, the total pollution level changes, as does the relative contribution of different sources. Developing multi-year inventories helps pollution control agencies identify pollution sources and design control responses accurately and on time. Further, continual emissions monitoring systems that measure pollutant loads in the industrial and power sectors are more accurate than a bottom-up calculation based on fuel use.
This comparison posits, and we argue here, that an emissions inventory needs to be continually updated. However, each of the studies considered here developed an emissions inventory for a single year. Therefore, we recommend that ministries and academic/research groups collaborate to build an ongoing, long-term emissions inventory that is updated every 1-3 years.
The USEPA lays down guidelines for state and local agencies to collect comprehensive and detailed estimates of pollutants and develop a single, common National Emissions Inventory. In India, however, the CPCB does not offer similar guidelines or directives. Therefore, several uncertainties arise in inventory development, and studies become difficult to compare. There is a need to develop inventories and carry out source apportionment studies across India.
There is a need to better reconcile source apportionment based on emissions inventories and dispersion modelling with receptor modelling (Pant et al., 2012) and, thereby, bring about convergence between the modelling and measurement approaches.

Assessing Effectiveness of India’s Industrial Emission Monitoring Systems

Catalysing Local Action for Clean Air
Best Practices in CEM (Continuous Emission Monitoring)
What is Polluting India’s Air? The Need for an Official Air Pollution Emissions Database