Council on Energy, Environment and Water Integrated | International | Independent
Suggested citation: Kurinji, L. S, Adeel Khan, and Tanushree Ganguly. 2021. Bending Delhi’s Pollution Curve: Learnings from 2020 to Improve 2021. New Delhi: Council on Energy, Environment and Water.
The study intends to support the Delhi government, the Central Pollution Control Board (CPCB), and the Delhi Pollution Control Committee (DPCC) in identifying priority areas of interventions needed in controlling air pollution in Delhi during the winter season of 2021. It establishes the primary drivers of Delhi's winter air pollution during the different phases of the season. It considers meteorological parameters, source activity levels, and its contributions to investigate how winter 2020 was, if at all, different in the pandemic circumstances compared to the previous years.
Key Highlights
Delhi is among the most polluted cities in the world (IQ Air 2021). In 2019 alone, air pollution caused over 17,000 premature deaths and an economic loss of 1,207 million USD in the national capital (Pandey et al. 2021). With regards to air quality, 2020 was an aberration. The pandemic-induced lockdown measures provided temporary respite from the year-round poor air quality.
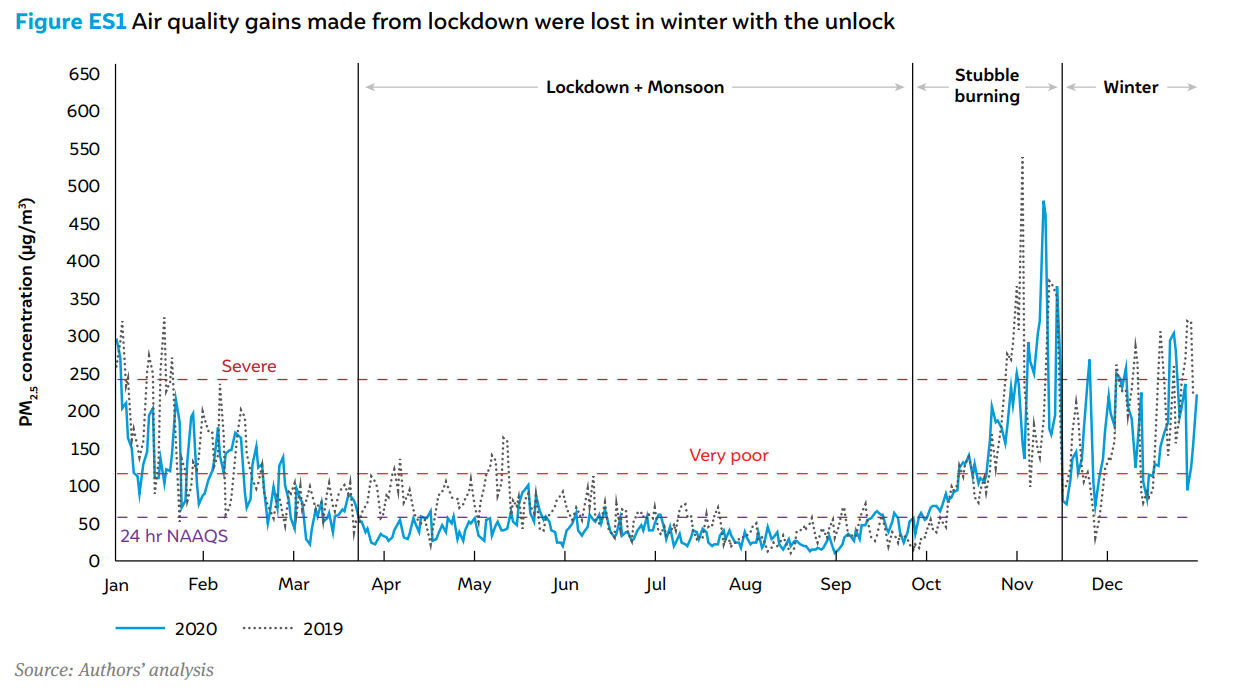
Barring a few days in April and May, Delhi experienced National Ambient Air Quality Standard (NAAQS)1 compliant air quality on most days during the lockdown. Yet, the annual average PM2.5 concentration in 2020 was 93 µg/m3, which is more than twice the permissible limit for PM2.5 in India. Despite low activity levels for close to eight months (March to November) in 2020, Delhi residents were exposed to NAAQS non-compliant air for more than half of the year (Figure ES1).
While the NAAQS non-compliant air quality in Delhi is not a new phenomenon, the winter of 2020 witnessed proactive measures from the State Government in the wake of COVID and evidence pointing at the association between high air pollution and COVID mortality (Petroni et al. 2020; Cole, Ozgen, and Strobl 2020; Wu et al. 2020). This includes the Yuddh Pradushan Ke Virudh (war against pollution) campaign and a seven-point action plan to combat air pollution in Delhi which listed measures ranging from combating dust and mitigating hotspots to a mobile application called Green Delhi for complaints and a ‘war room’ for monitoring air pollution control activities (PTI 2020a). Similar to 2019, the Graded Response Action Plan (GRAP), also came into force on 15th October 2020 and the Environmental Pollution Control Authority (EPCA)2 oversaw its implementation until the announcement of its dissolution on 28th October 2020 (Koshy 2020; EPCA 2020). However, despite these measures, the PM2.5 levels remained almost three times higher than the NAAQS on an average between October 2020 and January 2021. We also observe that PM2.5 levels in winter 2020 were higher than those in 2019. To explain this end, we analyse meteorological parameters, source activity levels, and contributions to establish primary drivers of pollution during different phases of the winter season. Through this brief, we intend to help the Delhi government, the Central Pollution Control Board (CPCB) and the Delhi Pollution Control Committee (DPCC) to identify priority areas of intervention for the year 2021. We summarise key highlights as follows
Delhi observed 92 severe and very poor air quality days in the winter of 2020 compared to 80 such days in 2019. Compared to an average PM2.5 concentration of 161 μg/m3 in 2019, between October and November 2020, this value was 172 μg/m3. It further shot up to an average level of 192 μg/m3 in the period between December 2020 to January 2021 compared to 178 μg/m3 during the same period previous year.
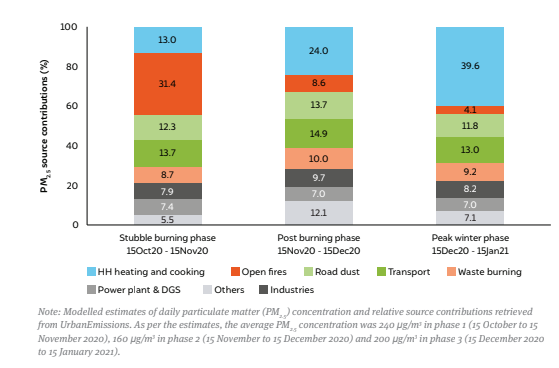
Modelled source contribution estimates of particulate matter (PM2.5) by UrbanEmissions suggest that relative contribution from farm fires was the highest (~30 per cent) in the period between 15 October and 15 November 2020 (Figure ES2). We find that compared to the stubble burning period in 2019, a longer harvesting season in 2020 led to a significant increase in the number of fires. In the following months, contribution from household emissions (including domestic cooking, space heating, water heating, and lighting) primarily drove poor air quality in Delhi. It is worth highlighting that these values are modelled estimates and are subject to the sector-specific assumptions used in the model.
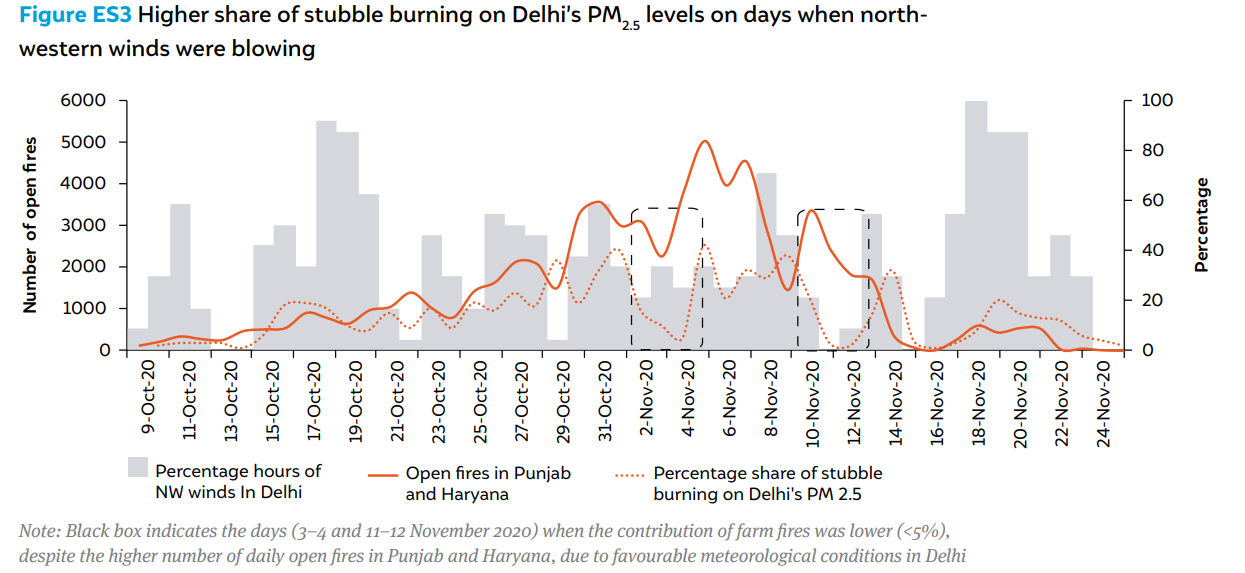
The stubble burning phase (15 October to 15 November) in 2020 experienced 172 hours (70 per cent higher) of calm and light winds (<5 km/h) compared to 101 hours in 2019. Winds predominantly from the north-west direction facilitated the transport of smoke emanating from farm fires and calm winds in Delhi further intensified its adverse impact on air quality. Interestingly, for brief periods in the season, even when high fire counts were reported in Punjab and Haryana, Delhi’s air quality was not affected due to favourable meteorological conditions (Easterly and southerly winds) (Figure ES3). Unfavourable meteorological conditions include low wind speeds and shallow mixing height height3 .
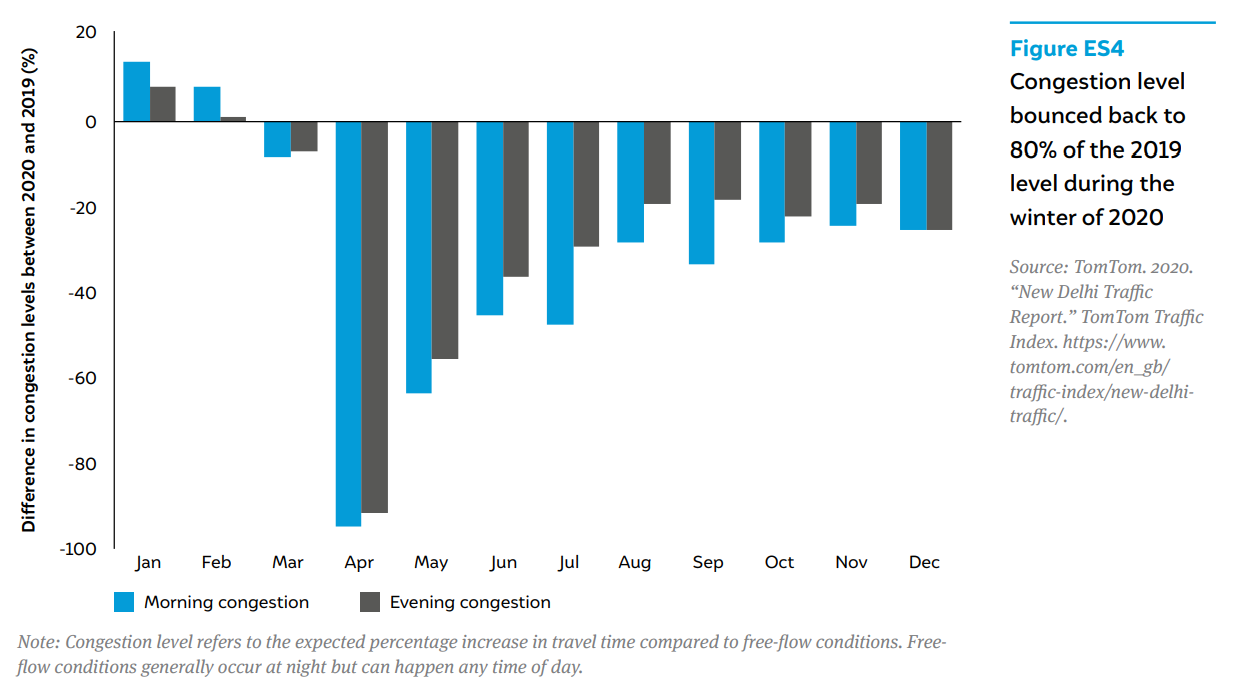
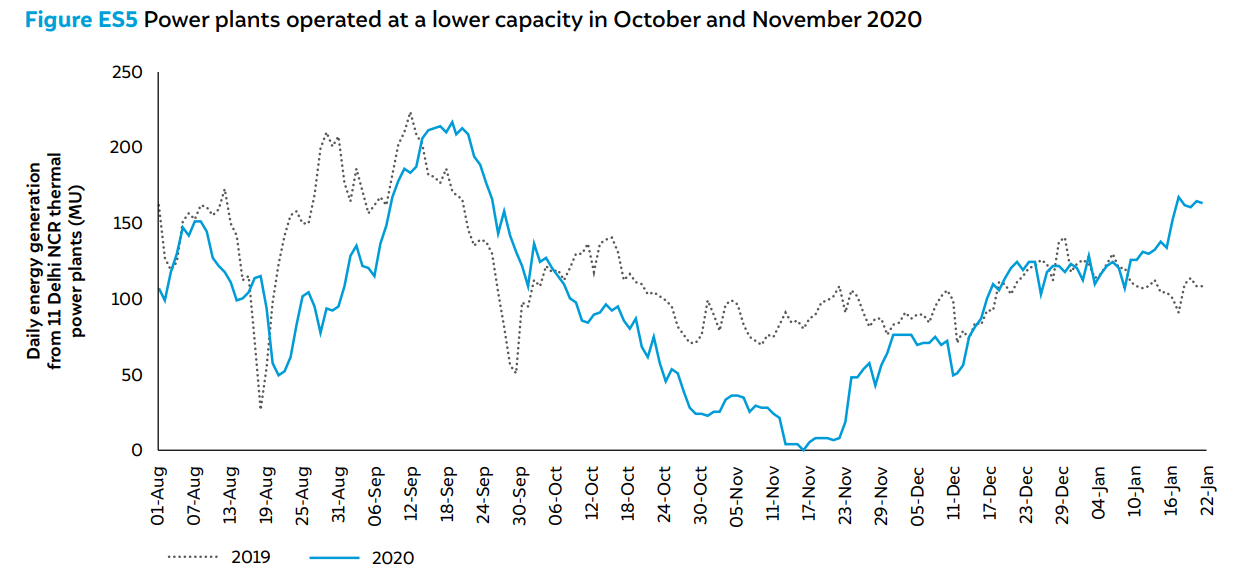
While Delhi’s average PM2.5 concentration during the stubble burning period (October’20 and November’20) was 172 µg/m3, it increased to 192 µg/m3 during peak winter (December’20 and January’21). The higher PM2.5 levels in December 2020 and January 2021 were primarily caused by locally emitted pollutants and added burden of household emissions from space heating. Activity levels were low at the start of the season, but most activities, including vehicular traffic and power generation, bounced back to the previous year’s levels (proxied by indicators such as congestion and electricity generation levels in Figures ES4 and ES5) as the season progressed.
“I see skies so blue and clouds so white … What a wonderful world,” wrote Bob Thiele and George David Weiss in 1967. I t took a pandemic and complete shutdown of activities for blue skies and white clouds to appear in Delhi. This respite from year-round air pollution was short-lived and the gains from cessation of activities were lost with the unlock of economic activities and the arrival of winter in Delhi. Despite the reduced activity levels for close to eight months (March to November) in 2020, Delhi residents were exposed to NAAQS non-compliant air for more than half of the year. Our analysis compared the anthropogenic activity levels and meteorological conditions in 2020 with those in 2019. We also explain how these factors influenced air quality in the winter of 2020. We find that air quality in the winter of 2020 was worse than in the winter of 2019. Lower vehicular congestion and power generation levels in October and November 2020 are indicative of reduced emissions from these two activities. A relatively longer stubble burning period, colder and drier winter conditions, and calmer winds in October and November 2020 were primarily responsible for the worsening Delhi’s air quality that year. As the winter season progressed, most anthropogenic activities such as power generation and vehicular levels bounced back to previous year’s levels. Household heating and cooking contributed to a significant share (40 per cent) to the pollution burden in December 2020 and January 2021. We stress that the interplay of meteorological conditions on Delhi’s air quality cannot be discounted, but there is need for steeper cuts in emissions across sectors. The GRAP presents the state government with an opportunity to constitute an air quality forecasting cell that can advise the government to take necessary measures to prevent severe air quality episodes in the capital city. We recommend that in addition to supporting source identification studies, the government should also encourage air quality modelling and forecasting efforts. Augmenting the existing monitoring infrastructure would help air quality modellers validate their forecasts. The state government and the city administration could also work collaboratively with the modellers in developing necessary databases to track emissions from local anthropogenic sources.