Council on Energy, Environment and Water Integrated | International | Independent
Suggested citation: Agrawal, Shalu, Sunil Mani, Karthik Ganesan, and Abhishek Jain. 2020. What Smart Meters Can Tell Us? Insights on Electricity Supply and Use in Mathura and Bareilly Households. New Delhi: Council on Energy, Environment and Water.
This study provides insights into urban household electricity consumption patterns by collecting high-frequency data from nearly 100 smart meters installed in Mathura and Bareilly districts of Uttar Pradesh. It investigates the gaps in the quality of supply and discusses how power distribution companies can utilise the smart meter data for effective service delivery and demand management. Further, it discusses the developments in smart metering technology and how Indian power utilities are tapping into the opportunities offered by this technology. The study also outlines the policy implications of the insights derived and proposes recommendations. The data presented in the study was collected between May and October 2019.
Appliance penetration among the sample households varies across the two districts
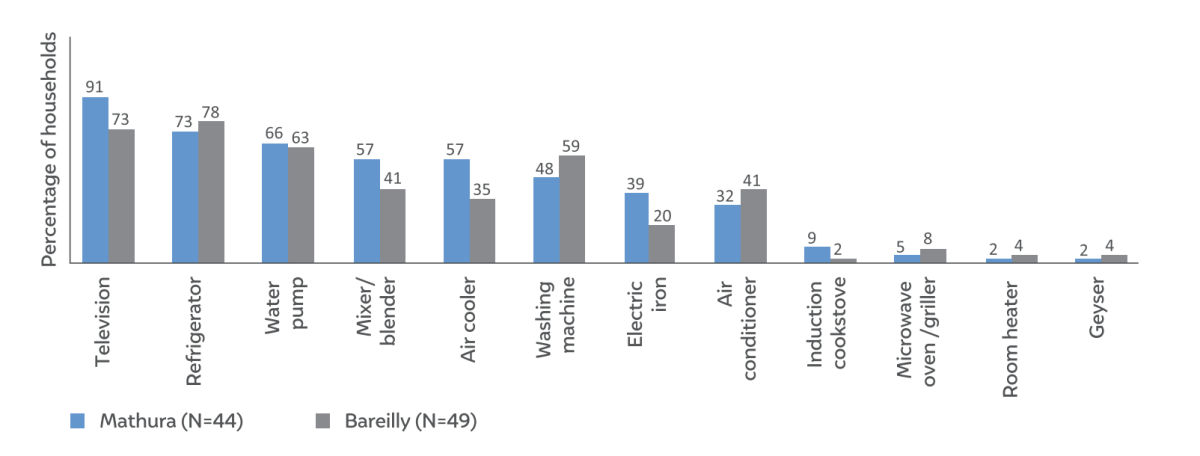
Source: Author’s analysis
Power utilities or discoms in India face the daunting task of meeting the rising electricity demand by offering reliable electricity services, at the same time, engaging in efforts to recover the costs of operation and continually allocating resources to invest in upgrading the power infrastructure. The continually surging residential demand, which makes up onefourth of the country’s power consumption, adds up to the challenges of discoms. However, discoms lack an adequate understanding of electricity usage patterns at the household level and its variation with time and season. The limited information about electricity use from conventional meters at a low frequency (once a month) does not render it suitable for demand analysis.
India is an attractive smart-meter market in the world, which remains largely untapped, boasting of 215 million domestic connections nationwide. Nearly 2 million smart meters have been installed across the country so far. The adoption of smart meter technology in India provides an opportunity for the power distribution companies (discoms) to gather real-time information on residential electricity demand and make better decisions to manage it.
We provide insights into the household consumption pattern by collecting high-frequency data from 93 smart meters that we installed in urban households in Mathura and Bareilly districts of Uttar Pradesh. We also investigate the gaps in the quality of supply and discuss how power distribution companies can utilise the smart meter data for effective service delivery and demand management. Households were sampled in a purposive manner from multiple residential areas and within a substation jurisdiction to capture diversity in the quality and duration of supply and consumption behaviour. We started collecting smartmeter data from May 2019. This study presents preliminary insights based on the data collected between May-October, 2019.
ES 1: Households in NTAs face more power outages than those in district headquarters
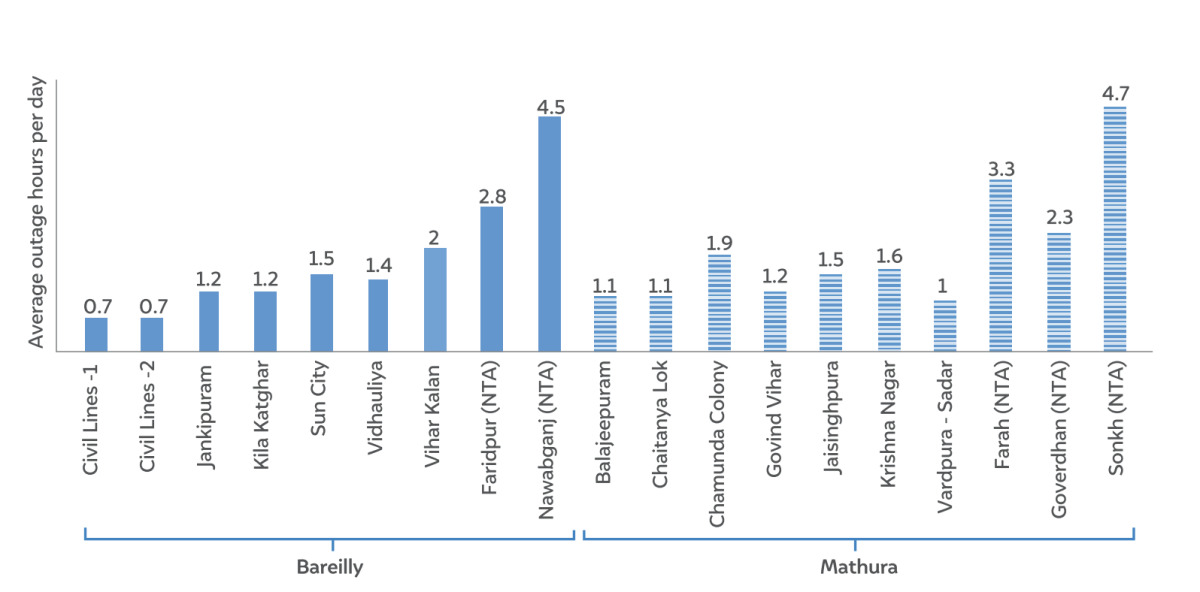
Source: Authors’ analysis
ES2: Households can be classified into four clusters based on demand, from low to very high levels of consumption
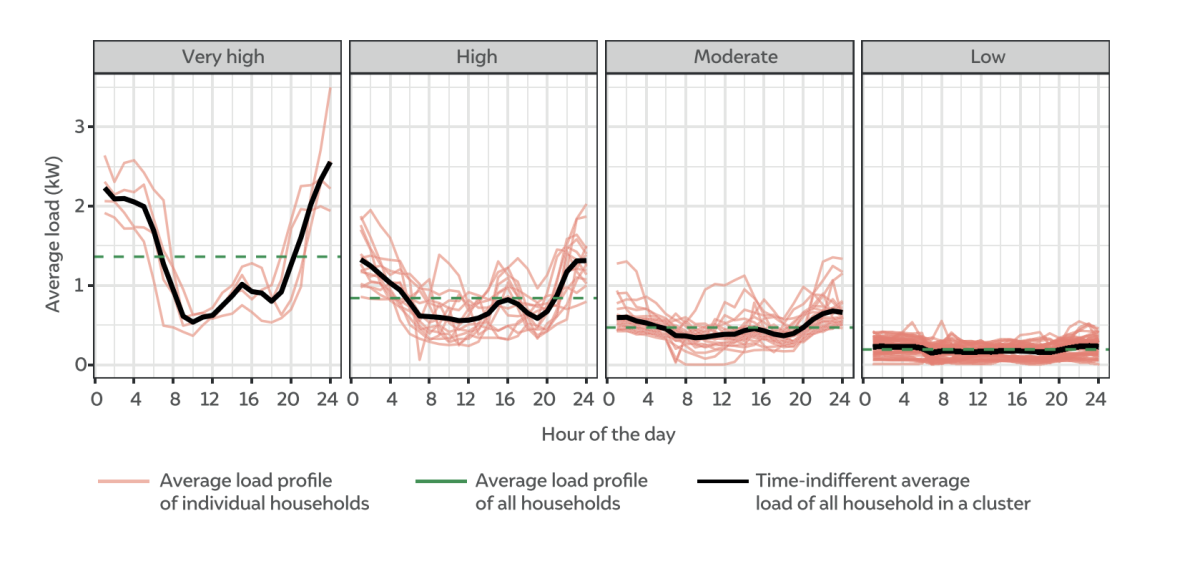
Source: Authors’ analysis
Improving billing efficiency and reducing commercial losses seem to be the primary objective of discoms for deploying smart meters in India. We argue that discoms can go further in utilising the smart metering infrastructure to provide reliable, cost-effective, and sustainable electricity services to the consumers. Based on our insights on the electricity supply situation and demand patterns, we propose three key recommendations.
Any problem in the distribution network affects its overall health, which can result in the end consumers receiving low supply hours compared to the supply at the feeder level. In order to achieve the policy target of uninterrupted power supply, discoms can effectively make use of the smart meter infrastructure to monitor tail-end supply parameters, such as power outages, voltage profile, and power factor, and ensure better network health through predictive maintenance and infrastructure upgrades.
Smart meter data proves useful to gain a clear understanding of the household load profile, peak demand, and its drivers, which can be used by discoms to profile different customer segments. This data, in turn, could be used to forecast demand, assess the capacity of the distribution network to handle the load at all times, and further plan for infrastructure expansion. Discoms could also explore alternative strategies to augment supply, such as peaking power, demand shifting, and distributed storage.
Apart from making supply-side interventions within their span of control as the electricity service provider. We propose three potential avenues:
a. Providing periodic feedback to consumers on self-consumption and that of others to promote conservative energy use. We find that most people tend to estimate their energy consumption wrongly and have inadequate information to optimise their usage or purchase decisions. Discoms, by providing feedback on energy usage in general, and AC use, in particular, could help households keep a better check on their overall energy consumption, which would also increase consumers’ trust in the electricity bills. Discoms could consider indicating the hours of AC use in the electricity bill.
b. Implementing demand response mechanisms in a targeted manner. The increase in the use of air conditioners and coolers by households would make load management further challenging for discoms. Discoms should design and test new mechanisms, such as time of use (ToU) pricing targeted towards residential consumers who contribute to peak demand. By resorting to this measure, discoms would be able to achieve load shifting/reduction and also manage their procurement costs associated with rising peak demand. Discoms could also incentivise peak consumers to adopt distributed generation and/or storage to reduce withdrawals from the grid during peak hours and achieve load shaving.
India’s power sector is undergoing a rapid transformation, as we are witnessing changes in power generation, regulatory measures, as well as consumption patterns. This environment provides an opportunity for discoms to transform from being just an electricity supplier to an energy service provider by engaging with the consumers to help them save electricity and improving the overall consumer experience.
Smart metering initiatives in the country are well-timed to enable this transition. However, the smart-meter deployment should be carried out in realistic timelines taking into account technology advancements and various implementation challenges. A systematic approach and treating smart-meters as an integral part of grid-modernisation efforts would be crucial to tap into the multiple opportunities that the technology offers.
Power utilities or discoms in India face the daunting task of meeting the rising electricity demand by offering reliable electricity services, at the same time engaging in efforts to recover the costs of operation and continually allocating resources to invest in upgrading the power infrastructure. The continually surging residential demand, which makes up onefourth of the country’s power consumption, adds up to the challenges of discoms. A clear understanding of the electricity usage patterns at the household level and its variation with time and season, and household preferences, would help discoms draw an efficient plan for load management and infrastructure strategies. The limited information from conventional meters at low frequency of data collection does not render it suitable for demand analysis. The smart meter technology offers an opportunity for power utilities to gain a clear picture of household usage patterns and suitably manage the rising electricity demand.
We explored the ways in which smart meters can help discoms track and effectively manage the residential electricity demand and assist in the design, planning, and operation of the distribution network in an efficient manner. To accomplish our objective, we collected data from smart meters installed at 93 urban households in two districts—Mathura and Bareilly—in the state of Uttar Pradesh. As our sample is small and not statistically representative of the focus population, we ensured diversity in our sample by choosing households having a varied appliance inventory and living in residential areas falling under the jurisdiction of different substations. Our findings are only indicative of the variation in supply situation and demand patterns. We believe that a similar assessment could be done at scale with the help of smart meters deployed by the discoms.
As discussed in this report, we found variations in the duration and quality of electricity supply in both districts. The monitored households received an average supply of 22 hours a day in our study period between May and October 2019. The duration of supply varied even across urban areas of the same district. Households in NTAs, which are small urban areas, endured longer and more frequent outages as compared to those in district headquarters. Most interruptions were shorter in duration, which indicates the prevalence of faults or unscheduled load-shedding. While a few residential areas in the NTAs received consistently low voltages, with voltage drops reaching 25–30 per cent during peak load, in contrast, most others faced the challenge of high-voltage supply endangering life and equipment.
Our findings highlight the need for the discoms to actively monitor the supply situation at the end-consumer level to locate areas with poor voltage profile, potentially indicating capacity gaps, unforeseen increase in demand or electricity theft. Accordingly, discoms can take appropriate measures for voltage regulation and capacity upgradation. Using smart meter data, discoms get tail-end visibility, which can be effectively utilised for predictive maintenance and infrastructure upgrades.
We also noticed that nearly one-third of the sampled households drew power in excess of their respective sanctioned load, though one-sixth of the surveyed consumers did so for three or more consecutive months, which is a serious concern. At present, discoms rely on a manual process to ascertain the maximum demand of consumers through meter readings, and even this exercise is not undertaken regularly. This partly explains why voltage drops and transformer burnouts are not uncommon. Smart meters can give discoms a greater understanding of consumer demand in real time, which they could use to identify consumers exceeding their sanctioned load for a sustained period of time. Discoms, in addition to planning for infrastructure expansion to meet the rise in peak demand, which lasts for a small fraction of total time blocks in a year, should also explore alternative supply augmentation strategies, demand shifting, distributed generation, and storage (Parray and Tongia 2019).
As discussed earlier, we observed that electricity use in households is commensurate with their economic status. Increased income of the household means it can afford to have advanced cooling appliances. In our sample, households using only fans consumed less than 250 units a month, but those with coolers and ACs display a wide variation in electricity usage, exhausting anywhere between 200 and 1000 units a month, during our study period between May and October 2019. With increase in income levels as well as the rise in temperatures due to climate change, more households are likely to install coolers and ACs at home for space cooling. This would definitely lead to a surge in demand.
Although increase in demand would convert into higher revenue for discoms, load management challenges await them in terms of higher use of ACs, as they are the major contributors to peak demand during night-time. Between May and October, the monitored households used the AC for an average 5.5 hours a day, with majority of the use concentrated around midnight. In order to meet such sudden spike in demand, discoms need to procure fast-ramping peaking power, which is more expensive. Thus, it would become crucial for the discoms to track and anticipate the uptake of these appliances and employ diverse strategies for demand-side management.
Granular insights on household electricity use can help the utilities assess and design suitable mechanisms to manage the rising demand at the consumer end. As discussed earlier, households often have inadequate information about their electricity use, as many of them tend to over-estimate or under-estimate their appliance use. By providing information about energy use on a daily or weekly basis, discoms could push the consumers towards using electricity in a conservative manner as well as help them take optimal decisions concerning appliance purchase. For instance, discoms could provide customised advisory to households indulging in high AC use and potential savings from switching to a more efficient AC. A periodic feedback to consumers on self-consumption and that of others on their electricity bills or through mobile communication could also help in lowering consumption.
Discoms must also design and test mechanisms for demand response, such as time of use (ToU) pricing, which is applied for commercial and industrial customers in India. However, if this tool has to be extended to domestic consumers in India, it would be essential to identify the target audience, such that the ToU scheme is both effective (yields the desired demand reduction) and equitable (doesn’t burden less affluent consumers). As our analysis suggests, it is the households using ACs and/or coolers that contribute to the peak demand and they could be targeted for demand response. Smart meter data can help discoms identify consumers who drive the peak demand as they tend to have a markedly different load profile. Price-sensitive consumers could realise savings by avoiding consumption at peak hours, especially of the AC as it accounts for a significant share of the overall consumption. Further research is needed to explore potential tariff designs and their effectiveness in generating adequate response from the consumers.
Another demand management strategy that discoms must explore is incentivising consumers who exhibit peak consumption to adopt distributed solar generation and/or battery storage. This way consumers can reduce their withdrawals from the grid during peak hours and discoms could achieve load shaving. Data from smart meters at the consumer and distribution level could be used to identify strategic pockets for such interventions, helping discoms reduce investments required for infrastructure upgrades as well as avoid the purchase of expensive power during peak hours. This would also help the discoms achieve their renewable energy targets.
India’s power sector is undergoing a rapid transformation, as we are witnessing changes in power generation, regulatory measures, as well as consumption patterns. This environment provides an opportunity for discoms have to transform from being just an electricity supplier to an energy service provider by optimising costs, engaging with the consumers to help them save electricity, and improving the overall consumer experience. Smart metering initiatives in the country are well timed to enable this transition. Discoms should maximise the utility of investments towards smart meters by looking beyond metering, billing, and collection efficiencies.
How can India Create a Demand Flexibility Market?
Contracts for Difference for Flexible and Affordable Clean Power
Enabling Corporate India's Clean Energy Transition
Scaling Solar Power for Irrigation in India: