Council on Energy, Environment and Water Integrated | International | Independent
Context: India had notified draft greenhouse gas emission intensity (GEI) targets under the Carbon Credit Trading Scheme (CCTS) for eight sectors, but has finalised targets for only four of them so far: cement, aluminium, chlor-alkali, and pulp and paper.
Implication: Delays in notifying the final targets led to a pro-rata recalibration, making them less stringent than the draft targets, which reduce the emissions reduction potential by about 2.8 MtCO₂e by 2027.
CEEW analysis: Marginal Abatement Cost Curves show that even the draft targets for three .sectors—cement, aluminium, iron and steel—would rely largely on low or negative-cost abatement options, meaning most reductions for compliance would be achieved through cost-saving measures.
Recommendation: If remaining sectoral targets are notified in a timely manner, supported by price stability mechanisms and future compliance cycles that gradually increase ambition, the CCTS can be a credible, cost-effective carbon market that supports industrial decarbonisation while strengthening India’s climate policy architecture.
India’s notification of final greenhouse gas emission intensity (GEI) targets (Table 2) in October 2025 marks a crucial step in operationalising the compliance mechanism of the Carbon Credit Trading Scheme (CCTS). GEI measures how much a sector emits for every unit of output. Under the CCTS, each sector receives a GEI-reduction target. If an entity performs better than its target, it earns carbon credits, or carbon credit certificates (CCCs), which can be sold to firms that fall short, creating a market-based incentive for cleaner production. On the other hand, non-compliance incurs an “environmental compensation” equal to twice the average carbon credit price, ensuring market discipline. These GEI targets for obligated entities are set annually within multi-year periods, with the baseline period for determining the targets for the first phase being the financial year (FY) 2023–24. The initial compliance years for the three-year period are FY 2025–26 and FY 2026–27.
The CCTS compliance covers nine ‘hard-to-abate’ sectors: iron and steel, cement, aluminium, fertilisers, petrochemicals, textiles, pulp and paper, chlor-alkali, and refineries, which together contribute roughly 15–20 per cent of India’s total greenhouse gas emission. They are termed ‘hard-to-abate’ because their emissions stem from core industrial processes that are technically and financially difficult to decarbonise.
However, the process faced delays. The draft targets were released in April and June 2025 (Table 1), but the final targets (Table 2) were notified five months later for only four sectors: cement, aluminium, chlor-alkali, and pulp & paper. Since the compliance period had already begun in April, the government proportionately reduced the targets to account for the elapsed period. This “pro-rata recalibration” has made the final targets less stringent than originally proposed.
This matters because the draft targets were already broadly aligned with the negative Marginal Abatement Cost Curve (MACC) values. For sectors such as iron and steel, aluminium, and cement, the abatement options to remain compliant lie entirely in the negative or low-cost zone of the MACCs, that is, they deliver reductions while offering net economic gains.
Because the final targets are less stringent, the emissions reduction potential has fallen by about 16 per cent in aluminium, 17 per cent in cement, 11 per cent in chlor-alkali, and 16 per cent in pulp and paper relative to draft values. Overall, this translates to a potential loss of approximately 2.8 million tonnes of greenhouse gas (GHG) emission reductions by 2027, an approximate 16 per cent decline in ambition compared to the draft targets.
Targets for the remaining sectors are still pending. If they are similarly delayed, their targets may be further weakened. Lower stringency could reduce the overall mitigation achieved under the scheme and lead to a potential oversupply of carbon credits, especially since the targets look achievable for sectors such as aluminium, iron and steel, and cement that already represent around 70 per cent of CCTS-covered emissions.
The first phase of the CCTS appears deliberately calibrated to prioritise feasibility over stringency. Targets are largely located in the negative-cost region of the marginal abatement cost curve, with provisions such as unlimited banking for major sectors lowering near-term compliance risk. While this may appear conservative, such a design is consistent with emerging insights on policy sequencing, which emphasise the role of early 'carrots' in enabling learning, innovation, and institutional readiness.
In effect, several design features of Phase I function as implicit ‘carrots’. By lowering perceived compliance risk, encouraging early participation, and allowing firms to build internal capabilities, particularly around monitoring, reporting, and verification (MRV), the framework facilitates early engagement rather than resistance. Phase I emphasises learn-by-doing, the establishment of MRV infrastructure and baselines, and gradual industry acclimatisation to carbon constraints, while deliberately avoiding sharp cost shocks, binding absolute caps, and penalty-heavy enforcement. In this context, Phase I of the CCTS should be interpreted less as a lack of ambition and more as a foundational step, one whose effectiveness will ultimately depend on the credibility and pace of future tightening. While carrots help with near-term mitigation, sticks remain essential for long-term deep decarbonisation.
Instead of assigning every obligated entity the same goal, the government took a site-specific approach in which the plant's target reflected its technology, current efficiency, scale, and potential for retrofitting improvement measures. Target-setting is sector-driven, with plant allocation done through relative benchmarking.
Illustrative examples include:
Why this approach works:
In essence, the policy aims to maximise total emissions reduction while recognising the real-world technological and operational differences across facilities, mirroring considerations for historical emissions trajectory and best-in-class performance standards.
MACCs are a standard tool used to evaluate the cost-effectiveness of different emissions reduction technologies and serve as a way to communicate abatement policies. These curves are essentially charts that display various technologies, showing the amount of emission they can abate in a specific future period, along with the net cost per unit of that reduction. To assess ambition, the draft GEI targets till 2027 (Table 1) were mapped against the MACCs for aluminium, cement, and iron and steel, using a BAU (business-as-usual) approach. BAU refers to a scenario where activities continue without additional climate policies or interventions, without any change from current practices, which in this case refers to a scenario where emissions intensity remained at the baseline level.
The MACCs referenced in this analysis are taken from previous Council on Energy, Environment, and Water (CEEW) reports on the Indian steel, aluminium, and cement industry.
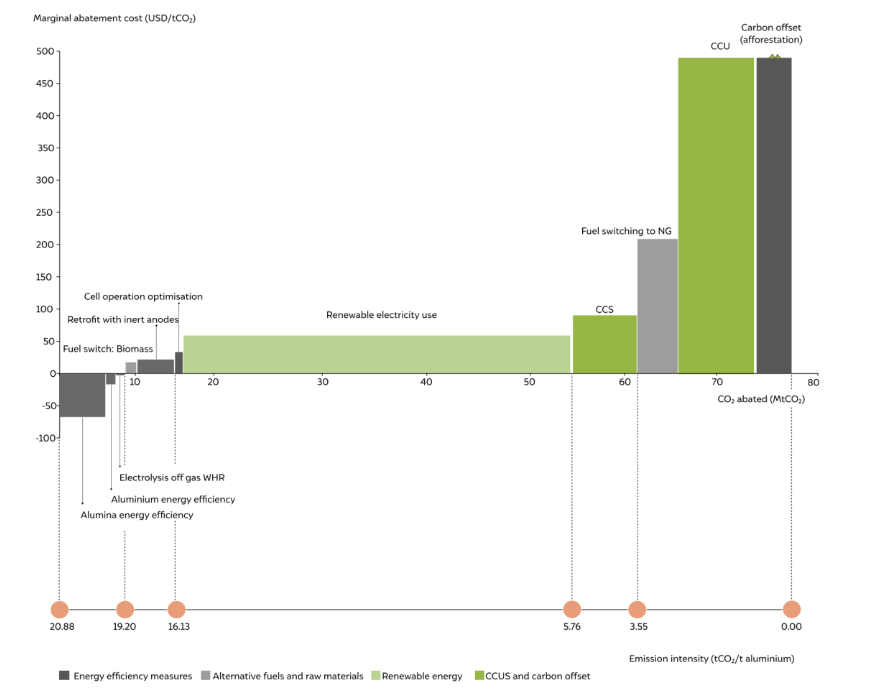
Aluminium sector
Draft targets avoided ~5.4 MtCO₂e compared to a BAU scenario, entirely within the low or negative-cost zone of the MACC. The final target reduces this to ~4.5 MtCO₂e.Low-cost abatement measures—energy efficiency, waste-heat recovery, biomass fuel switching, and inert anodes, with savings up to USD 60/tCO₂e—enable the aluminium sector to over-deliver on targets and generate surplus credits for banking or trading in line with future carbon prices.
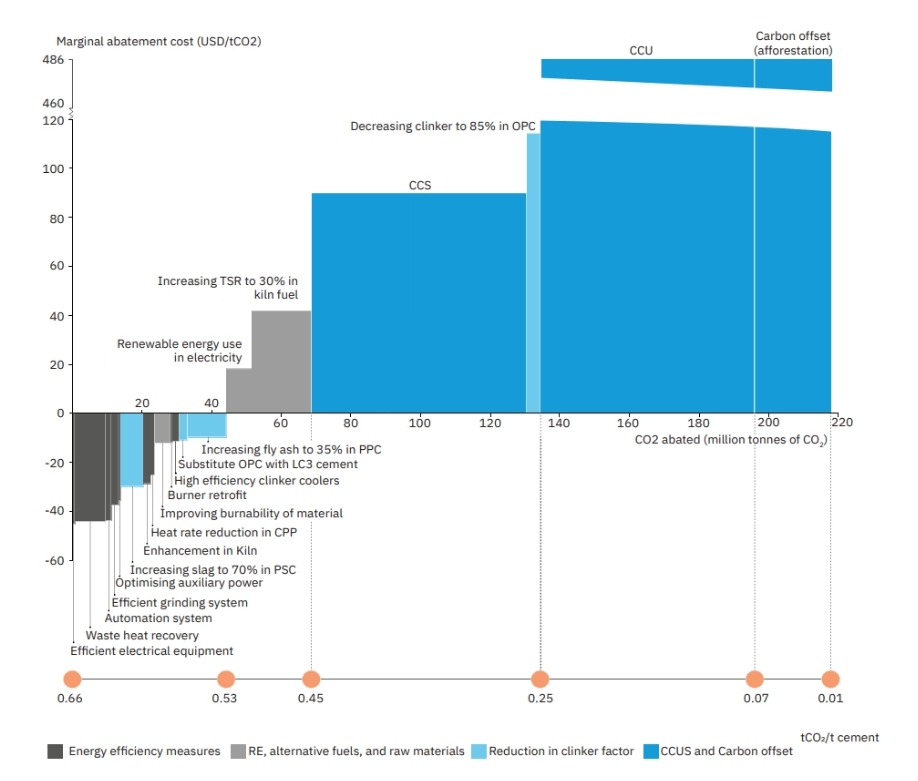
Cement sector
Draft targets avoided ~10 MtCO₂e compared to a BAU scenario and lay in the negative-cost zone. The final target reduces this to ~8.26 MtCO₂e. Technologies such as waste-heat recovery, efficient grinding, clinker substitution, and kiln upgrades have negative or zero marginal costs. The sector has an abatement potential of up to 45 MtCO₂e with low marginal abatement costs, far exceeding its current compliance requirement.
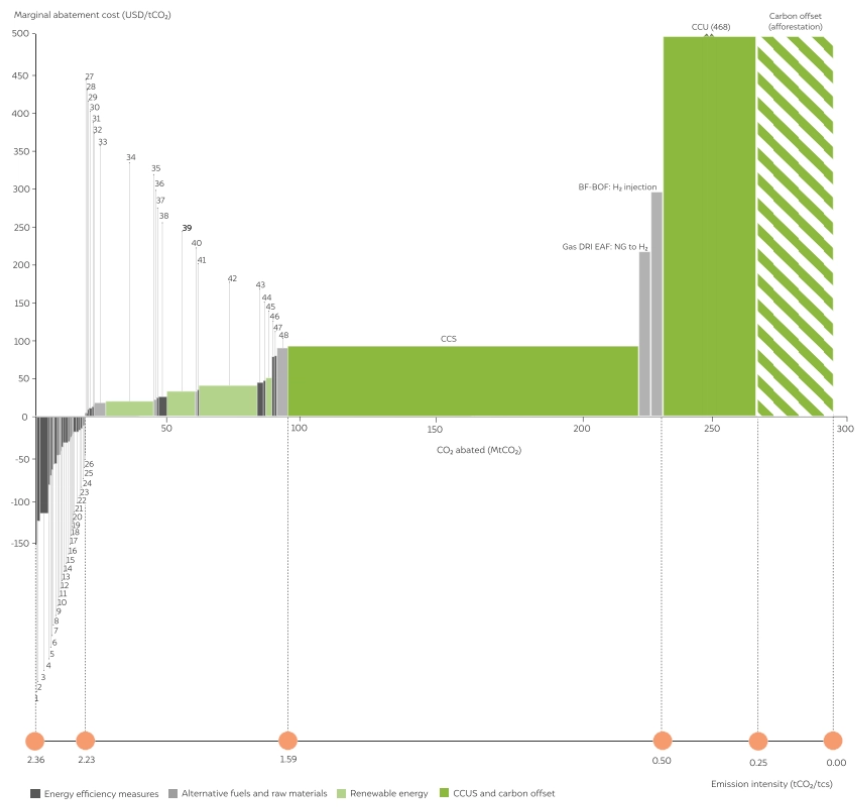
Iron and steel industry
Draft targets would result in an avoidance of ~23.2 MtCO₂e, which lies in the negative-cost zone. Baseline emissions of 349.5 MtCO₂e in 2023–24 would otherwise rise to 416.03 MtCO₂e by 2026–27 under a BAU scenario, but the CCTS draft targets bring it down to 393.06 MtCO₂e.
Most of this reduction can be achieved through negative or zero-cost energy-efficiency measures, such as shifting from older furnace systems to DRI-EAF (Direct Reduced Iron-Electric Arc Furnace), BF-BOF (Blast Furnace-Basic Oxygen Furnace) improvements, enhancing sintering burner efficiency, and waste-heat recovery to generate electricity, which together allow the sector to meet the required emissions-intensity reduction drop from 2.36 to 2.23 tCO₂.
While these low-cost opportunities enable the sector to meet current targets, deeper cuts beyond ~23.2 MtCO₂e will require costlier technologies, raising marginal abatement costs and potentially driving cost-push inflation, highlighting the need for future policy support.
Note: This analysis is based on data from JMK Research and sectoral sources. For FY 2023–24, the Iron & Steel sector, responsible for approximately 12% of India's total GHG emissions (~355 MtCO₂e) has nearly complete coverage, with CCTS-covered emissions estimated at 349.5 MtCO₂e from 145.6 Mt of output. The Cement sector, contributing around 25% of industrial emissions, is estimated to emit ~260 MtCO₂e, all of which is assumed to be covered under CCTS. For Aluminium, CCTS-covered emissions are ~75.08 MtCO₂e, closely aligning with the sector’s estimated total emissions (~82.7 MtCO₂e) and national production data of 11–12 Mt from aluminium and alumina. These figures reflect substantial sectoral coverage under CCTS and form the basis for evaluating mitigation potential and policy needs.
Note: MACC is an indicative ordering, but actual implementation involves a portfolio approach. While some measures appear as negative-cost, adoption is not always immediate due to barriers such as capital availability or operational constraints and industry will also adopt positive MACC in a phased manner.
Because cement and aluminium have substantial low-cost reduction potential, they could emerge as major suppliers of carbon credits, much as they likely dominated as suppliers of energy-saving certificates under the Perform, Achieve, and Trade (PAT) scheme. However, the overall trading dynamics and carbon prices will depend on how other high-emitting sectors perform once their targets are assessed against their sectoral MACCs.
With watered-down final targets for four sectors and the likelihood of abundant low-cost credits, carbon prices could face downward pressure, weakening incentives for deeper operational industrial decarbonisation. This challenge will be compounded by any inflow of offset credits under the CCTS, however, there is currently an absence of a mechanism linking the offset and the compliance markets. Whether demand will be adequate to absorb this supply remains uncertain, making it necessary to consider price stability instruments such as reserve pools, government absorption, consignment auctions, limits on banking of credits, and setting minimum price floors or collars.
As argued in the CEEW’s recent analysis, climate ambition must be assessed at the aggregate, economy-wide level, aligned with India’s national determined contributions (NDCs), rather than by isolating entities or sectors. Sectoral targets primarily reveal which industries become net buyers or sellers of credits indicating financial transfers based on their respective marginal abatement costs. Ultimately, carbon markets should facilitate efficient financial transfers between sectors to maximise emissions reduction at the lowest possible cost.
India’s GEI targets mark more than a policy milestone; it lays the foundation of India’s domestic carbon market. By setting pragmatic, sector-driven intensity targets with plant allocation through relative benchmarking for hard-to-abate sectors, the CCTS creates a pathway for cost-effective emissions reductions, market-led compliance, and industrial transition.
The real opportunity now lies in using this first phase to build confidence in monitoring, reporting, and verification (MRV) systems, test trading infrastructure, and establish credible price signals. If designed well, these targets can become a launchpad for deeper ambition and a durable green industrial transformation.
Darshna Singh is a Research Analyst and Aparna Sharma is a Programme Lead at the Council on Energy, Environment, and Water. The authors express their gratitude to Harman Singh and Christi Kesh for their feedback. Send your comments to [email protected]


Comments
vBsY
Mon, 03/16/2026 - 03:25
OdTj
vBsY
Mon, 03/16/2026 - 03:25
OdTj
vBsY
Mon, 03/16/2026 - 03:25
OdTj
vBsY
Mon, 03/16/2026 - 03:25
OdTj
vBsY
Mon, 03/16/2026 - 03:25
OdTj
vBsY
Mon, 03/16/2026 - 03:25
OdTj
vBsY
Mon, 03/16/2026 - 03:25
OdTj
vBsY
Mon, 03/16/2026 - 03:25
OdTj
vBsY
Mon, 03/16/2026 - 03:25
OdTj
vBsY
Mon, 03/16/2026 - 03:25
OdTj
Pages
Add new comment