Council on Energy, Environment and Water Integrated | International | Independent
Suggested Citation: Sripathy, Pratheek, Kartheek Nitturu, and Deepak Yadav. 2025. How can CCUS Decarbonise India’s Industrial Sector? Exploring the Feasibility of Deploying Carbon Transformation Technologies in Hard-to-Abate Industries. New Delhi: Council on Energy, Environment and Water.
This study assesses the role and potential of carbon capture and utilisation (CCU) in decarbonising the Indian steel and cement sector, by deliberating on techno-economic and policy dimensions of green hydrogen-based CCU applications for producing value-added fuels and chemicals. The study considers products such as olefins, synthetic natural gas (SNG), sustainable aviation fuel (SAF), dimethyl ether (DME), ethanol, methanol, and urea.
The report focuses on estimating the amount of CO2 that can be utilised and the potential green hydrogen consumption across various end-use applications. It assesses the cost-competitiveness of green hydrogen-based CCU products compared to those manufactured using conventional fossil-based processes. This report also evaluates the implications of CCU on the final cost of products like steel and cement, and the potential reduction in India's import bill by utilising CO2 to produce more sustainable variants within the country.
India needs to decarbonise its hard-to-abate industrial sector to meet its Nationally Determined Contributions (NDC) targets for 2030 (UNFCCC, 2022) and Panchamrit goals till 2070 (PIB 2022a). The steel and cement sectors are together responsible for 19 per cent of India’s total emissions (GHG Platform n.d.) and 53 per cent of its industrial emissions (World Bank 2018). While decarbonisation levers such as energy efficiency (EE), renewable energy (RE), alternative fuels (AFs), and material efficiency are necessary to mitigate emissions from the steel and cement industry, these levers alone cannot help achieve net-zero emissions in the sectors. Previous studies by the Council on Energy, Environment and Water (CEEW) show that about 56 per cent of the total emissions from the steel (Elango et al. 2023) and cement (Nitturu et al. 2023) sectors can only be mitigated using the carbon capture, utilisation, and sequestration (CCUS) pathway. Therefore, CCUS will play an instrumental role in achieving net-zero emissions in the steel and cement sectors.
CCUS involves capturing CO2, which can either be sequestered in geological formations (CCS) or utilised in the manufacturing of various products (CCU). The carbon capture and utilisation (CCU) pathway provides the industry with an opportunity to monetise CO2 by utilising it in the manufacturing of value-added fuels and chemicals. Furthermore, CCU also provides India with an opportunity to reduce its imports of various chemicals like methanol and fuels like natural gas by producing more sustainable alternatives within the country. Producing these chemicals and fuels needs green hydrogen. Therefore, our analysis deliberates on techno-economic and policy aspects related to green hydrogen-based CCU applications for producing value-added fuels and chemicals, particularly in the context of decarbonising the steel and cement industries in India. The study considers green hydrogen-based CCU products such as olefins, synthetic natural gas (SNG), sustainable aviation fuel (SAF), dimethyl ether (DME), ethanol, methanol, and urea.
CCU products are likely to achieve cost competitiveness in the future
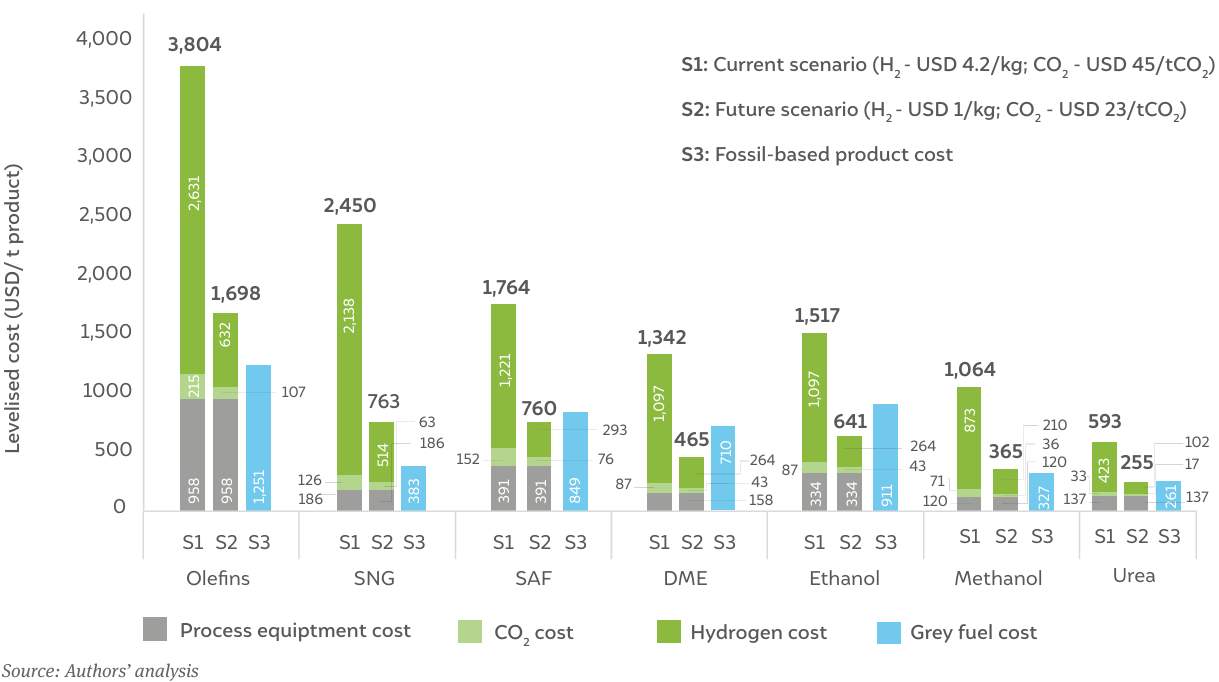
The predominant factor determining the cost of a CCU product is the cost of green hydrogen. Green hydrogen is not cost-competitive today, but it is likely to achieve parity in the future due to government initiatives like the National Green Hydrogen Mission (NGHM), bringing down the cost of most CCU products. Figure ES1 compares the levelised cost of products manufactured using CCU across current (S1) and future (S2) scenarios with those of products manufactured using traditional fossil-based processes (in blue). The results show that, in the current scenario (S1), none of the CCU applications is commercially viable. This can be attributed primarily to the high hydrogen consumption in these processes and its costs. In the future scenario (S2), a few applications such as SAF, DME, ethanol, and urea production will become commercially viable as the cost of green hydrogen and carbon capture reduces. However, applications such as olefin and SNG production are not expected to become cost-competitive even in the future.
Figure ES1: All CCU products are significantly more expensive than fossil-based products, at H2 costing USD 4.2/kg, and CO2 at USD 45/tCO2
Forty-six per cent to seventy-seven per cent of the total investment for CCU projects is dedicated to setting up green hydrogen units
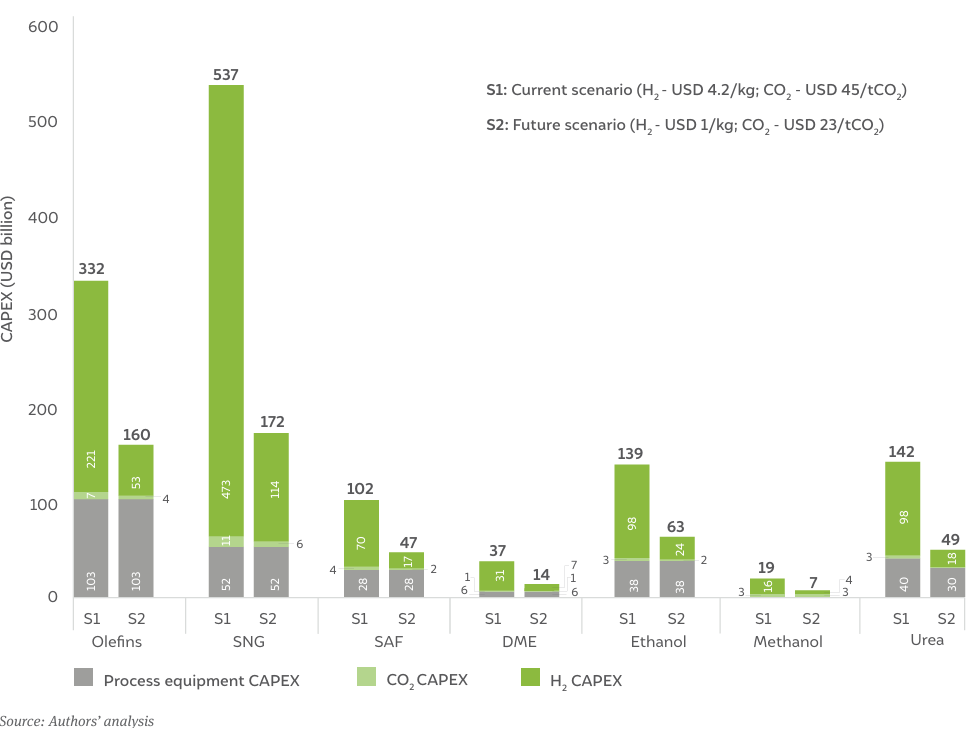
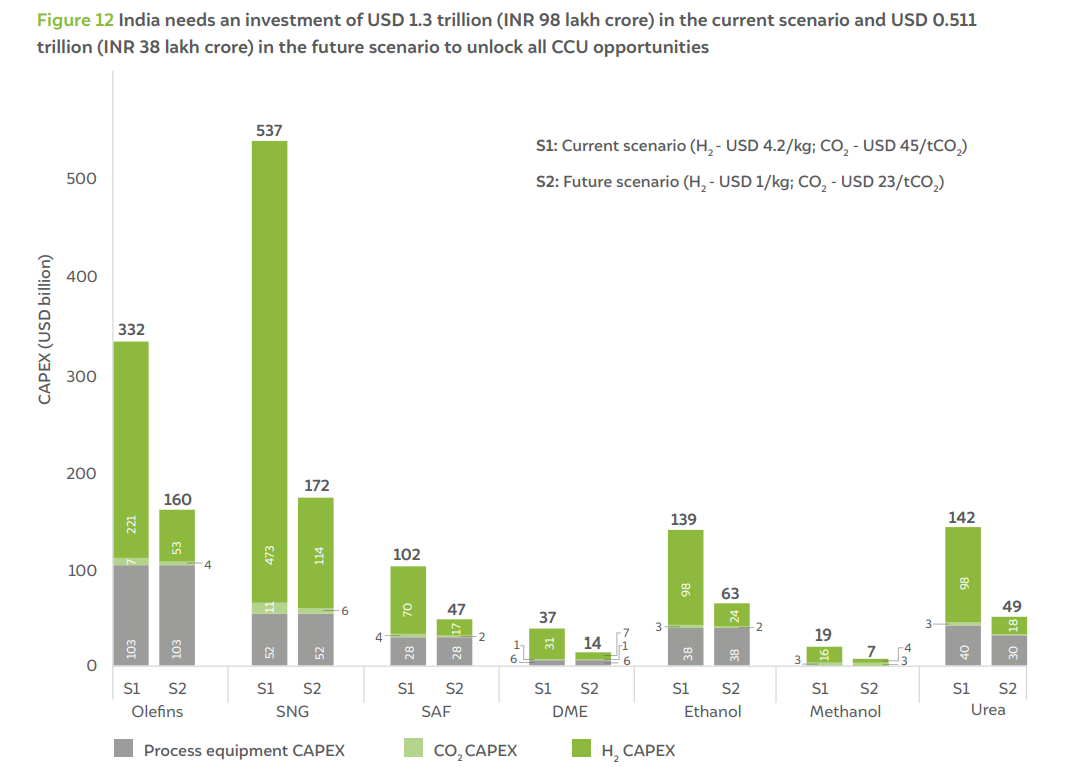
Figure ES2 shows the capital expenditure (CAPEX) requirements across all CCU opportunities discussed in the study for current and future scenarios. The CAPEX requirement was calculated based on India’s total consumption of various fuels and chemicals. For ethanol and DME, we estimated the CAPEX for a 20 per cent and 5 per cent blend with gasoline and diesel, respectively. In the current scenario (S1), we estimate a total investment requirement of USD 1,307 billion (INR 98 lakh crore) across all CCU applications considered in the study. This CAPEX requirement will reduce to USD 511 billion (INR 38 lakh crore) in the future scenario (S2) due to a decline in the cost of green hydrogen and carbon capture. It assumes the utilisation of 229 million tonnes per annum (MTPA) of CO2 and the production of 34 MTPA of green hydrogen.
Figure ES2: India needs an investment of USD 1,307 billion in the current scenario (S1) and USD 511 billion in the future scenario (S2) to unlock all CCU opportunities
CCUS has a significant impact on the cost of producing steel and cement
All green hydrogen-based CCU applications incur a significant premium, with a CO2 abatement cost of 273–744 USD/tCO2 in the current scenario, depending on the pathway. The CCUS required to abate 56 per cent of the total emissions from steel and cement manufacturing also entail significant costs. As shown in Figure ES3, our research indicates that in the current scenario, near-zero steel is 37–290 per cent more expensive than conventionally produced steel. However, in the future scenario, since the cost of abatement with CCU pathway reduces to (–)27–135 USD/t-CO2, the product cost will reduce by (–)8–54 per cent (negative sign implies a reduction in cost). We evaluate a 34–283 per cent increase in the current scenario and a (–)11–51 per cent change in production costs in future scenarios for the cement sector. Furthermore, although CCU is more expensive than carbon capture and sequestration (CCS) in the current scenario, it is expected to become cheaper in the future for most applications.
Figure ES3: CCUS has a significant cost impact on hard-to-abate industrial sectors
India could utilise ~60 MT of CO2 and consume ~6 MT of green hydrogen if the green hydrogen cost falls below USD 1 per kg
Our research indicates that CCU products can become commercially viable only if the cost of green hydrogen reduces significantly. Figure ES4 presents the breakeven prices of hydrogen that need to be achieved for CCU applications to become commercially viable as well as the corresponding amount of CO2 utilised. The base scenario considers the five-year average price of incumbent fuels and chemicals, whereas the aggressive scenario utilises the highest price achieved in this time frame. The analysis shows that India can utilise ~60 MT of CO2 up to a green hydrogen price of USD 1 per kg in new applications such as DME, ethanol, and SAF production, for which the green hydrogen consumption would be ~6 MT. Further mitigation of 141 MT of CO2 with the production of SNG and olefins can be achieved only if the green hydrogen price goes below USD 0.13 per kg.
Figure ES4: The break-even price of H2 is the highest for ethanol, at USD 1.88 per kg
India can reduce its import bill by USD 46 billion per year
Our research shows that by utilising CO2 to produce synthetic variants of jet fuel, urea, methanol, olefins, and natural gas, India can reduce its import bills by USD 46 billion per year – the import bill was USD 209 billion in 2022 (Department of Commerce 2023).
India has set an ambitious goal of achieving net-zero emissions by 2070. To realise this goal, the Indian economy has to be decarbonised in a phased manner. In 2018, industrial processes and product use emissions accounted for 7 per cent (GHG Platform n.d.) of India’s total greenhouse gas (GHG) emissions (GHG Platform n.d.). The steel and cement sectors are amongst the largest emitters of GHGs in India. Our estimates show that the cumulative CO₂ emissions from the manufacture of 337 million tonnes of cement in 2018–19 was 218 million tonnes of CO₂ (MtCO₂) (Nitturu et al. 2023). The Indian steel industry emitted 297 MtCO₂ in 2021–22 to produce 120.3 million tonnes of crude steel (Elango et al. 2023). The steel and cement sectors together are responsible for 19 per cent of national emissions (GHG Platform 2023; World Bank 2018) and 53 per cent of industrial emissions in India (GHG Platform 2023).
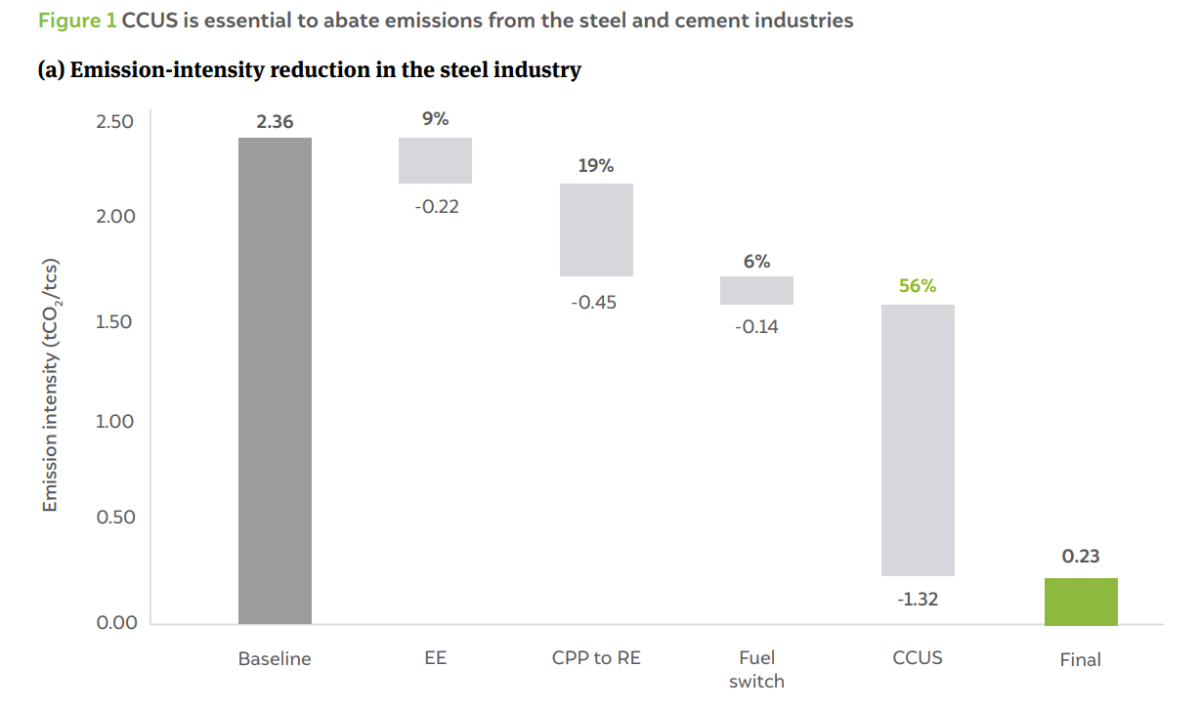
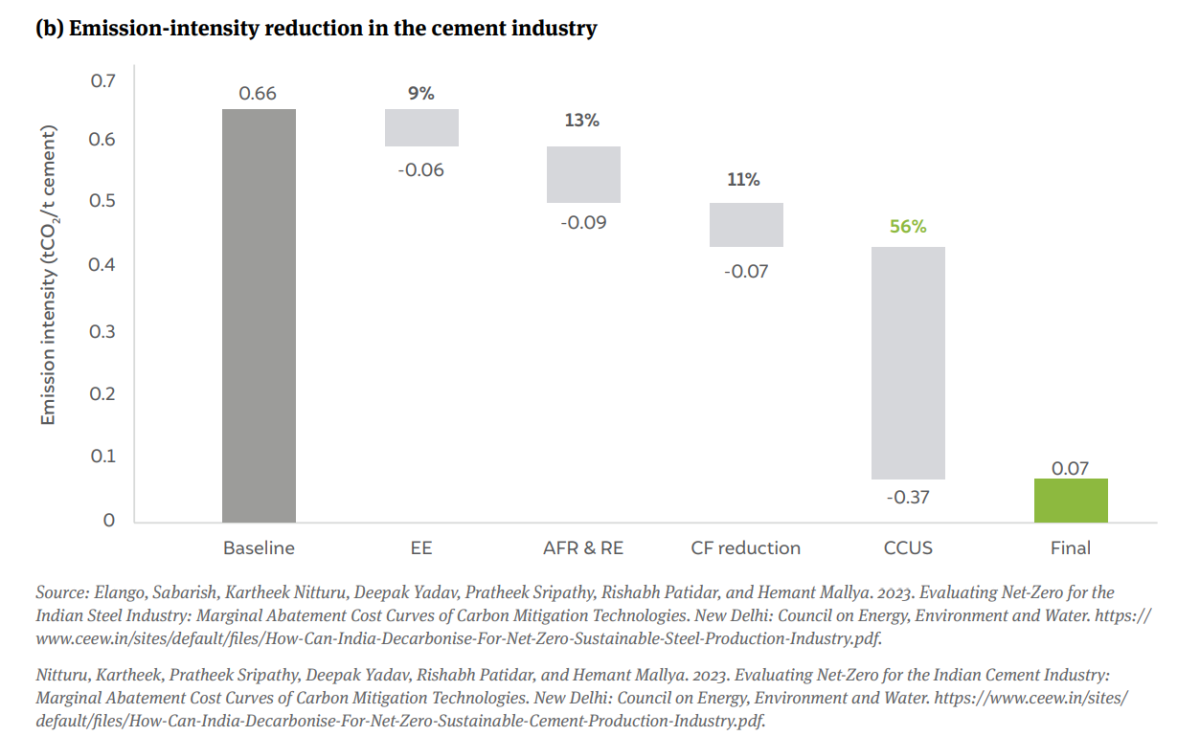
Deploying carbon capture, utilisation, and sequestration (CCUS) is inevitable if the steel industry in India is to be carbon-neutral, given that there exist a significant number of blast furnaces (BFs) – with plans to increase their number – which are not amenable to decarbonisation through the use of alternative fuels (AFs) such as green hydrogen. Similarly, in cement manufacturing, due to the indispensable nature of the materials used for cement production, process emissions, which constitute 56 per cent of the total emissions, cannot be abated. While energy efficiency (EE), renewable energy (RE), and AFs do abate a significant share of emissions, for deep decarbonisation, carbon management techniques such as CCUS are essential.
Figure 1(a) shows the emission-intensity reduction trajectory for the steel industry (Elango et al. 2023). Deploying EE measures in steel-making will only lead to a 9 per cent reduction in emissions, and switching from fossil-based captive power plants (CPP)/grid power to RE will only result in a 19 per cent reduction. However, 56 per cent of sectoral emissions could be abated through CCUS. It should be noted that the baseline emissions of 2.36 tCO₂ per tonne of crude steel (tcs) is the weighted average emissions from all steel production pathways.
Similarly, for the cement industry, as depicted in Figure 1(b), with base case emissions at 0.66 tCO₂ (Nitturu et al. 2023) per tonne of cement, EE can abate around 9 per cent, while the use of AFs, sustainable raw materials, and RE can abate around 14 per cent of emissions. A reduction in the clinker factor has the potential to abate an additional 11 per cent. However, the bulk of emissions – 56 per cent – needs to be abated through CCUS.
The primary objective of this study is to assess the role of carbon capture and utilisation (CCU) in decarbonising the Indian steel and cement industries. CCU involves capturing CO₂ to produce value-added fuels and chemicals while carbon capture and storage (CCS) involves permanently storing CO₂ in underground reserves. Currently, there is a dearth of knowledge about carbon abatement through CCU in the Indian context. This study focuses on estimating the amount of CO₂ that can be utilised across various end-use applications. The amount of green hydrogen needed, the techno-economics of CCU applications and the implications of CCU on the final cost of the products like steel and cement are also estimated.
CCUS is the process of capturing CO₂, which can then be sequestered in geological formations or utilised to produce value-added products that would have been otherwise synthesised using fossil fuels.
CO₂ capture is generally divided into four categories (Srinivasan et al. 2021):
Figure 2 shows the schematic of a typical CCU process used to produce green fuels and chemicals. The process involves capturing CO₂ either from point sources or through direct air capture and reacting it with green hydrogen to produce value-added chemicals, fuels, and commodities in a process plant. Green hydrogen can be obtained from electrolysers that are powered by solar and wind energy. The chemical plant design for the process will depend on the desired output. It must be noted that this study exclusively analyses CO₂ utilisation pathways that require green hydrogen for producing value-added fuels and chemicals.
Typically, there are three pathways for CO₂ utilisation. Captured CO₂ can either be directly used in sectors such as refineries and food and beverage industries or as a feedstock in the production of synthetic alternatives to chemicals and fuels that are currently produced using fossil fuels. Additionally, CO₂ can also be passively stored through mineral carbonation. Mineral carbonation is the fixation of CO₂ using alkaline and alkaline-earth oxides, which occur naturally in the form of silicate rocks such as serpentine and olivine. This analysis covers only green hydrogen-based CCU applications that involve CCU for producing value-added fuels and chemicals and does not include CO₂ utilisation through mineral carbonation despite its relevance. Figure 3 depicts the pathways for CO₂ utilisation and the potential synthesis of chemicals and fuels.
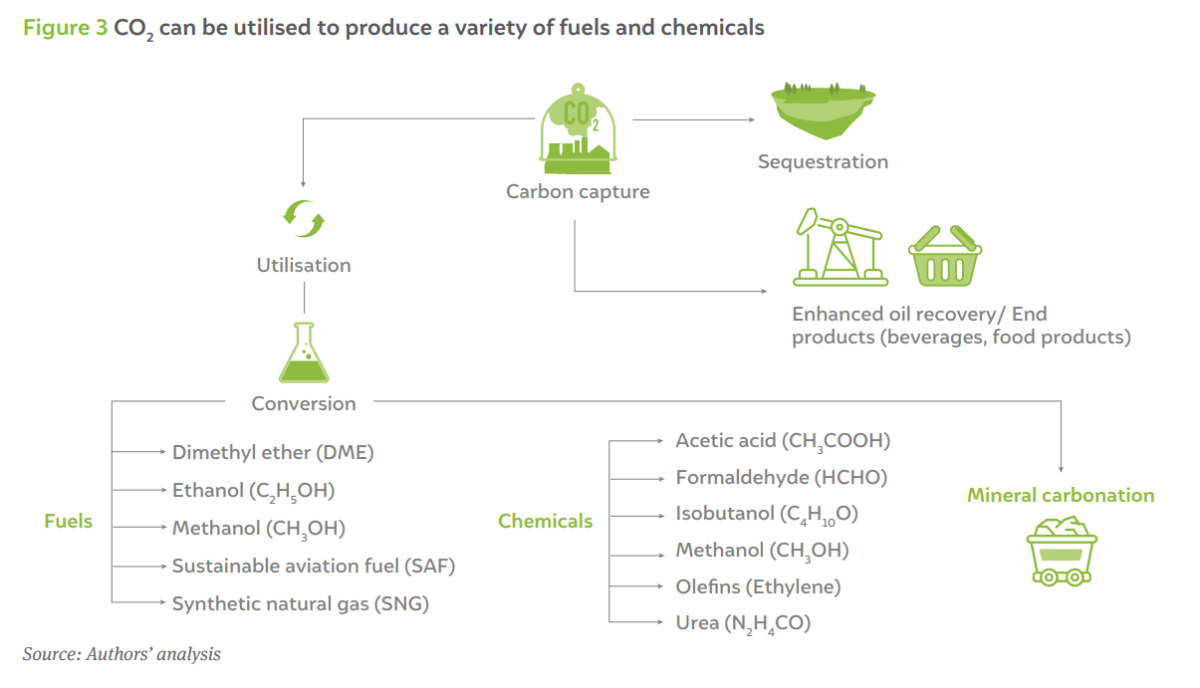
Figure 4 shows the pathways for producing various chemicals and fuels. CO₂ is already utilised in the fertiliser industry for producing urea from ammonia (Bhaskar and Das 2007). Similarly, when CO₂ undergoes hydrogenation with specific amounts of hydrogen, typically in the presence of a catalyst, products like methanol, ethanol, synthetic natural gas (SNG), and isobutanol can be synthesised (Encyclopaedia Britannica n.d.). Alcohol-based chemicals such as methanol and ethanol can be further upgraded to produce chemicals and fuels such as sustainable aviation fuel (SAF) (jet fuel), olefins, formaldehyde, and dimethyl ether (DME).
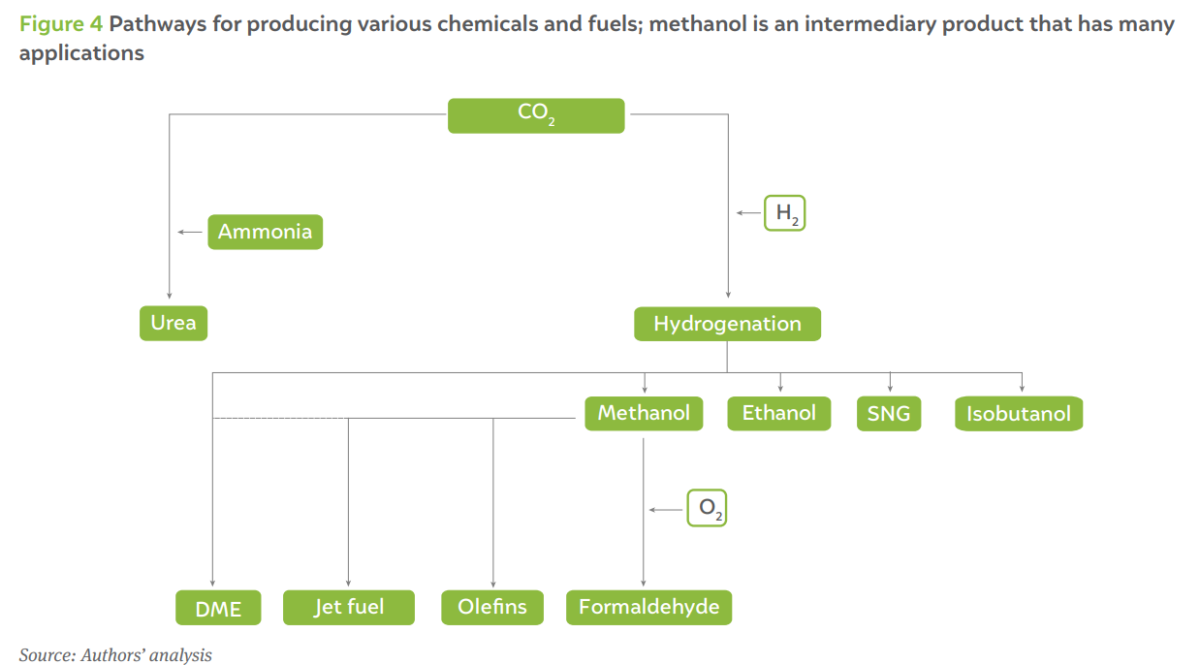
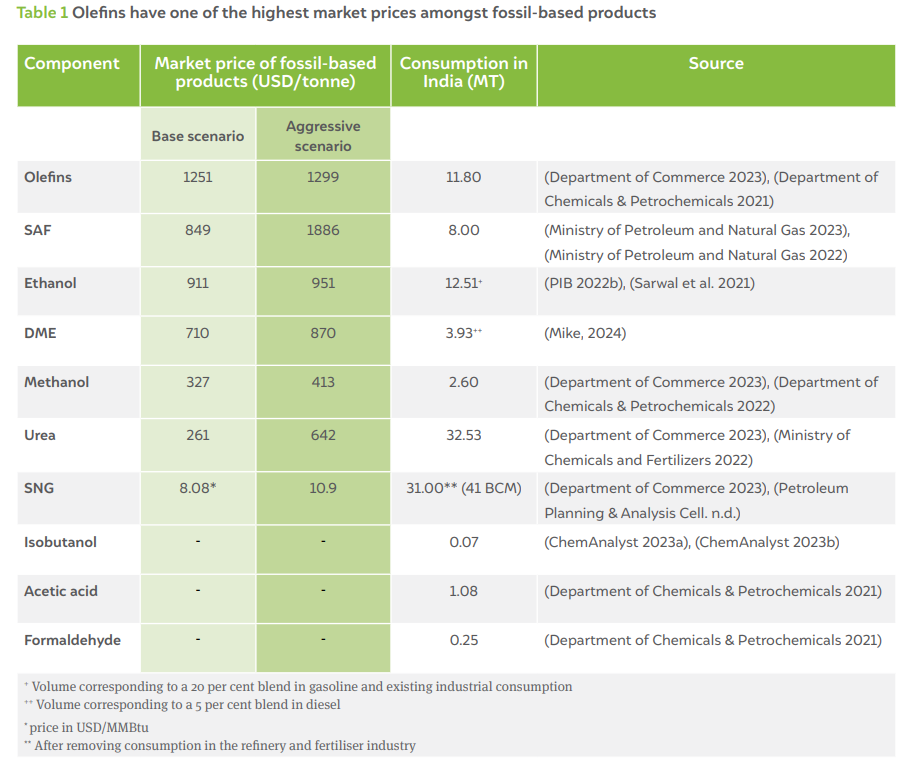
Table 1 presents the market prices of various fossil-based chemicals and fuels and their current consumption in India, which we use to estimate the potential market for CCU products. The prices are indicated for the base scenario and an aggressive scenario. It is worth noting that the consumption of chemicals such as isobutanol, acetic acid, and formaldehyde is very minimal. Hence, while these have been used to evaluate the market size of CCU products in India, they have not been considered for a techno-economic evaluation. Furthermore, while DME and ethanol are gaining attention in India, their consumption as chemicals in the pure form is not significant. However, ethanol can be blended in petrol up to 20 per cent (Sarwal et al. 2021), and DME can be blended in diesel up to 5 per cent (PIB 2023). While the blend percentages of these fuels especially ethanol can be even higher with the use of flex fuel vehicles (FFV), we consider these are ceiling limits due to the policy target set by the government. Therefore, the corresponding consumption values are considered in the study and benchmarked against the respective incumbent fuels. Synthetic natural gas (SNG) consumption, in billion cubic metres, in the table reflects the net consumption after subtracting volumes consumed in refineries and fertiliser plants, as green hydrogen can be directly used in these sectors without converting them into SNG.
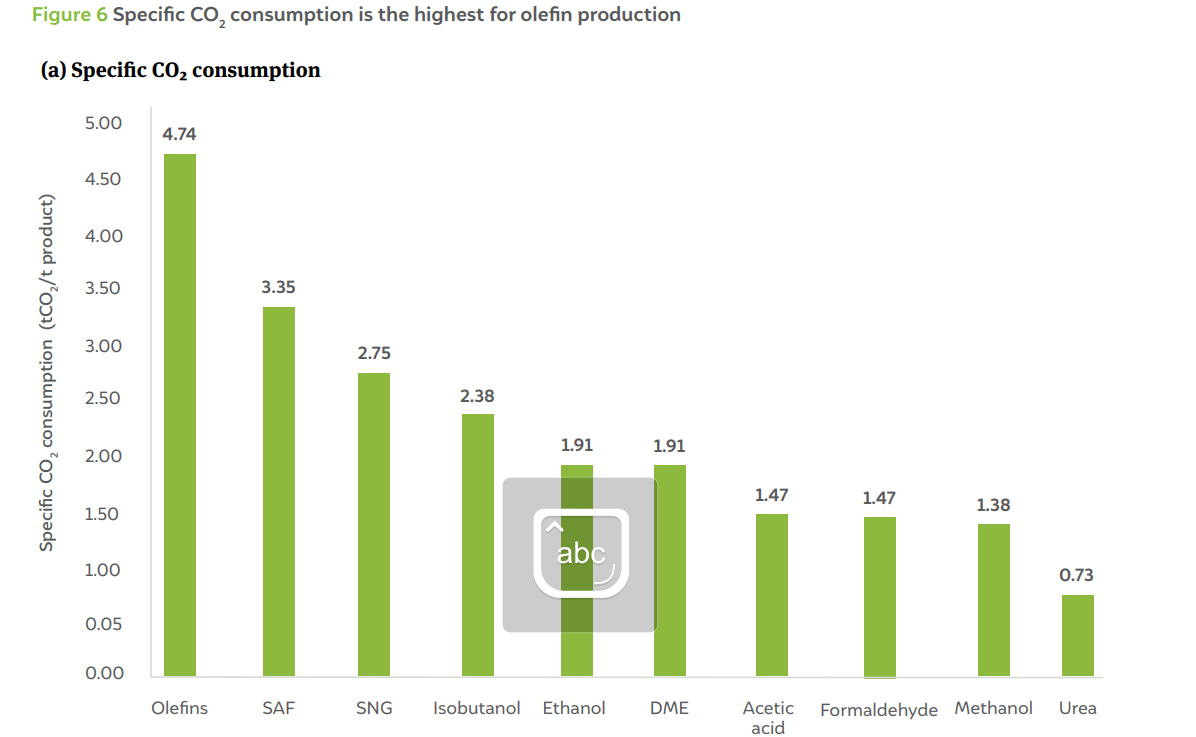
The graph in Figure 6a compares the specific CO₂ consumption for the production of the fuels and chemicals considered in the study. It is highest for the production of olefins like ethylene, followed by SAF. The graph in Figure 6b shows the specific H₂ consumption for producing various fuels and chemicals. While isobutanol production has the highest specific consumption of hydrogen, olefins, SNG, and SAF production require the highest volumes of hydrogen amongst bulk consumers. It must be noted that these values represent the stoichiometric demand for CO₂ and H₂.
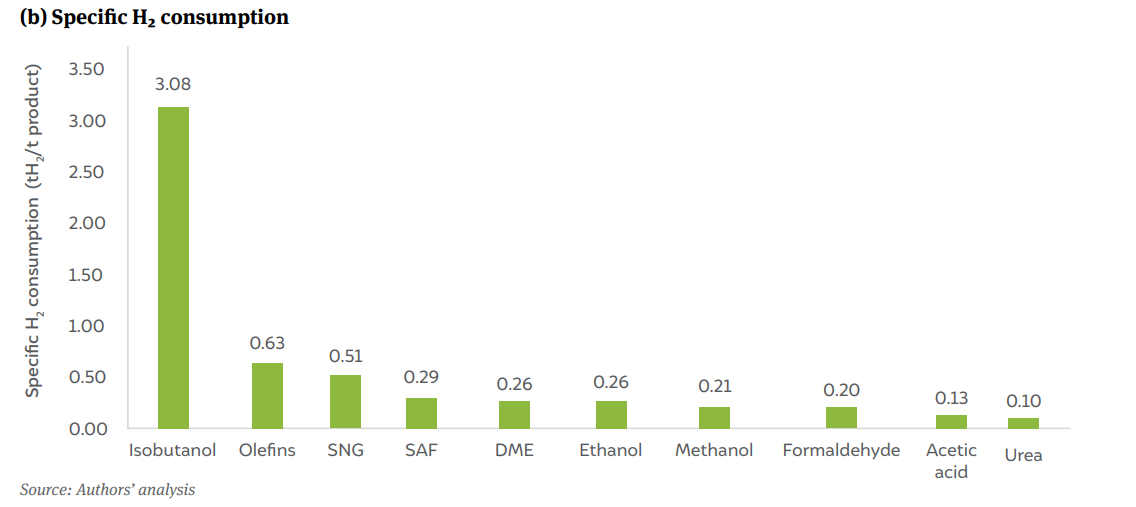
Based on the data presented in Table 1 and the specific CO₂ consumption for each of the chemicals and fuels, the CO₂ consumed to replace each of the fossil-based products with synthetic alternatives is shown in Figure 7a. Given that the specific CO₂ consumption for SNG production is one of the highest, at 2.78 t-CO₂/t-SNG, and the fact that among the fuels analysed, natural gas has one of the highest consumption volume in the country, the cumulative CO₂ utilised or abated by producing the synthetic alternative to natural gas is ~85 MtCO₂. SNG is followed by olefins, SAF, urea, and ethanol, in descending order of consumption rates.
The CO₂ consumed for ethanol and DME production corresponds to the amount consumed when 20 per cent of ethanol is blended in petrol, along with existing industrial consumption, and 5 per cent of DME is blended in diesel. The CO₂ consumption in the ‘others’ category, which includes isobutanol, acetic acid, and so on, is only 2.1 MT, which is a very small amount compared to the consumption in other fuels and chemicals. The study estimates that across all the fuels and chemicals considered, the cumulative CO₂ utilised by producing synthetic alternatives is nearly ~229 MtCO₂ per annum.
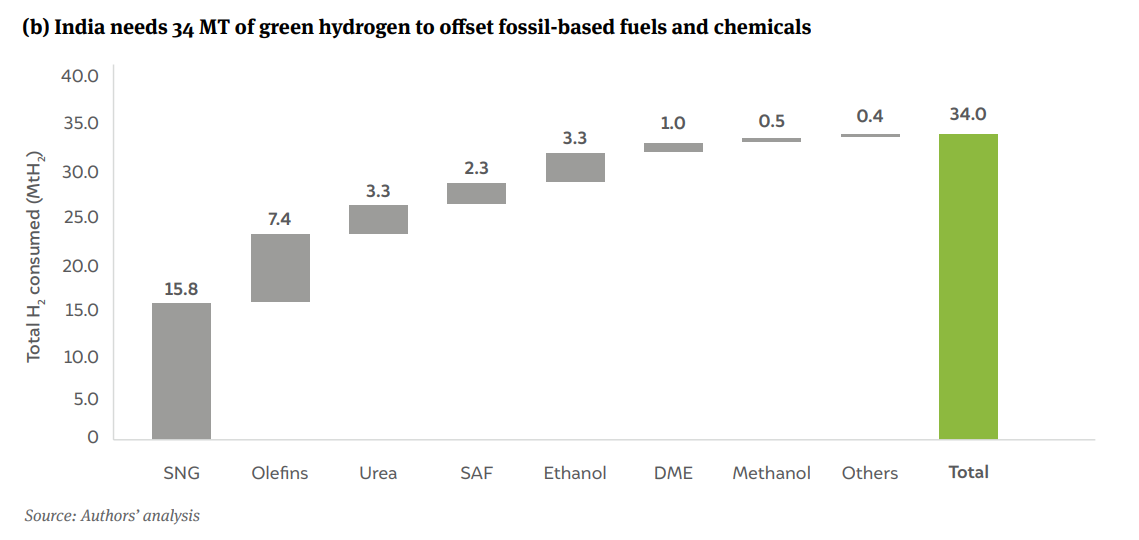
Similarly, Figure 7b shows the product-wise hydrogen consumption pattern. As per the stoichiometric reaction shown in Figure 6, synthesising one tonne of SNG requires half a tonne of hydrogen. Amongst the fuels considered here, SNG production is associated with the highest hydrogen consumption. Consequently, the demand for hydrogen to produce SNG is the highest. A significant amount of hydrogen is also required in the production of other chemicals such as olefins (ethylene), urea, and SAF. In total, the production of these chemicals and fuels requires nearly 34 MT of hydrogen annually.
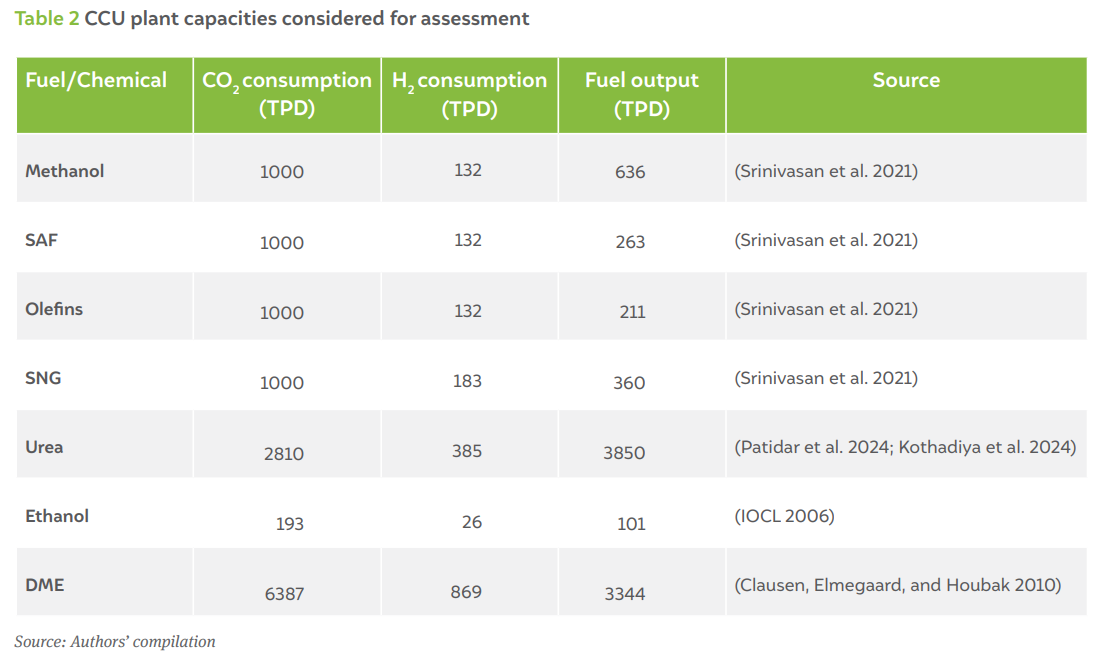
This section of the report deliberates on the technoeconomic aspects of CCU pathways. The technoeconomic assessment are based on the models available in the public domain. For example, we rely on models developed in the literature (Srinivasan et al. 2021) for the cost of methanol, olefins, SAF, and SNG. The cost of urea synthesis with green ammonia is based on our studies for the fertiliser sector (Patidar et al. 2024; Kothadiya et al. 2024), and we rely on results from the literature (Clausen et al. 2011) for the cost of DME. We only take into account ethanol produced through the gas fermentation pathway because we have access to reliable data for this process alone. The capital and operating costs for the gas fermentation technology are obtained from literature sources (IOCL 2006). Table 2 compiles the plant sizes considered for the cost evaluation, which is based on fuel output to cater to existing consumption in the country. Detailed discussions on each model can be found in the respective publications and are not included here for brevity.
We assess two cases – the current (2023) and the future. In the current case, we consider a green hydrogen cost of USD 4.2 per kg and a carbon capture cost of USD 45 per tonne of CO₂. The future scenario considers the best possible case for CCU applications, where the cost of green hydrogen reduces to USD 1 per kg and the cost of CO₂ capture drops to USD 23 per tonne of CO₂. The future scenario essentially indicates the lowest possible cost of a CCU product. While the cost of process chemical plants can also potentially be reduced in the future, the study does not consider this in the future scenario due to its low impact on the overall production cost and the relative maturity of the process equipment used in chemical plants, leaving very little room for improvements that could significantly reduce costs.
Figure 8 compares the levelised cost of the CCU products analysed in the study across current (S1) and future (S2) scenarios with their counterparts produced using fossilbased processes (in blue). Chemicals like isobutanol, formaldehyde, acetic acid, and so on are not included in the current assessment because, as shown in Table 1, their total CO₂ mitigation potential is significantly lower than that of other fuels and chemicals. The results show that, in the current scenario (S1), none of the CCU applications is commercially viable. This can be attributed to high specific hydrogen consumption, as depicted in Figure 6b. For example, for SNG and SAF, green hydrogen constitutes 87 per cent and 69 per cent of the cost, respectively. Essentially, the bulk of the cost of these products can be attributed to the cost of green hydrogen, whereas CO₂ capture costs do not have a significant impact on the cost of CCU products.
In the future scenario (S2), a few applications such as SAF, DME, ethanol, and urea production will become commercially viable. However, applications such as olefin and SNG production do not become commercially viable even in the future scenario. For olefin production, the costs of the process plant and the carbon capture unit itself are as high as the cost of fossil-based olefin, leaving very little to invest in green hydrogen. A similar trend can be observed for SNG production.
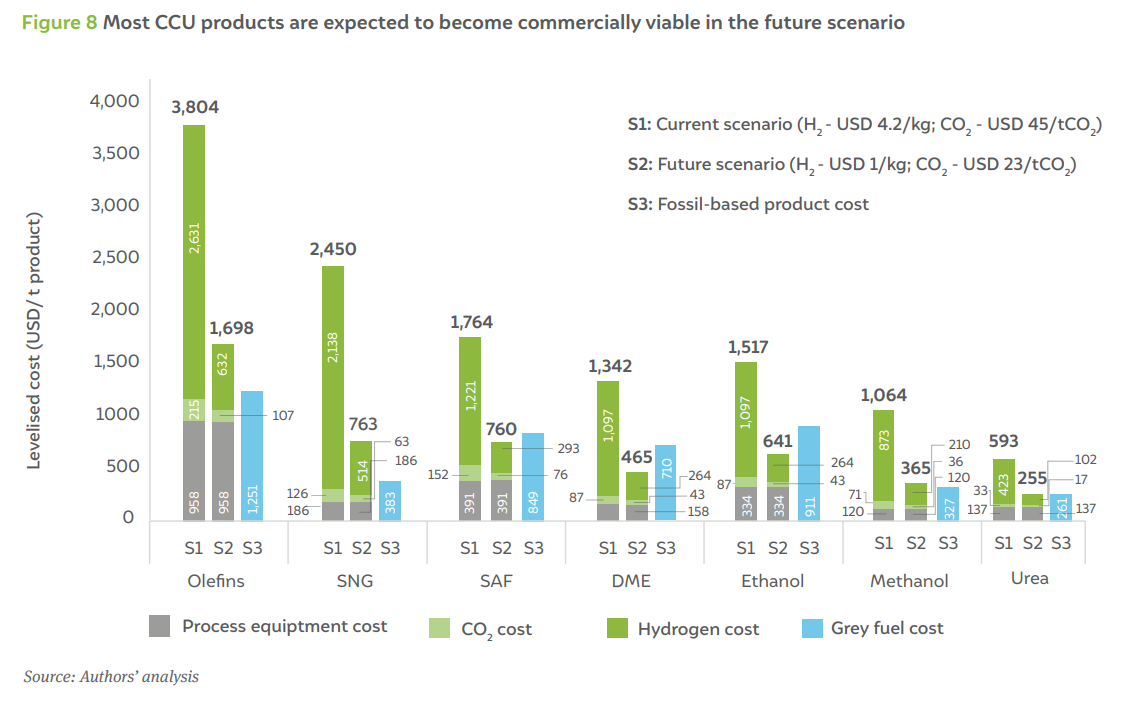
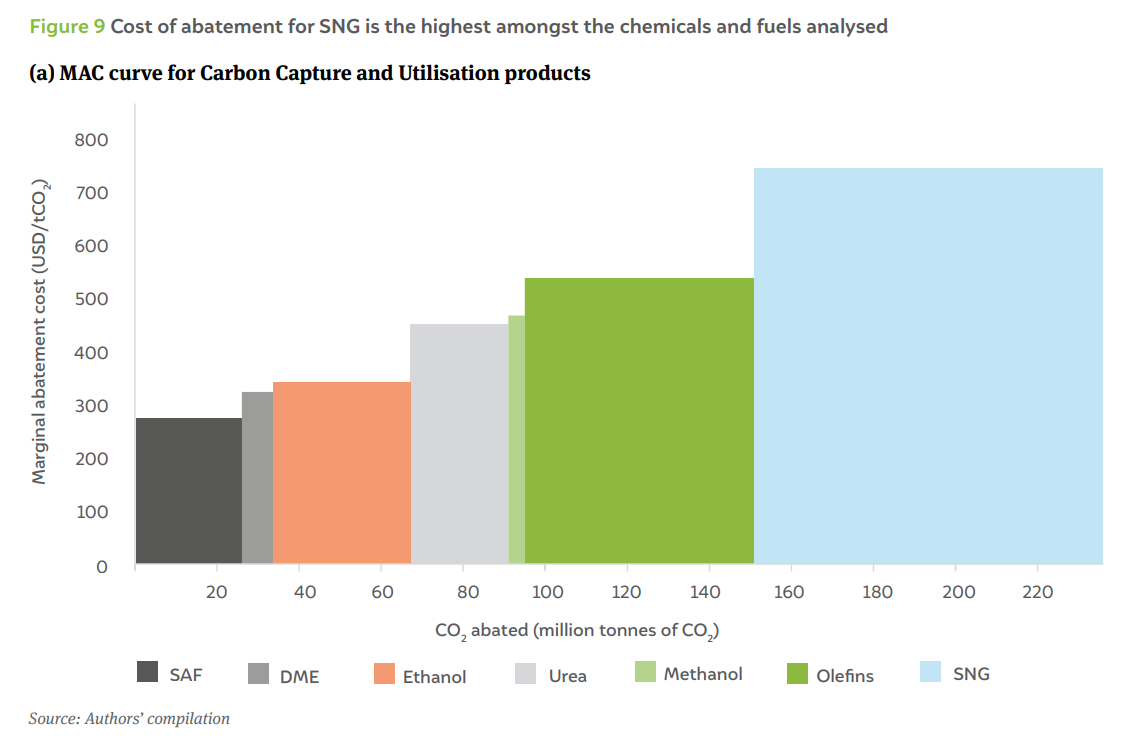
Figure 9 shows that, in the current scenario, all CCU products are significantly more expensive than their fossil-based counterparts. Even in the future scenario, when CCU applications become cost-competitive, there is a need to prioritise them based on the associated cost of mitigation. Furthermore, there is also a need to quantify the cost of CO₂ mitigation for all CCU applications. Marginal abatement cost (MAC) curves estimate the incremental costs incurred for producing a chemical compound using the CCU pathway in comparison to its incumbent fossil-based process. The mitigation costs range from negative to positive – a negative cost indicates a net economic gain from using the CCU pathway, whereas a positive cost indicates that the producer will incur additional expenses to produce a particular chemical or fuel. The MAC curves also indicate the order of prioritising CCU products, with the applications being arranged in ascending order of cost of mitigation. Consequently, applications to the left are to be prioritised first, followed by applications to the right in the sequence.
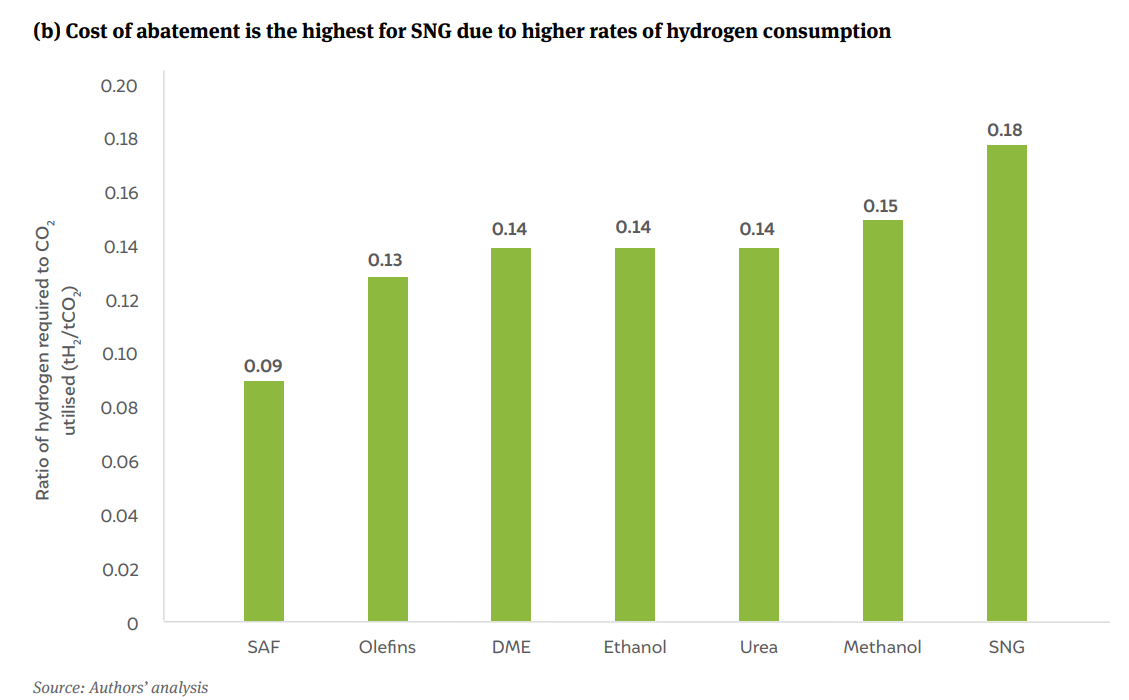
The MAC curve shown in Figure 9a compares the cost of abatement for all the chemicals and fuels analysed in the current scenario. It can be seen that the abatement cost for SNG is the highest, whereas it is the lowest for SAF. Figure 9b shows the rate of hydrogen consumption with respect to the CO₂ utilised. Since this ratio is the highest for SNG, implying hydrogen consumption is the highest for every tonne of CO₂ consumed in this process, the cost of abatement is also the highest. The cost of abatement for DME, urea, methanol, olefins, and SAF is in the range of USD 273–539 per tonne of CO₂; it is the least for SAF at USD 273 per tonne of CO₂. Essentially, the high cost of abatement is primarily due to the cost of green hydrogen, which is taken to be USD 4.2 per kg. The other factor determining the cost of abatement is the cost of the incumbent fossil fuel. Natural gas, which is directly obtained in its natural form, has a lower energy price compared to aviation fuel, which is obtained from processing crude oil.
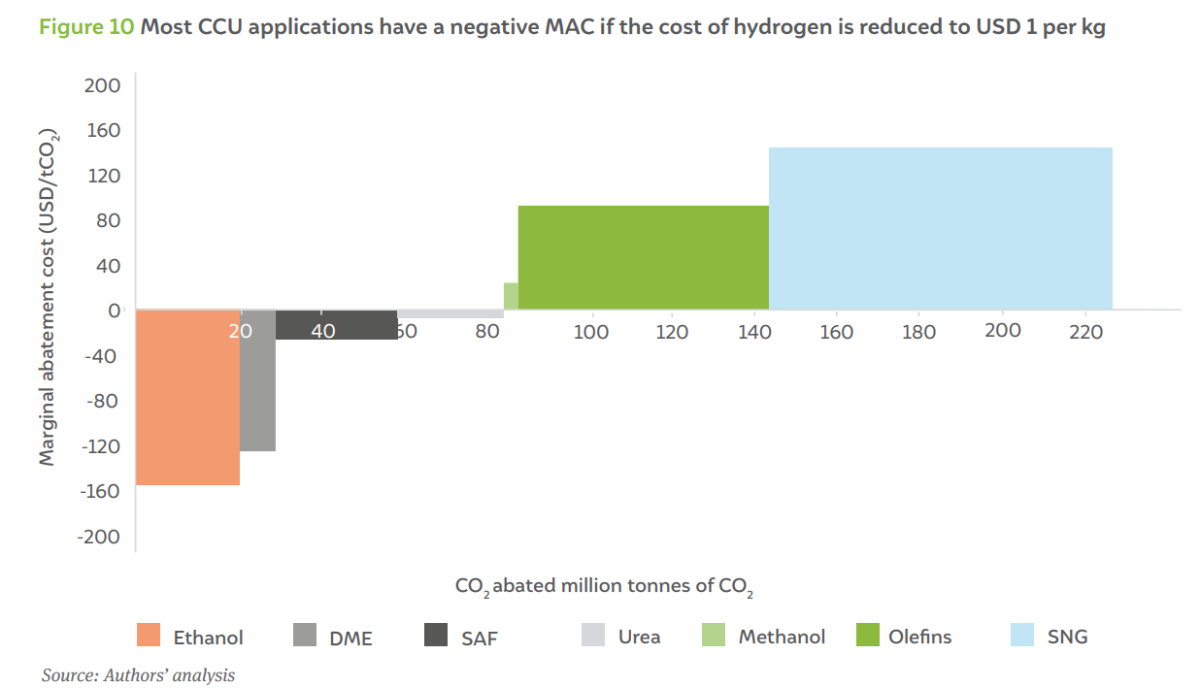
As shown in Figure 8, most CCU applications will become commercially viable in the future. Therefore, it is expected that the MAC for these applications will also be reduced in the future. Figure 10 shows the MAC curve for the CCU applications considered in the study for the future scenario. It is seen that ethanol, DME, and urea will have a negative MAC, implying that there is a net financial gain in deploying these technologies for carbon mitigation. While the abatement costs for the other fuels and chemicals, such as methanol, olefins, and SNG, still remain positive, there is a significant decrease compared to the scenario where the cost of green hydrogen was USD 4.2 per kg. This further validates our earlier argument that the viability of CCU pathways is highly dependent on the cost of green hydrogen.
It is seen that the sequence of MAC across various products changes in Figure 10 compared to Figure 9(a). While SAF has the lowest abatement cost in Figure 9(a), ethanol and DME have lower MAC in Figure 10. This can be attributed to varying hydrogen consumption per unit of CO₂ used across various products indicated in Figure 9(b). SAF consumes only 0.09 tH₂/tCO₂ compared to 0.14 tH₂/tCO₂ for DME and ethanol. Therefore, a decrease in green hydrogen cost from USD 4.2/kg to USD 1/kg significantly improves the competitiveness of ethanol and DME compared to SAF. Consequently, the mitigation cost of ethanol and DME are lower than SAF.
This section highlights the investments required to transition from fossil-based productions of fuels and chemicals to synthetic alternatives. Figure 12 shows the capital expenditure (CAPEX) requirement across all CCU opportunities discussed in the paper for current and future scenarios. Assuming a green hydrogen CAPEX of USD 30 billion per million tonnes per annum (MTPA) (Biswas, Yadav, and Baskar 2020) and CO₂ capture CAPEX of USD 133 million per MTPA (NITI 2022), we estimate that the CAPEX requirement for hydrogen production alone constitutes 77 per cent of the total USD 1307 billion in the current scenario. The CAPEX requirement is the highest for SNG, while it is the least for DME. Therefore, the CAPEX required for hydrogen production must be reduced drastically to utilise CO₂ to effectively produce chemicals and fuels. For the future scenario, we expect an investment of USD 511 billion (INR 38 lakh crore) to produce 34 MTPA of green hydrogen and utilise 229 MTPA of CO₂.
As seen from the discussions in Section 4, all green hydrogen-based CCU applications come at a significant premium, with a CO₂ abatement cost range of 273–744 USD/t-CO₂. As evident from Figure 8, green hydrogen accounts for 69–87 per cent of the cost of any CCU product. Therefore, all CCU products can become commercially viable only if the cost of green hydrogen is reduced significantly. This section of the report identifies the desired cost of green hydrogen needed for CCU applications to become commercially viable by developing a cost curve for green hydrogen.
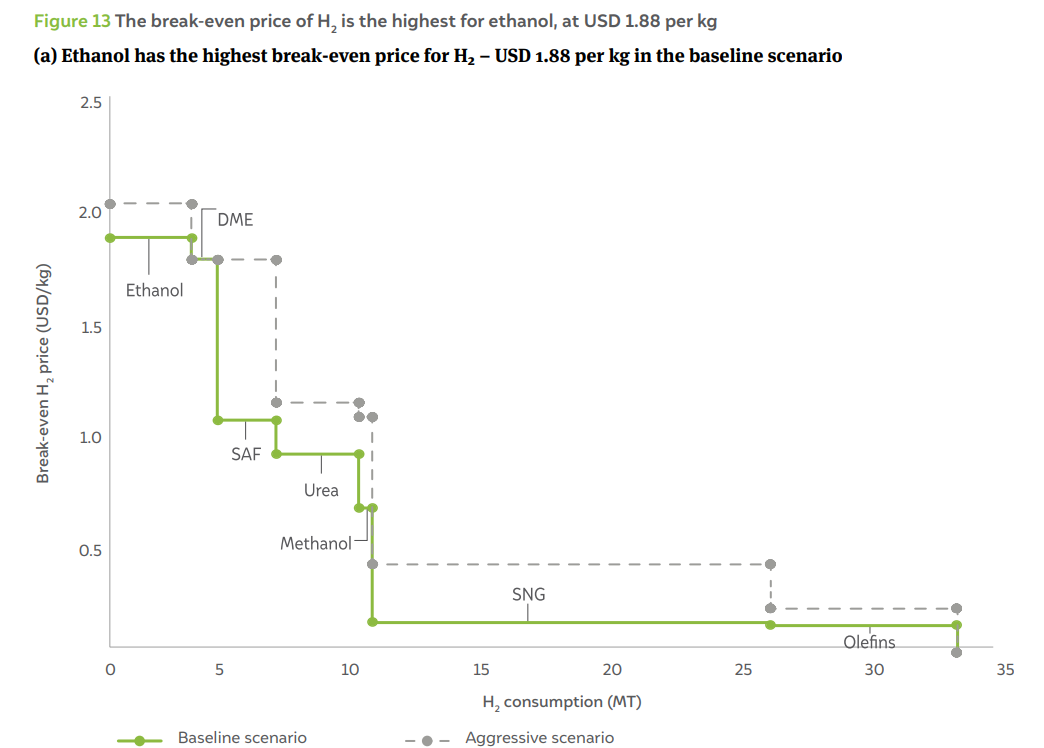
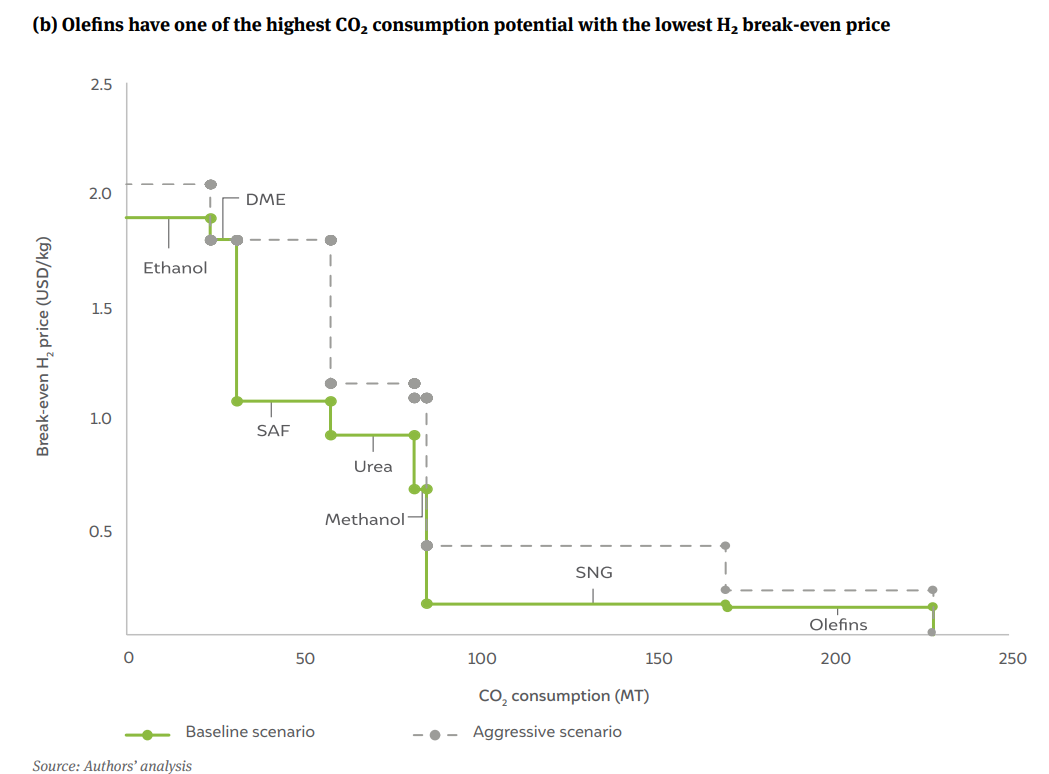
Figure 13 presents the break-even price of hydrogen that is needed to be achieved for CCU applications to become commercially viable as a function of the corresponding amount of H₂ consumed and CO₂ mitigated. Figure 13a shows that the break-even cost of hydrogen is the highest for ethanol. If the cost of DME needs to achieve parity with its fossil-based counterparts, then the cost of hydrogen needs to reduce to USD 1.88 per kg from the current price of USD 4.2 per kg. However, if the price of ethanol increases to a peak of INR 56.4 per litre, then the break-even price of hydrogen used for the production of synthetic ethanol is even higher, at USD 2.04 per kg. The figure similarly presents the cost of hydrogen that needs to be achieved for the other CO₂ utilisation pathways to become commercially viable. The analysis shows that India can potentially consume 6.6 MT of green hydrogen in new applications such as DME, ethanol, and SAF production at a green hydrogen cost of USD 1 per kg. However, for unlocking applications beyond this value, the cost of green hydrogen has to be reduced significantly. Our assessment indicates that India can potentially uptake 16 MT of green hydrogen to produce SNG. However, this becomes commercially viable only if the cost of green hydrogen is reduced to USD 0.14 per kg. There are also other factors to consider with regard to increasing the production of SNG, given that there are diverse decarbonisation levers across various sectors of the economy. For example, using battery electric vehicles (BEVs) might be a better alternative than using SNG in automobiles. Similarly, the use of green hydrogen for producing ethanol might not materialise due to the increase in the use of crop-based ethanol, which has seen significant investments in recent years.
In the aggressive scenario (denoted by dotted lines in the figure), where the prices of the fossil-based counterparts are taken to be equal to their highest value in the past five years and indicated in Table 1, the break-even price is the highest for ethanol at USD 2.04 per kg. Other applications such as SAF, DME, and urea also break even at a green hydrogen price exceeding USD 1 per kg. In both scenarios, the lowest break-even price needs to be achieved for olefins (ethylene). However, unlike in other applications where CO₂ will be emitted back to the atmosphere during combustion (SNG, ethanol, etc.) or use (urea), the CO₂ in olefins will be used for producing petrochemical commodities, enabling its long-term utilisation through recycling.
Figure 13b shows the trend of the break-even cost of green hydrogen as a function of CO₂ consumed across various CCU applications. Our analysis shows that India can mitigate only ~60 MT of CO₂ emissions up to a green hydrogen price of USD 1 per kg. Furthermore, to mitigate an additional 141 MT of CO₂ in the production of SNG and olefins, the green hydrogen price should go below USD 0.13 per kg.
India currently imports a significant share of the fossil fuels it consumes. In 2022, India imported fossil fuels worth USD 209 billion (MoC 2023) to cater to increasing demand. Table 3 lists the consumption of various fossil fuels and the corresponding import bill. Our research shows that by utilising CO₂ to produce synthetic variants of jet fuel, urea, methanol, olefins, and natural gas, India can reduce its import bills by nearly USD 46 billion per year. This will need an investment of USD 1307 billion in the current scenario and USD 511 billion in the future scenario.
For a few CCU products such as SAF, ethanol, and DME, we have normalised the savings in crude oil imports based on equivalent energy. An overall energy balance evaluation of India’s refinery sector indicates that for every 100 units of energy output from refinery products, 97 units of energy are obtained from crude oil, whereas 10 units are consumed by the refinery for various processes. The savings in energy imports from CCU applications are then quantified based on the energy content after applying the correction factor (1.03 (100/97)) for crude oil). In the case of ethanol and DME, the Government of India has set a target of achieving 20 per cent blending with petrol (PIB 2023a), in addition to the existing ethanol demand of 5 MTPA, and 5 per cent blending with diesel (PIB 2023b), respectively. This translates to a reduction in crude oil imports, from which petrol and diesel are produced after refining, to the tune of 7.7 MTPA and 2.6 MTPA, respectively. Consequently, this reduces imports by USD 4.27 billion with ethanol blending and USD 1.4 billion with DME blending. For urea, the import reduction is normalised to liquefied natural gas prices based on the amount of gas consumed for producing hydrogen/ ammonia. In the case of olefins, domestic production is primarily through feedstocks such as naphtha and other gaseous fuels. Production through this route includes additional capital and operational expenses, which have not been taken into account in our analysis due to a lack of reliable data. Consequently, only the final cost of olefins obtained from the literature (Department of Commerce 2023) for olefin imports is taken into consideration for estimating the reduction in import bills.
| Product | Consumption (MTPA) | Reduction in imports (billion USD) | CO2 mitigated (MT) | Total H2 required (MT) |
|---|---|---|---|---|
| SAF | 8.00 | 4.48 | 26.8 | 2.31 |
| Urea | 32.53 | 3.54 | 23.9 | 3.27 |
| Methanol | 2.58 | 0.86 | 3.5 | 0.47 |
| Olefins | 11.80 | 20.83 | 55.9 | 7.38 |
| SNG | 31.00 | 10.49 | 85.3 | 15.77 |
| DME | 3.93 | 1.40 | 7.50 | 1.03 |
| Ethanol | 12.51 | 4.27 | 23.9 | 3.30 |
| Total | - | 45.87 | 226.8 | 33.53 |
Figure 14 presents the emissions from the steel and cement industries and the reduction in emissions that can be achieved through various decarbonisation measures as a Sankey diagram. It is seen that EE, RE, and AFs have a limited role to play in decarbonising these industrial sectors. Our analysis shows that of the 515 MtCO₂ emitted from the cement and steel industries, a major share of 56 per cent of emissions will have to be abated through the CCUS route. Of this, 229 MtCO₂ can be abated through the CCU route, while the remaining has to be sequestered. Given that among the chemicals and fuels analysed natural gas consumption is the highest, the SNG route consumes the bulk of the CO₂ amounting to 86 MtCO₂, and olefins consume 56 MtCO₂. It should be noted that the uptake of CO₂ in SNG and olefin production depends on the cost of green hydrogen, the break-even cost for which is significantly lower than the target considered in the future scenario. Also, as discussed in Section 7, the uptake of CO₂ for producing SNG depends significantly on other decarbonisation alternatives. Therefore, CCS is a must, even if it is for mitigating emissions from the steel and cement industry alone, as CCU options will most likely fall short of the total abatement required in the sector.
As discussed in Section 4, CCU products have a significant premium over the incumbent fossil-based fuels and chemicals. This is expected to impact the cost of producing steel and cement. The following sections assess the impact of CCU products on the steel and cement industries.
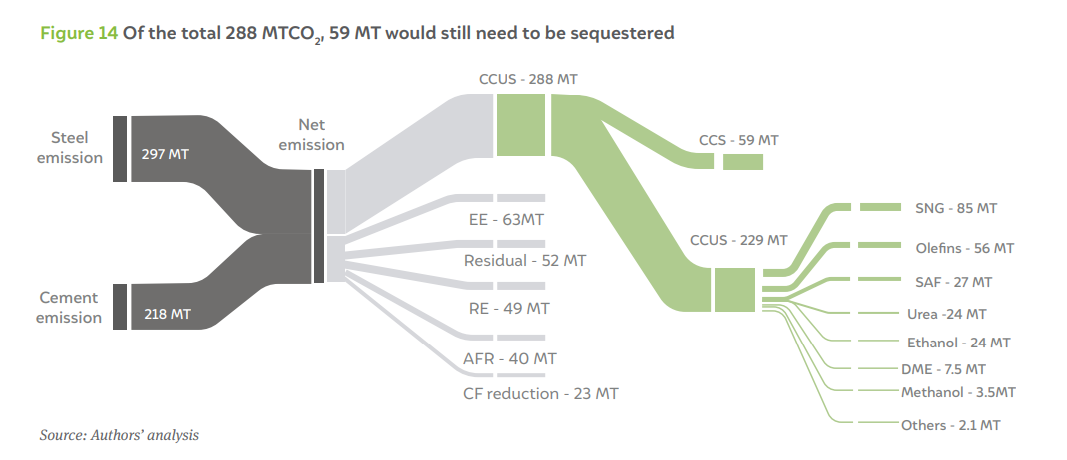
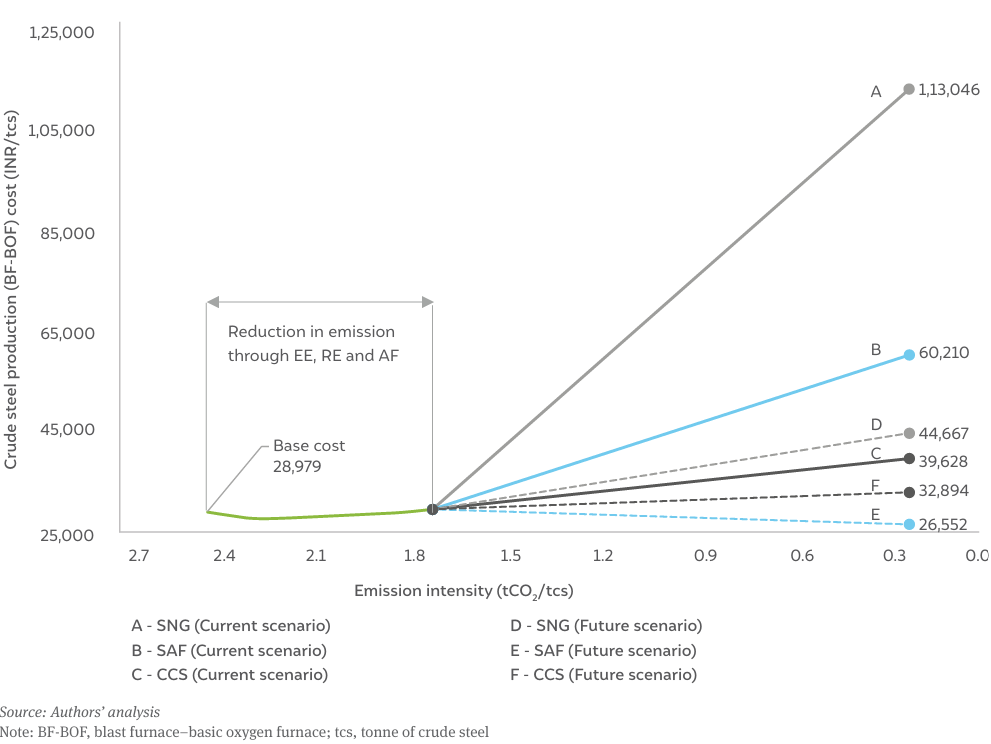
Figure 15 compares the price increase of steel produced through the blast furnace-basic oxygen furnace (BF-BOF) route for different CO₂ utilisation pathways. The price increase was estimated considering a base price of steel of INR 28,979 per tcs (USD 386 per tcs). The estimation considers the scenario in which all other decarbonisation measures such as EE, RE, AFs, and CCS have been exhausted (Elango et al. 2023). With these measures in place, the steel industry can reach an emissions intensity of only 1.55 tonnes of CO₂/tcs. Beyond this, further reduction in emissions intensity can be achieved only through the CCUS pathways. The figure also shows the increase in steel cost across current and future scenarios for the extremes that have the highest and the lowest cost of CO₂ mitigation. We compare the change in steel cost with a scenario where emissions reduction is achieved through CCS. It is seen that the increase in the cost of steel is the highest for the SNG pathway, at INR 1,13,046 per tcs (USD 1507 per tcs), which is nearly a 300 per cent increase over the base price. In contrast, the price increase for the SAF pathway is the least, at 107 per cent. The price increase curves for other CCU applications are between these two extremities.
The graph also shows that mitigating residual CO₂ through CCS will come at a 37 per cent premium and is cheaper than any other CCU-based decarbonisation measure in the current scenario.
For the future scenario, it is seen that the steel cost changes by (–)8 and 54 per cent with SAF and SNG adoption, respectively. As indicated in Figure 10, SAF production has a negative cost of abatement. Consequently, the steel production cost is actually reduced with the adoption of SAF as a mitigation measure. In contrast, there is an increase in the cost of steel with SNG as a decarbonisation option primarily because of the positive mitigation cost. With CCS at 30 USD/tonne, the cost of steel increases by only 14 per cent, which is intermediate between the costs for SAF and SNG pathways.
Figure 16 compares the cost of decarbonising cement for various CO₂ utilisation pathways after exhausting mitigation options such as EE, RE, AFs and raw materials (AFRs), and CCS (Nitturu et al. 2023). If the base price of cement is considered to be INR 7456 per tonne (USD 99 per tonne) and if the residual emissions after exhausting EE, RE, and AFR are mitigated through the CCUS pathway (beyond an emissions intensity of 0.45 tCO₂ per tonne), then the price of near-zero cement increases by 103–283 per cent depending on the CCU measure (SAF or SNG) adopted. With a CCS cost of 90 USD per tonne, the price increases by 34 per cent. However, as seen in the cost curve of steel, the cost of near-zero cement changes by (–)11 to 51 per cent in a future scenario. With CCS, there will always be an increase in production costs due to a positive abatement cost.
Developing and scaling up CCU ecosystem in India faces many challenges. A few challenges are listed below:
CCUS will play a pivotal role in achieving net-zero emissions, especially in hard-to-abate industrial sectors such as steel and cement. The study estimates that India can utilise 229 MTPA of CO₂ for producing valueadded fuels and chemicals. However, this will also need 34 MTPA of green hydrogen, which is significantly higher than the 5 MTPA target set under the NGHM. Furthermore, unlocking all CCU opportunities will require an investment of USD 1.3 trillion today, which will reduce to USD 511 billion if the cost of green hydrogen is reduced to USD 1 per kg (from USD 4.2 per kg considered for 2024).
The challenges related to the cost of CCU products still persist. Our assessment indicates that CCU products have a MAC of USD 273–744 per tonne of CO₂ today. Consequently, CCU products are 89–540 per cent more expensive than their fossil-based counterparts. However, with a future reduction in the cost of green hydrogen and carbon capture, most CCU applications such as urea, SAF, ethanol, and DME production will become commercially viable. It is also evident from our analysis that despite utilising CO₂ in the production of chemicals and fuels, a significant amount of CO₂ will still need sequestration.
For instance, out of the 297 and 218 MtCO₂ emitted by the steel and cement industries, approximately 288 MtCO₂ needs to be abated by CCUS alone, with 229 MtCO₂ to be addressed by CCU and 59 MtCO₂ by CCS exclusively. Based on our analysis, we recommend the following:
Unlocking the Potential for a Gas-Based Economy in India
How Secure is India’s Energy Future?
Advancing India’s Green Steel Transition
CO₂ Pipeline Network for Carbon Capture and Storage in India
Bharat Cleantech Manufacturing Platform: Green Hydrogen Indigenisation Pathways